HAL Id: hal-01668792
https://hal.archives-ouvertes.fr/hal-01668792
Submitted on 10 May 2021HAL is a multi-disciplinary open access
archive for the deposit and dissemination of sci-entific research documents, whether they are pub-lished or not. The documents may come from teaching and research institutions in France or abroad, or from public or private research centers.
L’archive ouverte pluridisciplinaire HAL, est destinée au dépôt et à la diffusion de documents scientifiques de niveau recherche, publiés ou non, émanant des établissements d’enseignement et de recherche français ou étrangers, des laboratoires publics ou privés.
In situ 3D characterization of fatigue cracks
displacement fields
J. Lachambre, Jean-yves Buffiere, Julien Réthoré, Arnaud Weck
To cite this version:
J. Lachambre, Jean-yves Buffiere, Julien Réthoré, Arnaud Weck. In situ 3D characterization of fatigue cracks displacement fields. Frattura ed Integrità Strutturale / Fracture and Structural Integrity, Università di Cassino, 2013, pp.50-53. �10.3221/IGF-ESIS.25.08�. �hal-01668792�
In situ 3D characterization of fatigue cracks displacement fields
Joel Lachambre, Jean-Yves Buffiere
MATEIS Lab. UMR CNRS 5510 INSA Lyon France
Julien Réthoré
LAMCOS Lab. UMR CNRS 5259 INSA Lyon France
Arnaud Weck
Univ. of Ottawa Canada
ABSTRACT. The three dimensional growth of fatigue cracks in samples of nodular graphite cast iron is
characterized using laboratory X-ray computed tomography. The cracks grow from laser machined artificial defects, their development is monitored in situ using laboratory X-ray computed tomography (lab. CT) and Digital Volume Correlation (DVC). The combination of both techniques gives access to the 3D displacement field at the tip of the crack (mainly mode I opening).
KEYWORDS. Cast iron; Digital volume correlation; Crack tip displacement; In situ.
INTRODUCTION
n their early stage of propagation, fatigue cracks have a strong three dimensional character. This is because, in structural materials, crack initiation occurs at heterogeneities such as holes, surface scratches, harder or softer second phase particles, well oriented grain etc. Once initiated, such small cracks strongly interact with the first surrounding grains and, at low stress levels, a large number of fatigue cycles is necessary before the propagation rate of a crack at the specimen surface is comparable to the propagation rate in the bulk of the specimen. Fatigue models tend to ignore this three dimensional aspect of crack growth partly because reliable experimental data was (and still is) lacking. This is a crucial issue because a very large fraction of the fatigue life of real components correspond to the growth of such small 3D cracks [1].
Various 3D-imaging techniques have been used in previous studies to describe the 3D propagation of fatigue cracks. - SEM/FIB observations: this destructive approach can provide very high resolution images of a restricted area (typically 20 µm3) around the crack tip but in situ experiment are obviously impossible.
- Laboratory X ray computed tomography (lab. CT)is a non-destructive technique useful for long cracks. The resolution is still rather low for direct imaging of short cracks even under load.
- Synchrotron radiation computed tomography (SR CT) has been used for in situ characterisation of crack initiation and growth; very good detectors coupled to phase contrast offer a better resolution than in the case of lab. CT but the price to pay is the small (sub millimetric) sample size and limited availability of relevant synchrotron beamlines.
It has been shown in the past that lab. CT can be used to map displacement fields at the tip of through thickness fatigue cracks [2]. However so far, the studied cracks have been characterized in specimens carved out from larger samples and the influence of sample preparation (relaxation of stress) could not be excluded. In this work a method has been developed to initiate and grow a crack in a single sample thus providing a more reliable picture of the displacement field at the tip of a crack grown in situ.
EXPERIMENTAL
he material used in this study is a nodular graphite cast iron with a homogeneous dispersion of graphite nodules which are used as natural markers for DVC [2]. The cracks are initiated from artificial defects produced by laser machining [3].
The fatigue cycles are applied on small dog bone samples (square cross section 1.5 mm2) using a specially designed fatigue
machine which allows to use a distance between the sample and the X-ray source lower than 20mm.
A standard laboratory tomograph available at MATEIS [4] has been used. A current of 174µA and a mean of 3 radiography with an exposure time of 1 second have been used 720 angular positions have been recorded which corresponded to a scan time of 45 minutes. The reconstruction time (weighted filtered back projection, Feldkamp algorithm) takes approximately 15 minutes for a 560×560×900 voxels 3D image.
The crack shape evolution is studied through the residual of the DVC which correspond to the difference between the reference and the deformed and corrected volumes [2]. Once the sample is set up in the tomograph, two scans are recorded at low stress (40 MPa) and a scan at high stress (290 MPa). The sample is cycled in situ at constant a stress amplitude of 300 MPa (load ratio: 0.1). In the beginning of the experiment 100,000 cycles are applied to the sample before a first scan is recorded. Then 2 scans are recorded every 15 kcycles, one at 40 MPa and an other at 290 MPa, to monitor the crack evolution as described in [2].
A C8-DVC multiscale algorithm with an eight node cubic element is used to compute the displacement fields in the loaded specimen [5]. Two kinds of correlation are performed during the experiment: first between a reference volume acquired before cycling under low stress and a deformed volume under high stress at each step of cycling. Then a correlation between the volume at low stress and the volume at high stress is also performed at each step. The first kind of analysis gives access to the crack shape evolution while the second is used to map the crack opening displacement (COD).
RESULTS
he DVC analysis during cycling is carried out with 32 voxels elements, over a volume of 11×11×15 C8,elements. This mesh is quite coarse considering that, typically, at ~ 180 kc the crack is contained in only 8 elements. Nevertheless the crack morphology can be estimated from the DVC residual. Similar images have been obtained for the cracks emanating from a corner defect.
Figure 1: Surface crack evolution at 160 kc, 175 kc, 190 kc, 205 kc and 240 kc obtained from DVC residuals (the cross section of the sample is 1.5x1.5 mm2).
An extended version of DVC called X-DVC (based on the principle of the extended finite element method. [6]) is used to post process the 3D images recorded between the scans at low and high stress. The results of X-DVC on one corner and one surface crack can be visualised in Fig. 2. As the position of the crack front is not known, a discontinuous enrichment is added over the whole cross-section.
Those displacement fields can be used to compute stress intensity factor values along the crack front using Williams series [7] as described in [2]. In this previous work, stress intensity factors were computed within parallel reconstructed sections containing the stress axis and the crack front normal. The crack was assumed to be straight and the planes used for fitting the Williams series were parallel. The crack front position was found by minimizing the super singular term n=-1 of the series for the mode I case.
T
Figure 2: Mode I component of the displacement field of the corner crack after 180kc (left) and the surface crack after 200kc (right): X-DVC analysis. The scale is given in voxel (1voxel= 3.5µm).
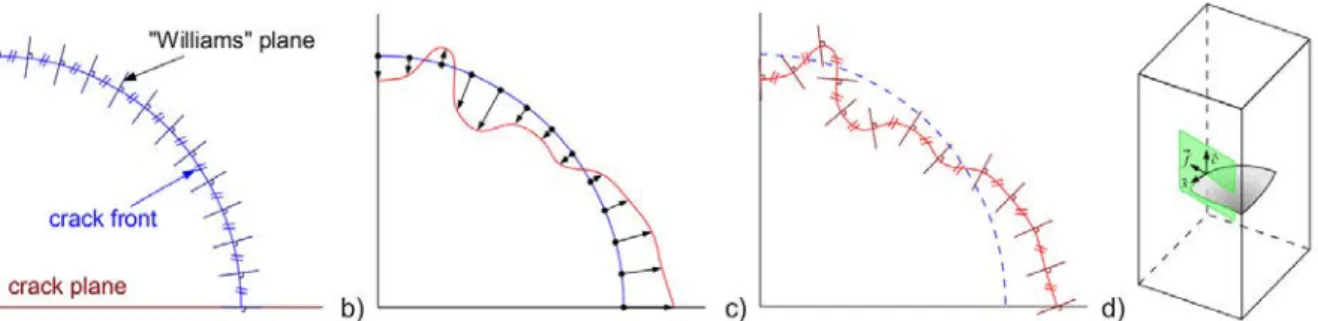
In this work, the studied cracks having a three-dimensional shape, a new method has been used for extracting K values (see Fig. 3 for a summary). An approximate position of the crack front is first derived from the DVC residuals (Fig. 2a). A series of regularly spaced planes is built along this first crack front and used to fit a first set of Williams series. By a minimization of the super singular term n=-1 of the series, a new position of the front is found ( red line in Fig. 3b) a new set of planes is build and the crack front detection is carried out again. The « correct » crack front position is found when the crack front position is stable between two iterations. The different mode I, II and III stress intensity factors can then be computed.
Figure 3: Schematic illustration of the iterative crack front extraction process : an initial crack front position is assumed (a) to build a series of planes which will be used for fitting the Williams series. Once the new position of the front is found (b) (see the text for details) a new series of planes is build (c) ; for non planar cracks, the process can be carried out in 3D (d).
Examples of stress intensity profiles obtained along the crack fronts of the propagating cracks can be obtained with this method and used to plot local da/dN=f(DK) laws.
SUMMARY
he 3D propagation of small fatigue cracks initiating from an artificial defect in a cast iron sample has been characterized in situ and analyzed using laboratory X-ray computed tomography and DVC.
The process of creating small artificial defects with laser beam gives an appropriate way to initiate a crack in this material.
The DVC analysis with a relatively coarse mesh provides during cycling a valuable information on the crack propagation. The X-DVC analysis allows to estimate directly the crack opening displacement over the entire crack surface.
Displacement fields extracted by DVC can be used to compute local values of the stress intensity factor along the curved crack fronts.
ACKNOWLEDGEMENTS
his work was funded by the French ANR program (grant ANR-09-BLAN-0009-01 - RUPXCUBE Project).
T
REFERENCES
[1] Suresh, S., Fatigue of Materials Cambridge Univ. Press (1998)
[2] Limodin, N., Réthoré, J., Buffière, J.-Y., Hild, F., Roux, S., Ludwig, W., Rannou, J., Gravouil, A., Influence of closure on the 3D propagation of fatigue cracks in a nodular cast iron investigated by X-ray tomography and 3D volume correlation, Acta Materialia 58 (2010) 2957-2967.
[3] Weck, A., Crawford, T.H.R., Borowiec, A., Wilkinson, D.S., Preston, J.S., Femtosecond laser-based fabrication of a new model material to study fracture, Applied Physics A: Materials Science and Processing 86 (2007) 55-61.
[4] Buffiere, J.-Y., Maire, E., Adrien, J., Masse, J., Boller, E., In Situ Experiments with X ray Tomography: an Attractive Tool for Experimental Mechanics, 50 (2010) 289-305.
[5] Roux, S., Hild, F., Viot, P., Bernard, D., Three-dimensional image correlation from X-ray computed tomography of solid foam}, Composites Part A: Applied Science and Manufacturing, 39 (2008) 1253-1265.
[6] Réthoré, J., Tinnes, J.-P., Roux, S., Buffière, J.-Y., Hild, F., Extended three-dimensional digital image correlation (X3D-DIC) Comptes Rendus Mécanique 336 (2008) 643-649.