UNIVERSITÉ DE MONTRÉAL
ALL PHOTONIC BANDGAP
BRAGG FIBER REFRACTOMETERS
HANG QU
DÉPARTEMENT DE GÉNIE PHYSIQUE ÉCOLE POLYTECHNIQUE DE MONTRÉAL
THÈSE PRÉSENTÉE EN VUE DE L’OBTENTION DU DIPLÔME DE PHILOSOPHIAE DOCTOR
(GÉNIE PHYSIQUE) DÉCEMBRE 2013
UNIVERSITÉ DE MONTRÉAL
ÉCOLE POLYTECHNIQUE DE MONTRÉAL
Cette thèse intitulée:
ALL PHOTONIC BANDGAP BRAGG FIBER REFRACTOMETERS
présentée par :
en vue de l’obtention du diplôme de : QU Hang
a été dûment acceptée par le jury d’examen constitué de : Philosophiae Doctor M. GODBOUT Nicolas M. , Ph.D, président SKOROBOGATIY Maksim A. M.
, Ph.D, membre et directeur de recherche LEBLOND Frédéric
M.
, Ph.D, membre KIRK Andrew G., Ph.D, membre
DEDICATION
I would like to dedicate this thesis to my family and friends, especially to my mother and father for your unconditional love and support.
ACKNOWLEDGEMENT
I would like to express my heartfelt gratitude to my research supervisor, Prof. Maksim Skorobogatiy, for offering me the opportunity to pursue my scientific dream, for guiding me during my Ph.D study, for encouraging and supporting me when I struggled in the predicaments, and for spurring me when I needed it.
I would like to thank all my friends and colleagues in Engineering Physics, Ecole Polytechnique de Montreal. Especially, I want to thank Bora Ung, Alexandra Dupuis for your assistance of the theoretical simulations involved in my projects. I also thank Anna Mazhorova, Stephan Gorgutsa, Mathieu Roze, Andrey Markov, Frederic Desevedavy, Ning Guo, Niyaz Madhar, Yang Liu and Imran Syed for the valuable discussions, constructive interactions and mutual support during the last four years.
I want to thank the technicians in our group, Francis Boismenu and Yves Leblanc. You two are wonderful colleagues who not only provide plenty of technical assistance, but also offer many useful advices for my daily life.
RÉSUMÉ
Un réfractomètre est un senseur optique permettant de mesurer l’indice de réfraction d’une substance. Depuis que Ernst Abbe a inventé le premier réfractomètre de laboratoire dans les années soixante du dix-neuvième siècle, d’importants efforts ont été faits pour développer de nouveaux types de spectromètres avec une meilleure résolution et une empreinte plus petite. De nos jours, la réfractométrie est une technique fiable largement utilisée dans de nombreux domaines scientifiques et industriels, soit en ce qui a trait aux senseurs biologiques et chimiques, aux tests médicaux, à la gradation des bijoux, à l’industrie pharmaceutique, etc. Récemment, les réfractomètres à base de fibre ont attiré beaucoup l’attention grâce à leurs avantages uniques : leurs faibles pertes, leur légèreté, leur immunité à l’interférence électromagnétique, leur résistance aux environnements hostiles, leur passivité électrique et la possibilité de multiplexage. Aujourd’hui encore, la recherche et le développement de nouveaux réfractomètres à base de fibre ayant de plus hautes résolutions, de plus petites empreintes et un faible coût constituent encore le principal sujet de recherche en réfractométrie.
Dans cette thèse, nous proposerons et fabriquerons expérimentalement un réfractomètre à base de fibre servant à la détection de faibles changements d’indice de réfraction dans des échantillons liquides. La composante principale de ce réfractomètre est une fibre de Bragg creuse, possédant un cœur creux entouré par une alternance de couches de polyméthacrylate de méthyl (PMMA) et de polystyrène (PS) servant de réflecteur de Bragg. Le mécanisme de base de cette fibre est la détection de résonance; les variations d’indice de réfraction de l’échantillon liquide induisent un changement de guidage résonant de la fibre, changeant ainsi l’intensité et la fréquence de résonance de la transmission. Les simulations théoriques et la caractérisation expérimentale sont faites pour confirmer les propriétés de ce mécanisme. De plus, nous étudierons en détail les performances de ce réfractomètre à base de fibre de Bragg en s’attardant à la sensibilité, à la plage dynamique, aux pertes d’insertion/couplage, au temps de réponse et à la dépendance de la sensibilité en fonction de la longueur de la fibre. Nous démontrerons expérimentalement que la sensibilité atteint 1400 nm par unité d’indice de réfraction (RIU), ce qui est comparable à la sensibilité propre aux autres réfractomètres à base de fibre microstructurée, et même aux réfractomètres basés sur la résonance de plasmon de surface. Nous noterons aussi que le temps de réponse du réfractomètre développé dans notre laboratoire est beaucoup plus petit que celui des
réfractomètres à fibres conventionnelles, puisque la taille du cœur creux de la fibre est environ 100 fois plus large que la taille des trous de la fibre. Cette sensibilité est indépendante de la longueur de la fibre, ce qui nous permet de bâtir un système très sensible et compact en utilisant plusieurs centimètres de fibre, ou en employant une bobine de fibre. De plus, ce réfractomètre est avantageux du point de vue de la facilité de fabrication et de la possibilité de production de masse puisqu’il peut être obtenu en utilisant un seul étirage de fibres, sans post-traitement additionnel, comme la gravure chimique ou le polissage mécanique. Les autres avantages de ce réfractomètre consistent en son faible volume d’échantillons liquides, son temps de réponse court (1 seconde pour 40 centimètres de fibre) et la simplicité du mécanisme de détection.
Une autre partie de la thèse portera sur la conception de systèmes tout-fibre où les sous-composantes du réfractomètre seront également basées sur des fibres. Les instruments spectroscopiques jouent un rôle important dans plusieurs des réfractomètres utilisant des méthodes de détection spectrale. Les spectromètres conventionnels emploient des éléments dispersifs délicats tels que des prismes ou des réseaux mobiles, ce qui augmente le coût des dispositifs et demande un temps d’acquisition relativement long. De plus, la résolution de ces spectromètres est proportionnelle à la longueur du chemin optique dans le spectromètre, ce qui les rend difficiles à miniaturiser et à intégrer dans un système compact. Le développement de spectromètres compacts, à faible coût et pouvant être intégrés dans des dispositifs à base de fibres en est donc venu à constituer une direction importante pour le développement d’instruments de spectroscopie de nouvelle génération.
Dans cette thèse, nous démontrerons par surcroit qu’un spectromètre basé sur un ensemble de fibre de Bragg peut être utilisé dans le réfractomètre décrit ci-haut pour remplacer le spectromètre traditionnel à base de réseaux. En tout, 100 fibres de Bragg à cœur plein possédant des bandes interdites complémentaires se chevauchant partiellement ont été choisies comme base du spectromètre. Le système est calibré en utilisant une source monochromatique ajustable. Cette lumière incidente est filtrée par l’ensemble des fibres et est convertie en une image mesurée par une caméra CCD monochrome. Nous développerons ainsi un algorithme de « matrice de transmission » pour associer les images de la caméra au spectre d’essai, avec une calibration préalable. Le spectre est reconstruit à l’aide d’une pseudo-inversion de la matrice de transmission de l’ensemble de fibres à l’aide de la décomposition en valeur singulières (SVD). Lorsque nous utilisons ce système pour mesurer des filtres commerciaux, le centre du spectre d’essai peut
toujours être reconstruit à quelques pourcents de sa vraie valeur, peu importe sa position et sa largeur; même si les bandes interdites des fibres individuelles sont larges (60 nm – 180 nm), le spectromètre a une résolution de 20 – 30 nm, puisqu’une importante quantité de ces fibres sont utilisées pour la détection. Nous analyserons ensuite en quoi le bruit expérimental affecte la qualité de la reconstruction spectrale et proposerons plusieurs méthodes pour minimiser cette influence. Somme toute, ce spectromètre est une implémentation abordable tout-fibre pouvant être naturellement intégré aux transducteurs à fibres. Il est peu dispendieux du fait qu’il est basé sur des fibres de polymère, permet l’opération rapide du système, puisqu’il ne possède pas de parties mobiles, et offre un couplage efficace avec les autres dispositifs à fibres.
Finalement, nous intégrerons les deux dispositifs étudiés, soit le transducteur à base de fibres cœur-plein et le spectromètre à base de fibres à cœurs creux pour obtenir un réfractomètre tout-fibre complet, ayant une haute sensibilité et qui permettra la mesure d’échantillons liquides. Le plus grand impact technologique de ce travail se traduirait par l’implémentation de détecteurs optiques hautement intégrés. Nos recherches sur le sujet semblent nous permettre d’affirmer qu’il s’agirait de la première réalisation concrète d’un senseur tout-fibre modulaire où l’intégralité des éléments est à base de fibres. Nous croyons qu’il pourrait être possible d’assembler un système complet en faisant une épissure des modules fibrés individuels, comme la fibre d’illumination, le réfractomètre à fibres et le spectromètre tout-fibre, et ce, dans un futur proche; l’idée est indubitablement des plus intéressantes pour les entreprises.
ABSTRACT
A refractometer is an optical sensor that can be used to measure the refractive index of a substance. Ever since Ernst Abbe invented the first laboratory refractometer in the late sixties of the nineteenth century, tremendous efforts have been undertaken to develop various types of refractometers with better resolution and smaller footprint. Nowadays, refractometry becomes a reliable technique that is widely used in a variety of scientific and industrial fields such as bio/chemical sensing, food industry, medical/clinical examination, jewelry gradation, pharmaceutical and cosmetic industry, to name a few. In recent years, fiber-based refractometers have drawn considerable attention due to their unique advantages such as low signal loss (attenuation), light weight, immunity to electromagnetic interference, resistance to harsh environments, electrical passivity, and possibility of multiplexing. To date, the R&D (research and development) of novel fiber-based refractometers with advantages of high sensitivity, small footprint and low cost still constitutes the main research topic in refractometric studies.
In this thesis, we firstly propose and experimentally demonstrate a fiber-based refractometer for sensing small changes in the refractive index of liquid analytes. The key component of the refractometer is a hollow-core polymer Bragg fiber, which features a large hollow core surrounded by an alternating polymethyl methacrylate (PMMA)/polystyrene (PS) multilayer as a Bragg reflector. This Bragg fiber refractometer operates on a resonant sensing mechanism, namely, variations in the refractive index of a liquid analyte filling the fiber core modify the resonant guidance of the fiber, thus leading to both intensity changes and spectral shifts in the fiber transmission. Both theoretical simulations and experimental characterizations are carried out to verify this resonant sensing mechanism of the proposed Bragg fiber refractometer. Moreover, we present a comprehensive study of the factors that affect the performance of Bragg fiber refractometers. These factors include sensitivity, dynamic range, insertion/coupling loss, response time and dependence of the refractometer sensitivity on the fiber length. We experimentally demonstrate that sensitivity of the Bragg fiber refractometers is very high, and is ~1400 nm/refractive index unit (RIU) which is comparable to that of the microstructured-fiber-based refractometers and surface-plasmon-resonance-based refractometers. We also note that such a sensitivity is equivalent to a refractometer resolution of ~7×10⁻⁵ RIU,
of a high-end grating spectrometer). At the same time, filling time (response time) of the refractometers developed in our labs is much shorter than that of the microstructured-fiber-based refractometers, as the size of the Bragg fiber hollow core is ~100 times larger than the size of holes in the microstructured fiber. We also note that the sensitivity of a Bragg fiber refractometer is virtually independent on the length of the Bragg fiber; therefore, a sensitive and highly compact system can be realized using a several-centimeter-long fiber section or a fiber coil. Moreover, this Bragg fiber refractometer is also advantageous due to the ease of fabrication and the possibility of mass production, since the Bragg fibers used in refractometers can be obtained using a single-step fiber-drawing process, where additional post-processing modifications, such as chemical etching or mechanical polishing, are not required. Other advantages of the Bragg fiber refractometers include small volume of liquid analyte, low cost, short response time (~1 s for the 40 cm long Bragg fiber), and simplicity of the sensing mechanism.
Another aspect of this thesis deals with design of the all-fiber systems where all the subcomponents of the refractometer system are fiber-based. In particular, spectroscopic instruments play a key role in many fiber-based refractometer systems operating using a spectral-based detection modality. Conventional spectrometers employ delicate dispersive elements such as movable gratings or prisms, which increase the cost of the devices and require relatively long time for spectral acquisition. Besides, resolution of these spectrometers is normally proportional to the optical path length inside a spectrometer, which makes such devices difficult to miniaturize or to integrate into a portable system. Thus, development of the compact, low-cost spectrometer modules that can be easily integrated with fiber-based transduction modules constitutes an active area of optical sensor research.
In this thesis we demonstrate a Bragg fiber bundle spectrometer that can be naturally integrated with the hollow-core Bragg fiber refractometer, thus resulting in an all-fiber sensor system that does not use a traditional grating-based spectrometer. Particularly, we use ~100 of solid-core Bragg fibers with complementary and partially overlapping bandgaps to fabricate a spectrometric fiber bundle. We then train the system using a tunable narrowband reference source (monochromator-based source). In this calibration measurement, the incident light from the reference source is filtered by the individual fibers in the bundle, and the image of the output facet of a fiber bundle is recorded using a monochrome CCD camera. As a result, a transmission matrix of the spectrometer system is constructed. This transmission matrix is then used together
with a Singular Value Decomposition algorithm in order to reconstruct the spectra of the unknown sources by interpreting the CCD images of the fiber bundle output facet. When applying this methodology to the relatively narrow test spectra (produced by various commercial filters), we find that the center peak of a test spectrum can always be reconstructed within several percents of its true value regardless of its position and width. We also find that although the widths of the individual Bragg fiber bandgaps are quite large (60-180 nm), the Bragg fiber bundle spectrometer has a resolution of 20-30 nm, as a large number of such fibers with partially overlapping bandgaps are used in a spectrometric bundle. Also, effect of the experimental noise on the quality of spectral reconstruction is analyzed, and several approaches are proposed in order to minimize the influence of noise. Overall, we conclude that the demonstrated Bragg fiber bundle spectrometer represents an economic all-fiber implementation of the spectrometer device that can be naturally integrated with other fiber-based transducers. The all-fiber spectrometer is cheap as it is based on plastic fiber technology, allows fast operation because of the lack of moving parts, and it can allow efficient and simple butt-coupling with other fiber-based devices.
Finally, we integrate the hollow-core Bragg fiber transducer with the solid-core Bragg fiber based spectroscopic fiber bundle, and demonstrate a complete and highly sensitive all-fiber refractometer for operation of liquid analytes. We believe that the main impact of our work is in the area of instrumentation of highly integrated optical fiber-based sensors. Thus, for the first time, to our knowledge, we have demonstrated a modular, all-fiber sensor architecture where all the elements of a complete sensor system are based on optical fibers. We envision that in the near future, one would be able to assemble a complete all-fiber sensor system by simply splicing various off-the-shelf on-demand fiber modules such as the light delivery fiber, the fiber refractometer, and the fiber-based spectrometer, which is a very intriguing proposition.
TABLE OF CONTENTS
DEDICATION ... III ACKNOWLEDGEMENT ... IV RÉSUMÉ ... V ABSTRACT ...VIII TABLE OF CONTENTS... XI LIST OF TABLES ... XV LIST OF FIGURES ... XVI LIST OF APPENDICES ... XXI LIST OF SYMBOLS AND ABBREVIATIONS ... XXIIINTRODUCTION ... 1
CHAPTER 1 LITERATURE REVIEW ... 7
1.1 Review of non-fiber-based refractometers ... 7
1.1.1 Refractometers based on critical angle method ... 7
1.1.2 Refractometers based on deflection method ... 9
1.1.3 Interferometric refractometers ... 10
1.1.4 Surface plasmon resonance-based refractometers ... 12
1.1.5 Photonic crystal refractometers... 13
1.1.6 Optical ring resontor-based refractometers ... 14
1.2 Review of fiber-based refractometers ... 16
1.2.1 Fiber refractometers based on the reflectivity measurements at the fiber/analyte interface ... 16
1.2.2 Fiber refractometers based on evanescent-field detection ... 17
1.2.4 Fiber grating refractometers ... 21
1.2.5 Fiber refractometers based on interferometric techniques ... 23
1.2.6 Capillary fiber refractometers ... 26
1.3 Microstructured optical fiber refractometers ... 27
1.4 Review of optical spectrometers ... 31
1.4.1 Spectrometers based on prisms ... 31
1.4.2 Spectrometers based on gratings ... 32
1.4.3 Fourier transform spectrometers ... 34
1.4.4 Optical fiber spectrometers ... 35
CHAPTER 2 METHODOLOGY ... 38
CHAPTER.3 ARTICLE 1: LIQUID-CORE LOW-REFRACTIVE-INDEX-CONTRAST BRAGG FIBER SENSOR ... 42
3.1 Introduction ... 42
3.2 Principle of operation of liquid-core Bragg fiber sensor... 42
3.3 Theoretical and experimental characterization of the Bragg fiber sensor ... 46
3. 4 Discussion of factors influencing sensor performance ... 48
3.4.1 Dynamic range of the sensor ... 48
3.4.2 Insertion and coupling loss ... 49
3.4.3 Dependence of sensitivity on fiber length ... 49
3.5 Bragg fiber sensor operating in the surface sensing modality ... 51
3.6 Conclusions ... 53
CHAPTER 4 ARTICLE 2: PHOTONIC BANDGAP FIBER BUNDLE SPECTROMETER54 4.1 Introduction ... 54
4.2 Characteristics of the subcomponents: solid-core Bragg fibers, fiber bundle and a CCD camera ... 54
4.2.1 Solid-core photonic bandgap Bragg fibers ... 54
4.2.2 Photonic bandgap Bragg fiber bundle ... 56
4.2.3 Sensitivity and linear response of a CCD camera ... 58
4.3 Calibration of the fiber bundle spectrometer and spectrum reconstruction algorithm .. 60
4.3.1 Transmission matrix method ... 60
4.3.2 Calibration measurement, building a transmission matrix ... 61
4.3.3 Spectral reconstruction algorithm ... 62
4.4 Spectral reconstruction experiments ... 63
4.5 Spectral resolution limit for the Bragg fiber bundle spectrometer ... 65
4.6 Novel technique for drawing PBG fiber bundles... 70
4.7 Conclusions ... 71
CHAPTER 5 ARTICLE 3: ALL PHOTONIC BANDGAP FIBER SPECTROSCOPIC SYSTEM FOR DETECTION OF REFRACTIVE INDEX CHANGES IN AQUEOUS ANALYTES……. ... 72
5.1 Introduction ... 72
5.1 Integration of the liquid-core Bragg fiber refractometer and the solid-core Bragg fiber bundle spectrometer ... 72
5.1.1 Calibration measurement of the all-Bragg-fiber refractometer system ... 72
5.1.2 Experimental characterization of the all-Bragg-fiber refractometer system ... 73
5.3 Conclusions ... 75
CHAPTER 6 GENERAL DISCUSSION, CONCLUSIONS AND PERSPECTIVES ... 76
6.1 Liquid-core Bragg fiber refractometer ... 76
6.1.1 Response time of the liquid-core Bragg-fiber refractometer ... 76
6.1.2 Bulk sensing modality and surface sensing modality ... 77
6.1.4 Spectral shifts of low-order modes and high-order modes ... 78
6.1.5 Temperature stability of the Bragg fiber refractometer... 79
6.1.6 Influence of analyte absorption to the spectral-based detection strategy ... 80
6.1.7 Spectral-based detection strategy and amplitude-based detection strategy ... 81
6.1.8 Potential applications of the Bragg fiber refractometer ... 82
6.2 Solid-core Bragg fiber bundle spectrometer ... 83
6.2.1 All-fiber Bragg fiber spectrometer system ... 83
6.2.2 Throughput of the Bragg fiber bundle ... 84
6.2.3 Analysis of the experimental noises in the fiber spectrometer system ... 84
6.2.4 SVD method for spectral reconstruction ... 86
6.2.5 Potential applications of the Bragg fiber bundle spectrometer ... 86
REFERENCES ... 88
APPENDIX ... 108
LIST OF TABLES
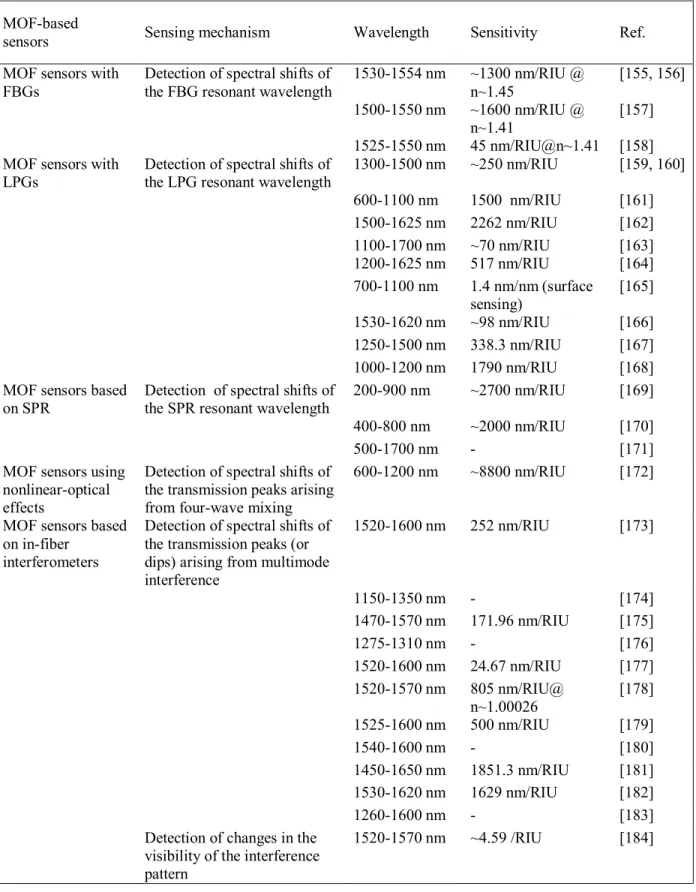
Table 1. 1 Refractometers based on MOFs using gratings, SPR effects, interferometric techniques and fiber non-linear effects. ... 30
LIST OF FIGURES
Figure 1.1 Schematic of the operating principle of a refractometer. ... 1
Figure 1.2 Schematic of an Abbe refractometer [34] ... 8
Figure 1.3 Schematic of a Pulfrich refractometer [34] ... 9
Figure 1.4 Schematic of a V-block refractometer [34] ... 10
Figure 1. 5 Schematic of the Michelson interferometer-based refractometer (Fig.1 from Ref. [54])…… ... 11
Figure 1.6 Schematic of a SPR refractometer using the Kretschmann-Reather configuration12 Figure 1.7 Schematic of the fiber refractometer based on the measurement of the Fresnel reflectivity at the fiber/analyte interface (Fig.1 from Ref. [88]). ... 16
Figure 1.8 Schematic of the fiber refractometer based on evanescent-field detection (Fig.2 from Ref. [8])... 18
Figure 1.9 Schematic of the fiber-based SPR sensor (Fig.9 from Ref. [96]). ... 19
Figure 1.10 Schematic of fiber refractometers using (a) the extrinsic F-P configuration and (b) the intrinsic F-P configuration (Fig. 1 from Ref. [130]) ... 24
Figure 1.11 Schematic of the liquid-core optical-ring-resonator sensor (Fig. 1 from Ref. [140])……. ... 26
Figure 1.12 Various types of MOFs. (a) Solid-core MOF featuring a solid core surrounded by a periodic array of air holes. (b) Hollow-core MOF featuring a hollow core surrounded by several rings of small air holes. (c) Bragg fiber featuring a large hollow core surrounded by a periodic sequence of high and low refractive index layers. (Fig. 2 from Ref. [4]) ... 28
Figure 1.13 Schematic of a prism-based spectrometer [186]. ... 32
Figure 1.14 (a) Schematic of a diffraction grating, and (b) schematic of a grating-based spectrometer using the Czerny-Turner design [186]. ... 33
Figure 2.1 Experimental setup of the liquid-core Bragg fiber refractometer demonstrated in this thesis……….………...………...… 40 Figure 3.1 (a) Setup of the Bragg fiber sensor system. An ~80 cm long liquid-core Bragg
fiber, coiled into a ~15 cm diameter circle, is integrated into a setup using two opto-fluidic coupling blocks. The beam from a supercontinuum source is coupled into the liquid-core Bragg fiber, and the transmission spectrum of a liquid-core Bragg fiber is then analyzed using a grating monochromator. (b) Cross section of a hollow-core Bragg fiber; the inset is the graph of the Bragg reflector taken by a scanning electron microscope (SEM). (c) Inner structure of the opto-fluidic block. A tip of a liquid-core Bragg fiber is sealed into the horizontal channel of the coupling block filled with the liquid analyte. The extremity of the horizontal channel is sealed by a glass window through which light is coupled into (or out of) the sensing system. In each coupling block there is also a vertical channel that connects to the horizontal channel to constitute the fluidic path for fluidic coupling of the Bragg fiber. The colorful appearance of the Bragg fiber is due to reflection of ambient light from the Bragg reflector. ... 43 Figure 3.2 Band diagram of (a) the TE and (b) the TM polarized modes of a PMMA/PS
Bragg reflector. The grey regions correspond to (β, ω) for which light can propagate within the Bragg reflector. The clear regions correspond to the parts of the phase space where light is unable to propagate in the Bragg reflector. Thick black curves represent the light line of distilled water. Transmission bands (green) of the Bragg fiber can be estimated from the intersection of light line of water with the Bragg reflector bandgaps. ... 44 Figure 3.3 (a) Simulated loss of the fundamental mode (HE11 mode) of the Bragg fiber filled
with different NaCl solutions. (b) Experimental transmission spectra of a ~40 cm long Bragg fiber filled with NaCl solutions (solid curves). The dotted curves indicate a repeat of the first experiment after several hours, which demonstrate a good repeatability of the measurement. The weight concentrations (wt%) and corresponding refractive indices of the NaCl solutions are listed in both figures as insets. ... 46 Figure 3.4 Spectral shifts of the fiber transmission peak obtained from the TMM simulation
Figure 3.5 Transmission spectra of the liquid-core Bragg fiber with different lengths: (a) 50 cm; (b) 30 cm; (c) 20 cm. The refractive indices of the analytes filling the fiber core are listed in as inset of (c). The white arrows in (a) and (b) mark the resonant peak positions, which we use to measure the spectral shifts. A linear dependence of the spectral shifts on changes in the refractive index of the fiber core is shown in (d). The black solid line represents the spectral shifts of a 50 cm long Bragg fiber and the red dashed line represents the spectral shifts of a 30 cm long Bragg fiber. ... 50 Figure 3.6 (a) Top: appearance of the Bragg fiber coated with a sucrose layer; Bottom:
appearance of the Bragg fiber with the coated layer dissolved in the liquid core. (b) Time- dependent spectral changes in the fiber transmission during the dissolution of the thin sucrose layer coated on the inner surface of the fiber core. At t=0, the fiber core is dry; the sucrose layer is 3.8 µm thick. Then, distilled water is quickly introduced. In the first 20 minutes, rapid changes in the transmission intensity and peak position are detected. After several hours, the reference is measured by purging the fiber with distilled water. ... 51 Figure 4.1 (a) Transmission spectra of 5 typical Bragg fibers used in the fiber bundle. (b)
Distribution of the fiber transmission bandwidth as a function of the fiber bandgap center wavelength for all the Bragg fibers in a bundle. In the inset: photo of a Bragg fiber cross section showing a solid core surrounded by a periodic multilayer reflector. ... 55 Figure 4.2 Fiber bundle spectrometer. Top part: schematic of the spectrometer. Light from
the illuminant is launched into the fiber bundle; the image is taken by the monochrome CCD. Lower part: when the broadband light is launched into the fiber bundle, the output is a mosaic of colors selected by the individual Bragg fibers. ... 57 Figure 4.3 (a) Normalized spectral response of a CCD array. (b) A typical monochromatic
near-linear response of a CCD array (at λ=560 nm). ... 59 Figure 4.4 Setup for the spectrometer calibration measurement. ... 62 Figure 4.5 Spectra reconstruction using photonic bandgap fiber bundle-based spectrometer.
The top part (a) shows the reconstructed spectra of six 25 nm wide peaks; the bottom part (b) shows the reconstructed spectra of four 40 nm wide bell-shaped spectra. The black dash
lines are the test spectra resolved by another monochromator; the red thick lines are the spectra reconstructed by the fiber bundle spectrometer. The gray area indicates error level.64 Figure 4.6 Properties of the reconstructed spectra as a function of the number of singular
values used in the inversion algorithm. No noise is present in the system. (a) Dependence of the spectral shape of a reconstructed peak on Nσ. (b) Width of a reconstructed peak as a
function of Nσ. (c) Reconstruction error as a function of Nσ ... 65 Figure 4.7 Effect of noise on the quality of reconstruction. Examples of the reconstructed
spectra for several particular realizations of noise with amplitudes: (i) δ =0, (ii) δ =0.005, (iii) δ =0.05, (iv) δ =0.1. ... 68 Figure 4.8 Effect of noise on the reconstruction algorithm. (a) Average reconstruction error
and its statistical deviation as a function of the noise amplitude. Inset: optimal number of singular values needed to minimize the reconstruction error. (b) Average width of a reconstructed peak and its statistical deviation as a function of the noise level. ... 69 Figure 4.9 Cross sections of the PBG fiber bundles fabricated using the two-stage drawing
technique. The bundle is illuminated with a broadband halogen lamp. At the output of fiber bundle, a mosaic of colors is visible as the white light is filtered by each fiber insider the bundle…… ... 70 Figure 5.1 Transmission spectra of a ~40 cm long liquid-core Bragg fiber measured by (a) the
Bragg fiber bundle spectrometer and (b) a conventional grating monochromator. The concentrations and corresponding refractive indices of the NaCl solutions are listed as the inset. (c) Spectral shifts of the transmission peak measured by the grating monochromator (dashed red line) and by the Bragg fiber bundle spectrometer (solid black line)... 74 Figure 6. 1 (a) Simulated loss spectra of the HE1, 48 mode of the Bragg fiber filled with
different NaCl solutions. (b) Spectral shifts of the fiber transmission peak obtained from the TMM simulation (HE11 and HE1, 48 mode) and the experimental measurements. (The shifts
of the HE11-mode spectra and the experimental spectra are calculated in Section 3.3). ... 78
Figure 6. 2 (a) Simulated tranmission spectra of a solid-core Bragg fiber 25 ℃ and 70 ℃. (b) Spectral position of the bandgap center at various operation temperatures [209]. ... 80
Figure 6. 3 Converting spectral shifts in the bandgap position into intensity variations in the fiber transmission spectrum [205] ... 81 Figure 6. 4 Machine vision system for (a) color recognition [211] and (b) detection of “under-filled” bottles in a beverage production line [212]. ... 87
LIST OF APPENDICES
LIST OF SYMBOLS AND ABBREVIATIONS
α Absorption loss coefficientβ Mode propagation constant c Speed of light in vacuum
dh Thickness of the high-index layer in a Bragg reflector dl Thickness of the low-index layer in a Bragg reflector ε Dielectric constant
λ Wavelength of light
L Fiber length
n Refractive index of a material nanalyte Refractive index of an analyte
nc Refractive index of the core of the Bragg fiber
nl Refractive index of the high-index layer in the Bragg reflector nh Refractive index of the low-index layer in the Bragg reflector neff effective refractive index of a guided mode
P Power of light
Pin Power coupled into a fiber Pout Fiber output power
S Sensitivity of sensor v Frequency of light
ω Angular frequency of light CCD Charge coupled device C-T Czerny-Turner
FWHM Full width at half maximum F-P Fabry-Perot
FBG Fiber Bragg grating
LCORRS Liquid-core optical ring resonator sensor LPG Long period grating
MOF Microstructured optical fiber PCF Photonic crystal fiber
PBG Photonic bandgap
PMMA Polymethyl methacrylate
PS Polystyrene
RIU Refractive index unit R&D Research and development SEM Scanning electron microscope SPR Surface plasmon resonance SPW Surface plasmonic wave SVD Singular value decomposition TIR Total internal reflection TMM Transfer matrix method WGM Whispering gallery mode
INTRODUCTION
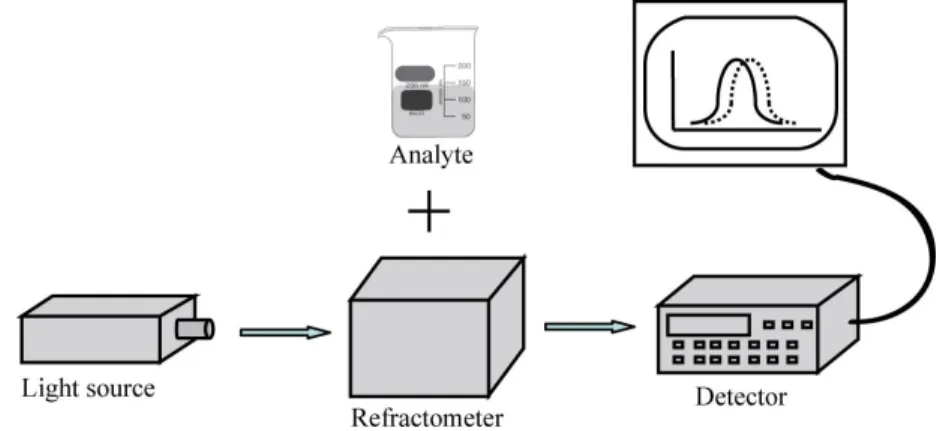
A refractometer is an optical sensor used for measuring changes in the refractive index of an analyte. As illustrated in Fig.1.1, after an analyte is added to a refractometer, the optical signal coming out of the refractometer is monitored over time. Changes in the analyte refractive index are typically inferred from changes in the refractometer optical transmission, which is interrogated by various optical detectors such as photodiodes or spectral analyzers.
Figure 1.1 Schematic of the operating principle of a refractometer.
The history of refractometers can be traced back to the nineteenth century, when Ernst Abbe developed the first laboratory refractometer that was commercialized by Carl Zeiss AG several years later [1]. Ever since then, refractometry has gradually become the main technique used in the chemical analysis to determine concentrations of solutions, and as a valuable tool in the identification of unknown substances. During the last 100 years, a tremendous effort has been made to develop various types of refractometers with better resolutions and smaller footprints. The techniques and materials involved in the prior research include critical angle method, deflection method, Surface plasmon resonance (SPR) method, optical interferometry (e.g. Michelson interferometric refractometers), fiber optics, and photonic crystals. These techniques along with their advantages and limitations are briefly reviewed in Chapter 1. Nowadays, refractometry is a well-accepted technique that is widely used in many scientific and industrial applications such as bio- and chemical sensing, food production, medical examination, jewelry gradation, pharmaceutical and cosmetic analysis [2], to name a few.
Among all the refractometric devices, fiber-optic refractometers have received a considerable attention due to their unique advantages such as low signal attenuation, light weight,
immunity to electromagnetic interference, resistance to harsh environments (e.g. for the mining and aerospace industries), electrical passivity, and possibility of multiplexing [2, 3]. In general, fiber-based refractometers can be categorized into two classes according to the different detection strategies, namely, amplitude-based detection strategy and spectral-based detection strategy [4]. Each class has its own advantages and limitations. In the amplitude-based detection strategy, one operates at a fixed wavelength and records changes in the amplitude of a signal, which are then re-interpreted in terms of changes in the analyte refractive index. Among the principal advantages of the refractometers operating on this strategy are low cost, ease of fabrication, and simple signal acquisition and processing, since no spectral manipulations are required. The commercial Fiber-optic Endface Refractometer from FORC-PHOTONICS [5] is a typical example of the fiber refractometer using the amplitude-based detection strategy. Unfortunately, the resolution of such refractometers is typically limited to a modest 10-3 – 10-4 refractive index unit (RIU). Generally
speaking, such a resolution could meet the requirements for regular scientific and industrial applications such as detection of sugar concentrations in food or beverage. However, a higher resolution of 10-5 - 10-7 RIU may be required for some demanding bio-sensing applications, e.g.,
detection of the quantity of bacteria in bio-solutions or detection of bio-binding events. Besides, we note that most of the amplitude-based fiber refractometers operate using interaction of the analyte with the evanescent field of the fiber core modes. Thus, in order to increase the sensitivity, certain fiber modifications have to be carried out to ensure an efficient overlap between the analyte and the evanescent field of the fiber core modes. These modifications may include stripping off the fiber cladding by chemical etching or mechanical polishing [6-8], tapering fibers into microfibers [9-11], or functionalizing fibers with high-index films [12]. In practice, these laborious modifications of the fiber structure not only weaken the mechanical strength of the fiber sensor, but also limit its effective sensing length.
An alternative detection strategy is spectral-based. This sensing modality is particularly effective in the resonant sensing configuration that features sharp transmission or absorption peaks in the fiber transmission or reflection spectra. Perturbations of the refractive index of an analyte placed in the spatial proximity of a certain resonant structure (e.g. fiber Bragg gratings [13-15], or fiber in-line interferometers [16-21], etc.) would modify the structure resonant properties, thus leading to spectral shifts of the resonant peaks in the fiber spectra. There are several advantages offered by the spectral-detection based fiber refractometers. Firstly, resonant
lines that are used to monitor changes in the analyte refractive index can be made very narrow via proper design of the sensor resonator structure, thus resulting in a very high sensor resolution. Secondly, resonant sensors can be analyte specific when operating in the vicinity of the characteristic absorption lines of the analyte. Lastly, such sensors are, generally, less influenced by fluctuations in the intensity of the light sources used for optical interrogation, thus improving the accuracy of refractive index measurements. The resolution of spectral-detection based refractometers can be as small as 10-4-10-7 RIU. On the negative side, the fabrication of the
in-fiber resonant structures is typically a demanding and time-consuming task that can require significant investments in fiber-processing equipments. The cost of fabrication and complexity of the fabrication process are the two major barriers for mass-production of resonant fiber sensors. In this respect, the Microstructured Optical Fibers (MOFs) and photonic bandgap fibers (a subset of MOFs) may constitute a feasible solution for the development of the spectral detection-based fiber refractometers.
Compared to regular step-index fibers, MOFs offer several major advantages [4]: (1) a MOF always comprises some kind of a micro-sized resonant structure that runs along the entire length of the fiber, so that additional fiber processing (e.g. inscription of fiber gratings) is generally not required; (2) MOFs by their nature can accommodate liquid or gaseous analytes within their hollow microstructure; (3) hollow-core MOFs could achieve an almost-complete modal overlap with test analytes, thus leading to a high sensitivity for refractive index measurements. These attractive advantages potentially make MOFs promising for the development of the new generation of fiber refractometers. The main disadvantage of the MOF-based refractometers is that the infiltration of test analytes into the MOF microstructure takes a relatively long time (e.g., ~10 mins for a 20 cm long fiber as reported in [22, 23]) due to the small diameter of the micro-sized channels. Therefore, shortening of the MOF-based refractometer response time constitutes one of the major research directions for this type of sensor.
Finally, we note that spectroscopic devices play a key role in spectral-detection based refractometers. Traditional spectrometers normally employ moving dispersive elements such as high quality Bragg gratings, which leads to high system costs and slow acquisition speeds. Moreover, the resolution of such spectrometers is limited by the length of the spectrometer optical path, which, in turn, makes traditional spectrometers difficult to miniaturize without the loss of resolution. The Majority of fiber-optical sensors that use spectroscopic devices for
detection are limited to laboratory applications due to high costs and the relatively large size of such systems. Therefore, one of the essential driving forces behind the R&D of spectroscopic instruments is the development of the compact, rapid and cost-effective spectrometers that can be conveniently integrated into optic sensing devices. In this respect, we believe that the fiber-based spectrometers detailed in this thesis may constitute a feasible solution. Existing spectrometers mainly use optical fibers to transfer optical signals from the optical probe to the dispersive element (e.g. gratings) [24, 25]. However, some special fibers (for instance, photonic bandgap fibers or fibers with gratings) can provide the dispersive function, which potentially makes such fibers capable of realizing the function of a spectrometer [26-28]. It was demonstrated recently that the function of a spectrometer can even be implemented within a regular multimode fiber by interrogating the speckle patterns in the fiber output image [29]. These realizations have inspired us to look for an all-fiber spectrometer that can be easily integrated with fiber-based transducers and that can offer fast acquisition speeds, small footprint and high resolution.
The objective of this thesis is to propose and experimentally demonstrate a compact, rapid, highly sensitive, all-fiber refractometric system operating on the spectral-based detection strategy. Particularly, the work in this thesis can be sub-divided into three parts:
1). We propose and experimentally demonstrate a novel, highly sensitive liquid-core Bragg fiber refractometer for the detection of small changes in the refractive index of liquid analytes. This refractometer uses a single piece of the hollow-core photonic bandgap Bragg fiber to host and probe liquid analytes. The fiber is drawn using a simple single-step fiber drawing process, which is beneficial for mass production of the cost-effective fiber transducers. Spectral shifts in the fiber transmission spectrum induced by the variations in the refractive index of a liquid analyte filling the fiber core are detected and interpreted using a combination of experimental and simulation techniques. Compared to other MOF-based refractometers, the response time of the hollow-core Bragg fiber refractometer is significantly reduced due to the large fiber core size.
2). We propose and experimentally demonstrate a fiber-based spectrometer that consists of a solid-core Bragg fiber bundle and a monochromatic CCD camera. This fiber spectrometer potentially can be used to replace traditional spectrometers based on moving gratings,
thus leading to a significant cost saving, increased sensing speed, and a simple all-fiber design.
3). Finally, we integrate the hollow-core Bragg fiber transducer together with the fiber bundle-based spectrometer and demonstrate a complete all-fiber refractometric system for operation with liquid analytes.
The rest of this thesis is organized as follows: in Chapter 1.1 we provide an up-to-date review of the scientific literature that describes various types of refractometers. The advantages and limitations of each technique are briefly introduced. In Chapter 1.2 we review the common spectrometer types which are routinely used in optical sensing. In particular, we focus on the fiber-based spectrometers that are very promising in the design of miniaturized and highly integrated all-fiber sensor systems. Chapter 2 introduces two popular sensing modalities used by fiber optic refractometers, which are the amplitude-based detection modality and the spectral-based detection modality. We note that due to the resonant guiding properties of the Bragg fiber, the spectral-based detection modality is more suitable for fiber refractometers based on photonic bandgap Bragg fibers. In Chapter 3, we propose and experimentally demonstrate a hollow-core Bragg fiber-based refractometer for sensing small changes in the refractive index of a liquid analyte filling the fiber core. We detail the resonant sensing modality of the refractometer, and then carry out both theoretical simulations and experiments to explain the sensor performance. Furthermore, we conduct a thorough analysis of the factors that affect the performance of the Bragg fiber refractometer (e.g. sensitivity, detection limit, response time, etc). In Chapter 4, we propose and experimentally demonstrate a photonic bandgap fiber bundle spectrometer that consists of ~100 solid-core Bragg fibers and a monochrome CCD camera. The operating principle of the proposed Bragg fiber bundle spectrometer is based on the “transmission matrix algorithm” which allows reconstruction of the unknown spectrum from the image of the transmitted intensities of the individual Bragg fibers in the fiber bundle. Here, we also present a detailed study of the resolution of the fiber bundle spectrometer and propose several methods to improve its resolution. Chapter 5 demonstrates a complete all-fiber spectroscopic system that integrates the hollow-core Bragg fiber refractometer and the Bragg fiber bundle spectrometer. We conduct an extensive optical characterization of the system, and demonstrate that the sensitivity of the all-fiber system is identical to the sensitivity of a system that uses a traditional grating-based spectrometer. Finally, in Chapter 6, we summarize the distinctive features of the fiber
sensors and all-fiber sensing systems demonstrated in this thesis, discuss their potential applications, and suggest future research directions that would improve the performance of these sensing devices.
CHAPTER 1
LITERATURE REVIEW
In Chapter 1, we first review previous work related to the development of the various refractometer types. Both non-fiber-based (Section 1.1) and fiber-based (Section 1.2) refractometers are reviewed with their advantages and limitations briefly summarized. We then focus in particular on the Microstructured Optical Fiber (MOF) -based refractometers (Section 1.3). We conclude that when compared to the conventional step-index fibers, MOFs offer many advantages for sensing of the refractive index of liquid or gaseous analytes. In Section 1.4, we review several types of spectrometers currently used in the optical sensor systems. These spectrometers include grating spectrometers, prism spectrometers, Fourier transform spectrometers as well as fiber-based spectrometers. We note that fiber-based spectrometers potentially can be fabricated into the simple, compact spectroscopic modules that could be conveniently integrated with fiber optic transducers to realize all-fiber sensor devices.
1.1 Review of non-fiber-based refractometers
1.1.1 Refractometers based on critical angle method
In 1869, Ernst Abbe proposed the first refractometer based on the critical angle effect [1]. His original design was so successful that even today it is still used in many devices [30-32]. In the Abbe refractometer shown in Fig.1.2, an analyte is sandwiched between two prisms – a measuring prism and an illuminating prism. Light enters the analyte from the illuminating prism. The top surface of the illuminating prism is ground, so that the light enters the analyte at all possible angles including those almost parallel to the measuring prism surface. The refractive index of the measuring prism is generally higher than those of test analytes. Thus, the incident light with a grazing angle to the measuring prism would be diffracted at the critical angle at the bottom surface of the measuring prism. Then a telescope is used to measure the position of the bright/dark boundary defined by the critical angle effect. According to Snell’s law, if the refractive index of the measuring prism is known, the critical angle and thus the bright/dark boundary position is simply determined by the refractive index of the liquid analyte. Therefore, knowing the boundary position and the refractive index of the measuring prism, one is able to calculate the refractive index of the sample. To prevent chromatic dispersion, two compensating Amici prisms are added inside the telescopic system; otherwise one would see in the eyepiece the
blurred red and blue boundaries rather than the well-defined sharp edges. In the later versions of Abbe refractometers, a temperature-stabilizing system is included in order to minimize errors caused by surrounding thermal fluctuations. In 1997, J. Rheims et al. proposed a method to expand the application of Abbe refractometers into the ultraviolet (UV) and infrared (IR) spectral ranges [30]. Note that the accuracy of an Abbe refractometer is affected by the optical absorption of the samples as well as the contact quality between the sample and the prisms. The resolution of the modern Abbe refractometers can achieve 1×10⁻⁴ RIU [32]. Various handheld refractometers
and immersion refractometers [33, 34] can be considered as variants of the original Abbe refractometer design.
Figure 1.2 Schematic of an Abbe refractometer [34]
Another notable refractometer design based on the critical angle method is the Pulfrich refractometer proposed by Carl Pulfrich in 1888 [35]. As shown in Fig.1.3, a glass prism of high refractive index has two polished plane facets, which are perpendicular to one another. The sample is placed on the horizontal surface of the prism, and in the case of liquid analytes, the sample is contained in a glass cell glued to the prism. A beam of monochromatic light is directed almost horizontally through the substance so that it is incident onto the prism face at the grazing incidence angles. Due to the critical angle effect, the emergent beam will define, on the vertical surface of the prism, a sharp boundary that is observed with a telescope. Refractive index of an analyte can be calculated, if one knows the refractive index of the prism and the position of the boundary. Compared to the Abbe refractometers, Pulfrich refractometers can provide a superior
view of the boundary due to the grazing illumination, thus allowing a more precise reading of the refractive index. A resolution of 4×10⁻⁴ RIU was reported from the original design [35, 36]. E. Moreels et al. [37] used monochromatic laser to replace traditional light sources for illumination, which improved the resolution to 3×10⁻⁴ RIU. Currently, commercial Pulfrich refractometers with a resolution of 1×10⁻⁴ RIU are used in many applications [38]. Note that both the Abbe
refractometers and Pulfrich refractometers are bulky due to the use of telescopic and temperature-stabilizing systems. Moreover, the resolution of these traditional refractometers is relatively low when compared to that of the more advanced devices introduced in the following sections.
Figure 1.3 Schematic of a Pulfrich refractometer [34]
1.1.2 Refractometers based on deflection method
The deflection effect of light can also be used to implement a refractometer. The most famous design based on this method is the V-block refractometer (also called Hilger-Chance refractometer) that was proposed by J. V. Hughes in 1941 [39]. Fig.1.4 demonstrates the operating principle of a V-block refractometer. The light from an illuminant passes through a collimating slit, enters the liquid analyte in the V-block and gets refracted twice at the perpendicular cell walls. Finally, the position of the emergent light is interrogated by a telescopic system. The deflection angle of the light exiting the block is a function of the refractive index of the liquid analyte and the refractive index of the glass cell. In 1984, E. Moreels et al. [37] used a He-Ne laser in the V-block refractometer in order to reduce divergence of the beam passing through the system, and the experimental results suggested a detection error of ± 0.3% to the true
values. Besides, P. R. Cooper [40, 41] extended the application of a V-block refractometer to the near-infrared spectral range using a goniometer that adopted an infrared vidicon camera as the detector, and a resolution of ~2×10⁻⁴ RIU was obtained from the measurements of paraffin (liquid) and a silicon elastomer (solid). Nikolov et al. [42] used an experimental setup similar to that in Ref. [40] to measure refractive indices of the optical plastics (such as polymethyl methacrylate, polystyrene, etc), and obtained a resolution of 1×10⁻⁴ RIU. Deflection-method-based
refractometers can also be implemented by simply using a hollow prism or a hollow cube cell as the sample holder [43, 44]. The principal advantage of the deflection-method-based refractometers is the simplicity of their sensor structure and sensing mechanism; however, the resolution of such refractometers is always limited by the length of the optical path inside of the sample holder. Moreover, due to the geometry of the V-shaped sample holder, this refractometer is most suitable for operation with liquid analytes [43].
Figure 1.4 Schematic of a V-block refractometer [34]
1.1.3 Interferometric refractometers
Compared to the refractometers based on the critical angle method or deflection method, interferometric refractometers feature much higher sensitivities to changes in the analyte refractive index. In the past, many types of interferometers have been applied to the problem of measuring refractive index, including Michelson interferometers [45-54], Fabry-Perot (F-P) etalons [55-59], Mach-Zehnder (M-Z) interferometers [60, 61], etc. In this thesis, the Michelson interferometer, due to its popularity, is chosen as a typical example in order to demonstrate the general operating principles behind the interferometric refractometers.
The sensing mechanism of a Michelson interferometric refractometer is that the introduction of a test analyte into one arm of a Michelson interferometer would bring an additional phase difference between the two arms of the interferometer, thus leading to variations in the interference fringes. For instance, Kachiraju et al. [47] have demonstrated a modified Michelson interferometric refractometer, in which a liquid cell with variable length is inserted into one arm of the interferometric setup. When the optical path length of the liquid cell changes, the phase difference between the two arms is modified, thus leading to shifts of the interference fringes in the output of this Michelson interferometer. As the mechanical length of the liquid cell can be precisely controlled by a micro-positioning stage, the number of the shifted interference fringes is simply determined by the refractive index of a liquid analyte filling the liquid cell. Correspondingly, the refractive index of the test analyte can be calculated by counting the number of shifted fringes during a scan of the length of the liquid cell over a constant distance. An experimental resolution of 2×10⁻⁴ RIU was measured. Note that in this configuration the
detection limit of the refractometer depends on the accuracy that one can achieve to control the length of the liquid cell. This creates a technical barrier to high-resolution sensing of refractive indices.
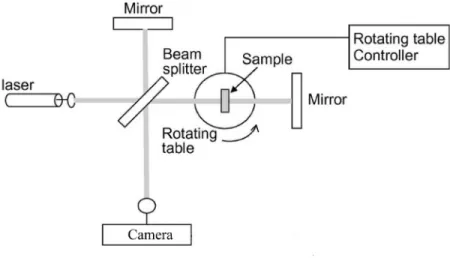
Figure 1. 5 Schematic of the Michelson interferometer-based refractometer (Fig.1 from Ref. [54]).
A method to circumvent this problem was theoretically proposed by C. A. Proctor [53]. As shown in Fig.1.5, a transparent solid sample in the form of a plate with parallel facets is rotated in one arm of the Michelson interferometer, which creates continuous changes in the
optical-path-length difference of the two arms and thus changes in the interference-fringe patterns. Variations in the fringe pattern are recorded by a CCD camera during a 2π rotation of the analyte. The thickness and the refractive index of the analyte can then be calculated independently using a numerical polynomial-fitting method [49, 52, 54]. In the 1960s, this method was experimentally implemented by M. S. Shumate [49] who demonstrated an experimental accuracy of 2×10⁻⁴ RIU
for the measurement of a 0.5 mm thick barium-titanate sample. More recently, this method has been used to measure refractive indices of various solid and liquid analytes [52, 54], and the resolution was improved to ~10-5 RIU [52]. Based on this method, detection accuracy of
Michelson interferometers is no longer limited by the accuracy of measurements of the sample thickness; however, we note the resolution of Michelson interferometric refractometers are still susceptible to the air flow in the experimental environment and mechanical vibrations of the components in the experimental setup. Note that this sample-rotation method is also applicable to refractometers based on F-P interferometers and M-Z interferometers as shown in Ref. [55, 57].
1.1.4 Surface plasmon resonance-based refractometers
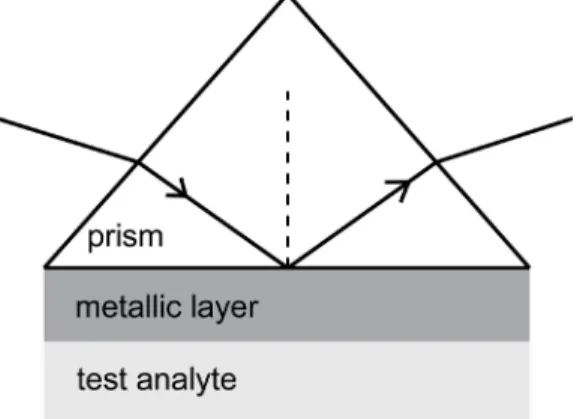
In the last twenty years, refractometers based on surface plasmon resonance (SPR) have been widely studied due to their dramatically high sensitivities [62]. It is well known that the collective oscillation of the free-charge carriers at a metal/dielectric interface yields a surface plasmon wave (SPW) propagating along the interface. The excitation of the SPW is extremely sensitive to changes in the refractive index of the dielectric adjacent to the metallic layer, which is the sensing mechanism for the operation of SPR refractometers. A typical example of a SPR refractometer using the Kretschmann-Reather (K-R) configuration is presented in Fig.1.6.
In the K-R configuration, a p-polarized beam passes through a glass prism and then gets reflected on the bottom facet of the prism coated with a thin metallic layer (e.g. Au or Ag layer). The presence of a prism allows phase matching of an incident light wave with a plasmonic wave at the metal/dielectric interface by properly choosing the light wavelength and the incident angle. Mathematically, the phase matching condition can be expressed as the equality between the plasmon wave-vector and the projection of the wave-vector of the incident light along the prism interface. Changes in the refractive index of an analyte adjacent to the metallic layer would modify the phase-matching condition, thus leading to variations in the amplitude and spectrum of the reflected beam, which constitutes the sensing principle of a SPR refractometer. The SPR setup can also be used as a bio-sensor to interrogate bio-layer binding events, since the resonant condition is highly sensitive to changes in the refractive index of the medium within 100-300 nm range of the interface [63]. Typical resolution of a SPR sensor is on the order of 10-5-10-7 RIU [64,
65]. Despite the outstanding sensitivity, SPR sensors are mostly used in laboratory environments due to the complexity of the interrogation system and relatively high cost of the SPR components required.
1.1.5 Photonic crystal refractometers
In the last decade, the study of photonic crystal sensors for bio- and chemical sensing has received considerable attention due to the development of many advanced micro- and nano- photonic fabrication techniques. Photonic crystals generally refer to structures in which the dielectric constant has a periodic variation in one, two or in all three orthogonal directions [66]. In such structures one observes formation of the so-called spectral photonic bandgaps (PBGs), which are the spectral regions where photons are unable to propagate in the bulk of the periodic structure. Many photonic crystals contain porous networks of voids permeable to gaseous or liquid analytes. Infiltration of photonic crystal voids with analytes would change the refractive index of these voids, thus modifying the PBG spectral signatures (e. g. resonant dips) in the photonic crystal transmission (or reflection) spectra. This is the principal transduction mechanism for photonic crystal sensors. The sensitivity of photonic crystal refractometers is generally defined as resonant-wavelength shift per refractive index unit. In order to increase the sensitivity, resonant structures such as microcavities [67-70], air slots [71-73], etc., can be introduced into a photonic crystal. In Ref. [67], a 2-D photonic crystal with a microcavity was demonstrated for
sensing of changes in the refractive index of liquid analytes, and the experimental results showed a sensitivity of 63 nm/RIU. C. Kang et al. [68] improved the sensitivity to ~100 nm/RIU by adding, to the microcavity, multiple holes with diameter much smaller than the lattice constant of the photonic crystal. Y. Liu et al. [69] further optimized the structure of the photonic crystal cavity (along with positions and diameters of the multiple holes inside the cavity), and they achieved a sensitivity of ~460 nm/RIU. Another type of the photonic crystal [71] widely used for refractive-index sensing is the one with an air slot engraved along the photonic crystal structures. The air slot is used as both optical waveguide and microfluidic channel, so that the light-matter overlap is greatly enhanced. A sensitivity of ~1500 nm/RIU was experimentally achieved with the air-slot photonic crystal refractometer demonstrated in [71], which is the highest sensitivity to date achieved with the photonic crystal refractometers. Assuming the detection limit of a spectral shift to be 0.1 nm, which is a typical resolution of the high-end optical spectrum analyzers, the sensitivity of ~1500 nm/RIU represents a sensor resolution of ~6×10⁻⁵ RIU. Among the
advantages of photonic crystal sensors are small footprint, capability of integration into lab-on-chip devices, high quality factor of the microcavities, high sensitivity for surface sensing applications, and small volume of analytes required for sensing. Therefore, photonic crystal-based refractometry is very promising technique towards the development of compact and sensitive lab-on-chip refractometers. However, the fabrication of photonic crystals normally requires high resolution photo-lithography (or electron-beam-lithography) which is an expensive process [66-76]. Moreover, mass production of the photonic crystal sensors (especially the ones with artificial defects) with high repeatability remains a great challenge [76].
1.1.6 Optical ring resontor-based refractometers
Refractometers based on optical ring resonators have been under intensive investigation in the last decade due to their advantages such as high resolution, capability of integration into lab-on-chip devices, high quality factor, and small volume of test analytes required for sensing [77, 78]. In an optical ring resonator-based refractometer, the light from a lead-in waveguide (also called bus waveguide) is coupled into the ring resonator. At the resonant wavelengths of the ring resonator, the so-called whispering gallery modes (WGMs) would be excited around the surface of the ring resonator. These WGMs will manifest themselves as spectral dips in the resonator transmission spectrum with the dip positions corresponding to the resonant wavelengths. The
resonant wavelength of a WGM can be calculated as λWGM =2πrn meff , where r is the ring outer radius, neff is the effective refractive index of the WGM, and m is an integer denoting the WGM order. Variations in the refractive index of test analytes surrounding the resonator would modify the effective refractive index of a WMG, thus leading to displacements of the corresponding spectral dip. Consequently, the changes in analyte index can be then inferred from spectral shifts of the resonant wavelength, which constitutes the sensing mechanism of such refractometers. We note that an important factor that affects the sensing properties of a ring resonator refractometer is its quality factor (Q factor), which is defined as the ratio of the wavelength of a resonant dip to its FWHM. In principle, the Q factor is inversely proportional to the detection limit of such a refractometer, since a higher Q factor would result in a narrower resonant dip and thus a more precise reading of spectral shifts. To date, optical ring resonator-based refractometers have been implemented in three major configurations [77, 78] which are (1) chip-based ring resonators including ring- and disk- shaped resonators [79-82], (2) stand-alone dielectric microspheres [84-87], and (3) capillary fiber opto-fluidic ring resonators. In this section, we focus on the first two types, while the third type will be reviewed in Section 1.2.6 regarding to fiber-based refractometers.
Chip-based resonators generally have the advantages such as possibility of mass production and ease of optoelectronic integration. However, they normally have a relatively low Q factor (typically 103-105 in water) due mainly to the resonator surface roughness [78]. C-Y Chao et al.
[79] used a polymer microring resonator of 45 µm in radius to measure refractive index changes of glucose solutions. The sensitivity was measured to be ~70 nm/RIU, and a detection limit of 5×10⁻⁵ RIU was achieved. Another glass-based ring resonator of 60 µm in radius was
demonstrated in Ref. [80]. A sensitivity of 140 nm/RIU was achieved, and the detection limit was estimated to be 1.8×10⁻⁵ RIU. Besides, E. Krioukov et al. [81] developed a microdisk resonator
on a SiO2-Si3N4 platform. The experimental sensitivity was found to be ~23 nm/RIU, and the
detection limit was 1×10⁻⁴ RIU. Recently, G-D Kim et al. [82] proposed that the sensitivity of a
microdisk resonator can be enhanced by coating a thin high-index overlay on top of the resonator. Experimentally, they showed that the sensitivity was improved from 117 nm/RIU to 294 nm/RIU by coating a 40 nm thick TiO2 (n~2.61) overlay on a ZPU13-430 polymer (n~1.43) microdisk.
process, which may involve photo-lithographic processes and multiple chemical etching treatments [79-82].
Microsphere resonators, in general, feature very high Q factors (>106) due to their geometry and the extremely low surface roughness [78, 83]. A microsphere with a diameter of tens to a few hundred micrometers can be fabricated by simply melting the end of an optical fiber by a CO2 laser or an acetylene/hydrogen-oxygen torch [78, 84, 85]. Using this method, N. M.
Hanumegowda et al. [84, 85] developed a microsphere resonator-based refractometer. Although only a moderate sensitivity of ~30 nm/RIU was obtained, the detection limit of the sensor was as small as 10-7 RIU owing to its high Q factor (~5×10⁶). The sensitivity of a microsphere
resonator-based sensor may also be improved by coating a high-index layer on the microsphere [86, 87]. For example, O. Gaathon et al. [87] experimentally showed that by coating a 340 nm thick polystyrene film on a fluorine-doped silica microsphere, the sensitivity was increased by more than 700%. Note that the integration of a microsphere resonator with other opto-fluidic devices could be challenging, and it may require a tricky design of the opto-fluidic system and accurate positioning of each sensor component.
1.2 Review of fiber-based refractometers
1.2.1 Fiber refractometers based on the reflectivity measurements at the
fiber/analyte interface
Figure 1.7 Schematic of the fiber refractometer based on the measurement of the Fresnel reflectivity at the fiber/analyte interface (Fig.1 from Ref. [88]).
Fiber refractometers based on the measurement of the Fresnel reflectivity at the fiber/analyte interface constitute the simplest type of the fiber-based refractometers. Such fiber refractometers are advantageous due to the ease of fabrication and the simplicity of the underlying sensing mechanism. Fig.1.7 shows a setup of the fiber refractometer based on the interrogation of the reflectivity at the fiber/analyte interface [88]. The fractional reflectivity, R, at the fiber/analyte interface can be calculated using the Fresnel formula: ( ) (2 )2
c a c a
R= n n− n n+ , where nc and na
represent the refractive indices of the fiber core and the test analyte, respectively. One can infer the changes in refractive index of the analyte by measuring the changes in the reflectivity at the fiber/analyte interface. Using this sensing principle, M. S. Meyer et al. [89] demonstrated that refractive index can be measured with an average accuracy within 0.2% of the true value, which corresponds to a refractive-index resolution of 0.003 RIU. This resolution was later improved to be on the order of ~1×10⁻⁴ RIU by using a parabolic-shaped fiber tip or a tapered fiber tip as the fiber probe [90]. P. Nath et al. modified this technique into a “non-intrusive” sensing regime by adding an objective lens between the fiber tip and the analyte, so that the fiber refractometer can be used with chemically aggressive analytes such as hydrofluoric acid [91]. Currently, fiber refractometers based on detection of the fiber/analyte reflectivity are used commercially and are known as Fiber-optic Endface Refractometers (for example, see a system from FORC-PHOTONICS [5]). Some disadvantages of these fiber refractometers include signal sensitivity to bending of the probe fiber, as well as signal sensitivity to the intensity fluctuations of the light source. Moreover, the resolution of these simple sensors is also relatively poor compared to more advanced fiber refractometers demonstrated in the following sections.
1.2.2 Fiber refractometers based on evanescent-field detection
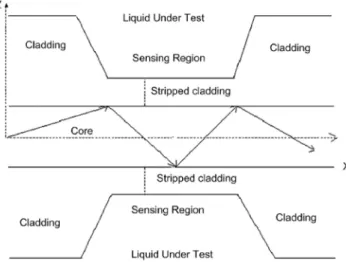
Fiber refractometers based on evanescent-field detection are another type of fiber refractometers that use the amplitude-based detection modality. As shown in Fig.1.8, in such sensors the cladding of the fiber is partially or completely removed by either mechanical polishing or chemical etching, so that the evanescent field of fiber core-guided modes would efficiently overlap with the analytes under test [6-8].
![Figure 1.2 Schematic of an Abbe refractometer [34]](https://thumb-eu.123doks.com/thumbv2/123doknet/2344962.34669/31.918.264.610.403.699/figure-schematic-an-abbe-refractometer.webp)
![Figure 1.3 Schematic of a Pulfrich refractometer [34] 1.1.2 Refractometers based on deflection method](https://thumb-eu.123doks.com/thumbv2/123doknet/2344962.34669/32.918.291.628.363.623/figure-schematic-pulfrich-refractometer-refractometers-based-deflection-method.webp)


![Figure 1.13 Schematic of a prism-based spectrometer [186].](https://thumb-eu.123doks.com/thumbv2/123doknet/2344962.34669/55.918.117.806.103.308/figure-schematic-prism-based-spectrometer.webp)