OATAO is an open access repository that collects the work of Toulouse
researchers and makes it freely available over the web where possible
Any correspondence concerning this service should be sent
to the repository administrator:
[email protected]
This is an author’s version published in:
http://oatao.univ-toulouse.fr/21771
To cite this version:
Noiville, Romain
and Jaubert, Olivier
and Gressier, Marie
and Bonino,
Jean-Pierre
and Taberna, Pierre-Louis
and Fori, Benoit and Menu, Marie-Joëlle
Ce(III) corrosion inhibitor release from silica and boehmite nanocontainers. (2018)
Masterials Science and Engineering : B, 229. 144-154. ISSN 0921-5107
Ce(III) corrosion inhibitor release from silica and boehmite nanocontainers
Romain Noiville
a, Olivier Jaubert
a, Marie Gressier
a, Jean-Pierre Bonino
a, Pierre-Louis Taberna
a,
Benoit Fori
b, Marie-Joëlle Menu
a,⁎aCIRIMAT, Université de Toulouse, CNRS, INPT, UPS, 118 Route de Narbonne, 31062 Toulouse Cedex 09, France bMécaprotec Industries, 34 Boulevard Joffrery, 31605 Muret Cedex, France
A R T I C L E I N F O
Keywords: Oxide nanoparticles Cerium Corrosion Electrochemical techniques Physisorption ReleaseA B S T R A C T
Electrochemical impedance spectroscopy clearly appeared as a suitable technique to investigate the releasing properties of cerium (III) loaded on silica and boehmite nanocontainers. In this way the electrochemical
be-havior of the AA2024-T3 was evaluated by electrochemical impedance spectroscopy in a 0.045 mol L−1NaCl
solution with nanocontainers containing the inhibitor. Results show that the inhibitor release is influenced by both the chemical nature and the morphology of the nanocontainers. The lower loading and release phenomena were observed for the mesoporous silica nanocontainers, whereas the inhibitor is liberated until 168 h from dense silica nanocontainers. Boehmite nanocontainers combine a good loading ratio with a longer release until the second week of immersion.
1. Introduction
The AA2024-T3 aluminum alloy is widely used in aircraft manu-facture because of its optimal weight to strength ratio, however this alloy is one of the most susceptible towards localized corrosion. For many decades, chromates conversion technology has been widely used for the corrosion protection of this alloy to very good effect [1,2]. Unfortunately, hexavalent chromium is extremely toxic, carcinogenic, and environmentally harmful, so this technology is now unsustainable. An interesting alternative route lies in the hybrid sol-gel coatings, which provide a good adhesion to the substrate and enhanced com-patibility with additional organic top coatings[3]. Organic-inorganic hybrid sol-gel coatings exhibit good barrier properties that hinder the progression of the aggressive species [4–6]. Moreover, self-healing properties can be brought to coating thanks to the addition of organic
[7,8] or inorganic[7–9] corrosion inhibitors. Among alternative in-hibitors, rare earth elements and more especially the cerium (III) cation provide an effective corrosion protection to the AA2024-T3[7,10–16]. It was reported that a cerium content in the coating ranging from 0.2 to 0.6 wt% is an optimum because higher concentrations lead to defects in the coating backbone[17,18]. Introduction in the hybrid coatings of corrosion inhibitors trapped in host containers allows minimizing this detrimental effect[19,20]. In this way, corrosion inhibitors can be re-leased to compensate coating defects like scratches by providing ex-cellent self-healing functionality. Nanosized inorganic oxides are very often introduced as nanocontainers in sol-gel based films, including
silica the morphology of which allows to form hollow spheres[21], mesoporous nanospheres[22,23]or nanotubes[24]. Zirconia and ti-tania dioxide hollow mesoporous nanospheres as other smart nano-containers for organic corrosion inhibitor are reported by Wang[25]
and Chenan[26] and by Balaskas[27]and Tang [28]respectively. Other containers are the Mg-Al and Zn-Al layered-double-hydroxides (LDH) [29–31] or nanoclays such as halloysite nanotubes [32–34], which can be loaded by anionic organic or vanadate inhibitors. Among the organic corrosion inhibitors, benzotriazole (BTA) [24,32,34,35], hydroxyquinoline (8-HQ) [27,34,36] and mercaptobenzothiazole (MBT)[23,26,29,33]are the most reported. Surprisingly few studies relate to inorganic inhibitors such as vanadate[30,31], molybdate[36]
and cerium nitrate[36,37,38]despite the well-known efficiency of the latter. Tavandashti and al [38] described the improvement of self-healing performances when cerium loaded boehmite nanocontainers are incorporated in sol-gel epoxy coatings.
Because nanocontainers embedded into coatings also act as fillers which improve the barrier property and in order to assess the inhibitor release property of the nanocontainers, the present work focuses on the study of the Ce(III) release in a corrosive solution. Most of the reported studies involve organic inhibitors whose release from nanocontainers is easily quantified by spectrophotometry [8,39]but few studies dealt with inorganic inhibitors such as lanthanide cations which require other methods such as ICP titration which involves multiple separation steps[40]. Moreover in the case of very small nanoparticles (under 20 nm), the separation of loaded nanoparticles remains a difficult task,
⁎Corresponding author at: CIRIMAT, Université de Toulouse, CNRS, INPT, UPS, 118 Route de Narbonne, 31062, France.
E-mail address:[email protected](M.-J. Menu).
(500 °C, 5 h) to remove the template, 0.3 g of the powder was dispersed in 50 mL of deionized water by mechanical attrition at 0.1 mol L−1
si-licon concentration. These materials will henceforth be referred to re-spectively as C-SiO2and M-SiO2.
2.1.2. Cerium loaded nanocontainers
In order to consider an exposed surface of 220 m2in each experi-ment and taking into account the different specific areas of the nano-materials, different volumes of the boehmite (C-AlOOH and Y-AlOOH) and silica (C-SiO2and M-SiO2) solutions described in2.1.1have been
used. 50 mL of boehmite solution was prepared using 22 mL of C-AlOOH or Y-C-AlOOH added to 28 mL of deionized water, whereas for the silica solution, 50 mL of C-SiO2or M-SiO2solutions were directly used.
The corrosion inhibitor, Ce(NO3)3·6H2O, in powder form was added to
the corresponding nanocontainers solutions (50 mL) and was stirred constantly for 12 h at room temperature. The total cerium concentra-tion was fixed at 10−3
mol L−1
for all the experiments. These Ce(III) modified sols will henceforth be referred to respectively as C-AlOOH-Ce, Y-AlOOH-C-AlOOH-Ce, C-SiO2-Ce and M-SiO2-Ce.
In order to study the effect of the C-AlOOH nanocontainer con-centration a second sol of C-AlOOH-Ce was prepared using directly 50 mL of the as-prepared solution (see2.1.1) to have an exposed surface of 500 m2, the total cerium concentration was kept at 10−3mol L−1.
2.1.3. Aluminum alloy substrate
The 2024-T3 aluminum alloy samples, the dimensions of which were 80 × 53 × 1 mm3 were used after a surface preparation. The
sample was cleaned according the following protocol: immersion in alkaline aqueous solution (pH = 9) for 20 min at 60 °C followed by immersion sulfo-nitro-ferric pickling for 5 min at room temperature. The sample was finally washed with acetone and air-dried. For the electrochemical experiments, a 7.06 cm2 circular work area was
de-limited using Teflon adhesive. The chemical composition of AA2024-T3 alloy (UNS A92024/EN-AW 2024) is given inTable 1.
2.2. Experimental techniques
The size and the morphology of the nanomaterials were examined by TEM microscopy using a high definition JEOL JEM-1400 at 120 kV. The powders were diluted in ethanol and then deposited on copper grid. For Cryo-TEM of the boehmite samples, 3 µL of sample were deposited onto a glow-discharged 200 mesh lacey carbon grid and loaded into the thermostatic chamber of a Leica EM-GP automatic plunge Freezer, set at 20 °C with 95% humidity. The grid was immediately flash frozen in liquid ethane cooled at −185 °C. Specimens were then transferred into a Gatan 626 cryo-holder, and Cryo TEM was carried out on a Jeol 2100 microscope, equipped with a LaB6cathode and operating at 200 kV,
under low dose conditions. The specific surface area, measured by BET method and adsorption-desorption isotherms were carried out with a Micromeritics Tristar 3020, using pure dinitrogen gaz. Prior to this, samples were degassed under vacuum at 200 °C during 12 h. Solid state NMR experiments were carried out with a Brucker Avance III 400 MHz (9,4 T). Decompositions of the CP MAS NMR spectra to extract the proportion of the corresponding species were performed with the DMfit software[46]. The Dynamic Light Scattering measurements (DLS) of aqueous dispersion of nanocontainers were taken using a Malvern Na-nosizer ZS 90. The Electrochemical Impedance Spectroscopy (EIS) measurements were carried out, at room temperature with a corrosion cell (flat cell by Metrohm) in a Faraday cage, using a Biologic SP-150
Alloys Al Cu Mg Mn Si Fe Zn Cr Ti Others
2024-T3 90.7–94.7 3.8–4.9 1.2–1.8 0.3–0.9 0.5 0.5 0.25 0.1 0.1 0.15 preventing the use of this analytical technique. The indirect method
chosen in this work is based on electrochemical impedance spectro-scopy measurements (EIS) which is largely used to evaluate the influ-ence of the addition of Ce(III) to the NaCl solution on the electro-chemical response of aluminum alloys when corrosion occurs. Cerium cation acts as a cathodic inhibitor, blocking the areas occupied by the cathodic intermetallics through the precipitation of a cerium oxide or hydroxide. The inhibition effect is reflected in the electrical response of the system by the minimisation of the values of the elements of the electrical loop related to the response of the cathodic intermetallics. Using EIS, circuits can therefore be proposed to model the electro-chemical behavior of the system when Ce(III) is added to the medium. It has been established that the film produced over the metal surface can be characterized by the values of the resistance R and capacitance C in each loop. [12–16,41] Thus, the increase observed in the values of R when the cerium salt is added to the solution could be related to the formation of a more compact film, as a consequence of the precipitation of cerium in the cathodic zones. In a solution containing Ce(III) and nanoparticles, if interaction between inhibitor and nanoparticle is es-tablished, the free Ce(III) concentration will decreased and as a con-sequence the corrosion of the aluminum substrate will intensify. The electrical response of the system is therefore an indirect method to prove the cerium loading on nanoparticles. In the same way an increase on the protection of the substrate could be related to the inhibitor re-lease phenomenon.
Based on this improved method to characterize the inhibiting properties of cerium in solution towards aluminum alloys, this study involves EIS to evidence the inhibitor loading of nanocontainers and its release to protect AA2024-T3 in 0.045 mol L−1 NaCl solution.
Taking into account the chemical compatibility between the nano-containers and the hybrid aluminosilicate sol-gel coatings which are known for their effective barrier properties [18,42], silica and boehmite
nanocontainers have been considered in this work. Comparisons be-tween these nanocontainers have been made, bearing in mind their different chemical natures and surface properties, given that the silica surface is negatively charged whereas the boehmite surface is positive, at the considered pH [43]. Their morphology was also modulated using
dense or mesoporous nanospheres for silica and boehmite nanoneedles. Different nanocontainers could thereby be discriminated according to the nature of the matrix and/or its morphology.
2. Experimental part 2.1. Materials
2.1.1. Starting nanomaterials
An initial boehmite sol was obtained from commercial Disperal P2 dispersible powder purchased by Sasol. A second boehmite starting material was prepared according to Yoldas method [44] by hydrolysis of aluminum tri-sec-butoxide (ASB) in hot water, followed by a pepti-sation step using nitric acid (69%) and the solution was kept at 85 °C during 24 h for maturation. These materials, prepared with an alu-minum concentration of 0.5 mol L−1, will henceforth be referred to
respectively as C-AlOOH and Y-AlOOH.
For the silica matrix, Ludox TMA (34 wt%) sol was used as received from Aldrich, 3.6 mL was added to 46.4 mL of deionized water to obtain a 0.5 mol L−1 silicon concentration. A second silica starting material
was synthesized using a microemulsion method described by A.B.D. Nandiyanto [45] with styrene as porogen reagent. After calcination Table 1
Composition specification (wt%) of the AA2024-T3.
29Si CP MAS NMR. Spectra of materials before and after calcination
show a decreasing proportion of Q2+ Q3silanol groups from 36% to 26% after the calcination step (Supplementary Material, Fig. S1). However, a large proportion remains available for the inhibitor loading. Y-AlOOH and C-AlOOH boehmite nanocontainers used in this work were very similar in size and morphology and were both easily avail-able for industrial application. The importance of using the Yoldas protocol to synthesize Y-AlOOH, compared to C-AlOOH was to avoid the air manipulation of nanopowders as the peptisation directly pro-duces a stable boehmite sol.
Morphological characterizations of the four nanocontainers in-volved in this work are summarized inTable 2.
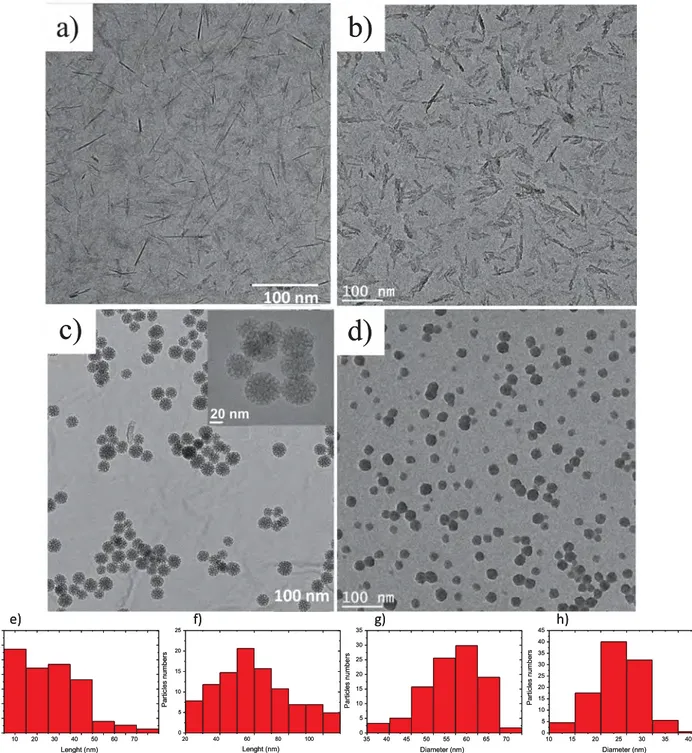
Fig. 1shows the TEM micrographs and histograms of particle size for the four nanomaterials. Two morphologies are observed according to the chemical nature: the anisotropic shape of needles for boehmite (Y-AlOOH,Fig. 1a, and C-AlOOH,Fig. 1b) and the spherical particles for silica (M-SiO2,Fig. 1c and C-SiO2,Fig. 1d). Histograms of particle
size (Fig. 1e–h) indicate that the length of boehmite particles are in the range of 10–40 nm and 30–70 nm for Y-AlOOH and C-AlOOH, respec-tively, indicating minimal aggregation for the C-AlOOH powder. As expected, diameters for the silica nanospheres are of 55 ± 10 nm and 25 ± 5 nm for M-SiO2and C-SiO2, respectively. Dynamic light
scat-tering measurements indicate that sizes are on the whole retained in solution with little aggregation for the smaller population. Nitrogen adsorption-desorption isotherms are of type IV for each of the samples (Supplementary material, Fig. S2). As expected, a characteristic type H1 hysteresis loop is observed for the mesoporous M-SiO2 nanomaterial
(1.87 cm3g−1
of porous volume) corresponding to the capillary con-densation into the porous structure. The three other samples displayed an H2 hysteresis loop characteristic of a pore size distribution with poorly defined morphology[47]. The specific area measurements using the BET method gave similar values for both types of boehmite
nanocontainers, 331 ± 1 m2g−1 and 339 ± 1 m2g−1 for Y-AlOOH
and C-AlOOH, respectively. The high value obtained for M-SiO2
parti-cles, 753 ± 2 m2g−1
, is in agreement with the observed porosity (inset
Fig. 1c) and contrasts with the 144 ± 8 m2g−1value obtained for the
dense C-SiO2nanocontainers.
These nanomaterials are potential supports for the loading of cerium (III) to provide inhibitor nanocontainers. They exhibit interesting spe-cific surface area and convenient surface properties due to the presence of hydroxyl groups which according to the pH value can be deproto-nated or not. Loading experiments were run by the addition of the corrosion inhibitor Ce(NO3)3,6H2O in the stirred aqueous sols 12 h at
room temperature. After this exceeding time, the loading equilibrium is reached and the modified sols contain cerium loaded on nanocontainers (NC-Ce) and free solvated Ce(III) (Eq.(1)). Direct reaction (1) corre-sponds to loading and reverse reaction (2) correcorre-sponds to the release phenomenon. + ⇄ Ce(III) NC NC-Ce 2 1 (1) In these experiments, the pH of the silica and boehmite sols were 6 and 4 respectively. Since silica isoelectric point (IEP) is around 2[43], it exhibits a negative surface charge able to physisorb aqua- or hydro-xoaquacerium cationic complexes [48]. Whereas boehmite IEP is around 9[49]thus exhibiting a positive surface charge able to physi-sorb anionic nitrato cerium complexes such as [Ce(NO3)4(H2O)x]−, as
described by Bleta[50]. This interaction between the inhibitor and the nanocontainers is well adapted to consider the release in the coating. As reported by Motte[40]in the case of steel coated involving cerium loaded nanoclays, corrosion protection is improved by the release of the fraction of the inhibitor adsorbed at the surface of the modified nano-clay.
The following section focuses on the study of the corrosion inhibitor release from M-SiO2-Ce, C-SiO2-Ce, Y-AlOOH-Ce and C-AlOOH-Ce
cerium loaded nanocontainers.
3.2. Study of Ce(III) corrosion inhibitor release
In order to evaluate the releasing properties of the cerium loaded nanocontainers, it is of interest to follow the electrochemical behavior of the AA2024-T3 in corrosive solution during a significant period of time. In this way, each experiment was extended to 336 h immersion time. Another important parameter is the inhibitor concentration in corrosive solution containing loaded nanocontainers. To determine this concentration, which is the minimal inhibitor concentration exhibiting an efficiency after 336 h immersion in corrosive solution, a preliminary study of the electrochemical behavior of the AA2024-T3 in corrosive solution in presence of cerium inhibitor in the range 0–10−2mol L−1
was undertaken. Indeed a too high inhibitor concentration could hide the inhibitor release from nanocontainers throughout the experiment.
3.2.1. Effect of the Ce(III) inhibitor concentration
The electrochemical behavior of the system was evaluated by electrochemical impedance spectroscopy (EIS) in a 0.045 mol L−1NaCl
corrosive electrolyte with a cerium concentration of 0, 10−5, 10−4,
10−3and 10−2mol L−1. In order to distinguish the processes at the
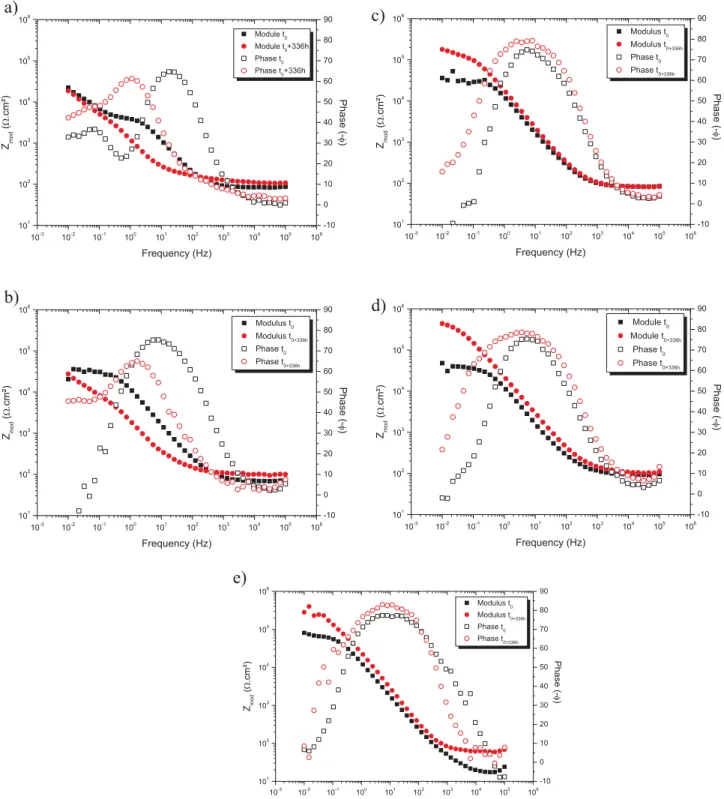
electrochemical interfaces throughout the immersion time, impedance measurements were recorded after 0, 3, 24, 48, 168 and 336 h im-mersion times.Fig. 2shows the Bode diagrams charting the phase angle shift and the modulus as a function of the frequency at the beginning and at the end of the experiment; that is at 0 and 336 h, for each cerium concentration. Graphs inFig. 2a display the behavior of the AA2024-T3 substrate without the corrosion inhibitor. In the two curves relative to the evolution of the phase angle shift, two well-defined time constants were observed. The first ones appeared respectively at 20 Hz and 1 Hz for 0 h and 336 h, whereas the second ones appeared respectively at 0.07 Hz and 0.04 Hz. The higher frequency time constant is attributed Table 2
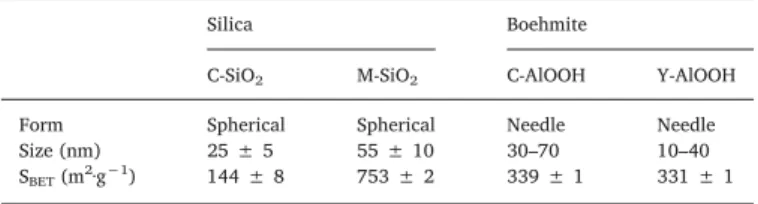
Morphological characterizations of the different nanoparticles.
Silica Boehmite
C-SiO2 M-SiO2 C-AlOOH Y-AlOOH
Form Spherical Spherical Needle Needle Size (nm) 25 ± 5 55 ± 10 30–70 10–40 SBET(m2·g−1) 144 ± 8 753 ± 2 339 ± 1 331 ± 1
coupled with EC-Lab V 10.34 controller software. The frequency range used was between 100 kHz and 0.01 Hz and a sinusoidal voltage am-plitude of 10 mV was applied during the experiments. A three electrode device was used, consisting of an Ag/AgCl reference electrode, a pla-tinum counter electrode and the exposed surface of alloy as the working electrode. Electrolytic sols for the electrochemical measurements were obtained by mixing 50 mL of the silica or boehmite sols described earlier, with 450 mL of NaCl solution (0.05 mol L−1). Between two
experiments corresponding to two immersion times, the solution was re-homogenized before each impedance measurements. For the six types of experiments (NaCl, NaCl + Ce, NaCl + C-SiO2-Ce, NaCl + M-SiO2-Ce, NaCl + C-AlOOH-Ce and NaCl + Y-AlOOH-Ce), EIS measure-ments was repeated with three different aluminum samples giving very similar results throughout the immersion times. Graphs, Figs. 4 and 7, chart the average values.
3. Results and discussion
3.1. Physicochemical characterization of the nanocontainers
Two samples of silica nanocontainers were evaluated. One is a commercial stable dispersion of monodisperse dense nanospheres, C-SiO2, the other one is M-SiO2 synthesized according to Nandiyanto [45]. The presence of silanol groups after calcination was confirmed by
to the presence of the natural oxide layer on the surface of the alloys whereas the lower frequency time constant is attributed to the corro-sion process[51]. As expected, without protection, a low phase angle shift value was measured around −65°. In regard to the evolution of the impedance modulus, the two curves differ in the 0.1 and 10 Hz fre-quency range, indicating that after 336 h of immersion, the natural oxide layer is altered by the corrosion process and partially replaced by corrosion products. When cerium is introduced in the corrosive solution (Fig. 2b–e), only one time constant is observed at the initial time (black curves), at around 10 Hz, corresponding to the phase angle shift in-volved by the oxide layer obtained in presence of cerium. This is ob-served even at the very low concentration of 10−5
mol L−1
(Fig. 2b). This unique time constant is explained by the authors[13–16]as the superposition of two time constants corresponding to the natural oxide and the oxide layer formed in the presence of cerium. After 336 h
immersion, the graphs exhibit a second time constant at 0.07 Hz for the two lowest concentrations (Fig. 2b and c) whereas in the case of the 10−3and 10−2mol L−1concentration, no corrosion was observed as
indicated by the presence of only one time constant in the graphs 2d and 2e. Intermediate experiments indicated that for the 10−5 and
10−4mol L−1concentrations no efficient protection was demonstrated
up to 3 h and 24 h respectively (Supplementary material, Fig. S3). The phase angle shift values corresponding to the oxide layer observed around 10 Hz reach −80° in the presence of cerium, moreover the spreading on the frequency range indicates the protective nature of the oxide hydroxide cerium layer[21].
Structural impedance modeling is performed for a precise quanti-tative interpretation of the impedance spectra. The selection of the equivalent electrical circuit is done on the grounds of the shape of the experimental data (Fig. 3, andSupplementary materials Fig. S5). 20 40 60 80 100 0 5 10 15 20 25 Pa rti cl es n um be rs Lenght (nm) 10 15 20 25 30 35 40 0 5 10 15 20 25 30 35 40 45 Par ticle s num be rs Diameter (nm) 35 40 45 50 55 60 65 70 0 5 10 15 20 25 30 35 Pa rti cles num ber s Diameter (nm) 10 20 30 40 50 60 70 0 5 10 15 20 25 30 35 Pa rti cle s num bers Lenght (nm)
)
h
)
g
)
f
)
e
c)
b)
d)
20 40 60 80 100 0 5 10 15 20 25 Pa rti cl es n um be rs Lenght (nm) 10 15 20 25 30 35 40 0 5 10 15 20 25 30 35 40 45 Par ticle s num be rs Diameter (nm) 35 40 45 50 55 60 65 70 0 5 10 15 20 25 30 35 Pa rti cles num ber s Diameter (nm) 10 20 30 40 50 60 70 0 5 10 15 20 25 30 35 Pa rti cle s num bers Lenght (nm))
h
)
g
)
f
)
e
c)
b)
d)
InFig. 3a and b, circuits are used to fit experimental data with and without the presence of cerium respectively. Among these circuits, Rsol
represents the solution resistance, Roxycorresponds to the resistance of
the metal solution interface composed by natural oxyide, Qoxy is the
capacitance due to the dielectric nature of this interface, Rct is the
charge transfer resistance related to the corrosion process and Qdlis a
constant phase element representative of the double layer capacitance. When cerium is added, terminologies were adapted with Rintand Qintto
describe the presence of protective film on the surface. In these
equivalent circuits, capacitances C were substituted by constant phase elements Q which depend on the frequency:
= − −
Q Y (jω)01 n
where Y0and n are constants independent on the angular frequency ω.
For values in the range of 0.8 < n < 1, the constant Y0has the
phy-sical meaning of capacitance. The substitution of C by Q is applicable when the phase shift of the current in respect to the voltage is less than −90°. 10-3 10-2 10-1 100 101 102 103 104 105 106 101 102 103 104 105 106 Module t0 Module t0+336h Phase t0 Phase t0+336h Frequency (Hz) Zmod ( .cm²) -10 0 10 20 30 40 50 60 70 80 90 Phase (-) 10-3 10-2 10-1 100 101 102 103 104 105 106 101 102 103 104 105 106 Modulus t0 Modulus t0+336h Phase t0 Phase t0+336h Frequency (Hz) Zmod ( .cm²) -10 0 10 20 30 40 50 60 70 80 90 Phase (-)
a)
b)
10-3 10-2 10-1 100 101 102 103 104 105 106 101 102 103 104 105 106 Modulus t0 Modulus t0+336h Phase t0 Phase t0+336h Frequency (Hz) Zmod ( .cm²) -10 0 10 20 30 40 50 60 70 80 90 Phase (-) 10-3 10-2 10-1 100 101 102 103 104 105 106 101 102 103 104 105 106 Module t0 Module t0+336h Phase t0 Phase t0+336h Frequency (Hz) Zmod ( cm²) -10 0 10 20 30 40 50 60 70 80 90 Phase (-)c)
d)
10-3 10-2 10-1 100 101 102 103 104 105 106 101 102 103 104 105 106 Modulus t0 Modulus t0+336h Phase t0 Phase t0+336h Frequency (Hz) Zmod ( .cm²) -10 0 10 20 30 40 50 60 70 80 90 Phase (-)e)
Fig. 2. Bode diagrams obtained for AA2024-T3 after 0 h (black square) and 336 h (red circle) of immersion in a 0.045 mol L−1solution containing (a) 0 mol L−1, (b) 10−5mol L−1, (c)
10−4mol L−1, (d) 10−3mol L−1, (e) 10−2mol L−1
cerium nitrate.(For interpretation of the references to colour in this figure legend, the reader is referred to the web version of this article.)
When cerium is introduced the determination of Rctis not possible
because of the presence of a protective layer (Rint), formed by the Ce
(III) corrosion product. This shifts charge transfer resistance at lower frequencies, below which stationary conditions are no longer reached. In this case a constant phase element was used to indicate the presence of a new interface (Fig. 3b). It is interesting to point out that for the lower concentration (10−5
mol L−1
), the choice of the equivalent cir-cuit changes according to the immersion time, since theFig. 3b circuit is well adapted only for t0whereas the circuit inFig. 3a is convenient
for all other immersion times indicating the fast consumption of the inhibitor.
In order to visualize the overall resistivity of the system, and to easily understand the results in term of anticorrosion performances, the
Roxyor Rintas a function of the immersion time was charted inFig. 4for
different cerium concentrations. The higher resistance led to the higher inhibition corrosion process. At 336 h immersion time, the lowest concentration corresponding to the highest protection was obtained for 10−3mol L−1 and this concentration was therefore chosen for the
loading and release experiments. Moreover, the graphs indicate that for this concentration the maximum inhibitor efficiency was reached after 48 h of immersion. For a 10−4mol L−1concentration stabilization was
achieved earlier (24 h) and for the lowest concentration, the low cerium activity observed at 3 h vanished immediately. For all concentrations, including the lowest one, the resistance was higher than that obtained without the inhibitor, indicating that the passivation rate induced by cerium is fast. This passivation rate will therefore be neglected towards the releasing rate.
The resultsFig. 4are in good agreement with the images of the AA2024-T3 samples after 336 h immersion in 0.045 mol L−1NaCl
so-lution, when cerium concentration increased from 0 to 10−2mol L−1
(Fig. 5). As expected in the absence of cerium or in the case of a very low concentration (10−5
mol L−1
) of cerium, the full area of the sam-ples are pitted (5a and 5b) whereas, in the presence of more than 10−3mol L−1of cerium (5d and 5e) the substrates are well protected.
For the intermediary concentration (10−4
mol L−1
, 5c) the presence of a yellow deposit is clearly detectable and can be identified as cerium derivated corrosion products.
3.2.2. Effect of the chemical nature of the inhibitor nanocontainers To evaluate the influence of the chemical nature of the nano-containers on the cerium loading and its release, the amount of each loaded nanomaterial (C-SiO2-Ce, M-SiO2-Ce, C-AlOOH-Ce and
Y-AlOOH-Ce) was calculated in order to keep the exposed surface con-stant, whilst also taking into account the specific surface area of each nanomaterial. As previously determined, the total cerium concentration is 10−3mol L−1in the 0.045 mol L−1NaCl corrosive solution. A
pre-liminary study involving unloaded nanomaterials was undertaken and showed that no beneficial effect is provided since the resistance values are in the same range than those obtained for the bare substrate throughout the immersion times (Supplementary material, Fig. S4).
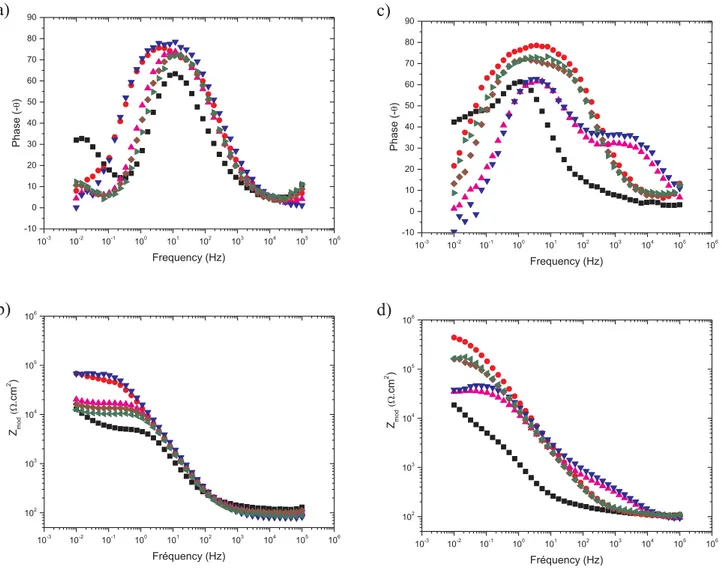
Fig. 6shows impedance spectra in Bode diagrams of AA2024-T3 after 3 h (a, b) and 336 h (c, d) of immersion in 0.045 M NaCl solution in presence of the loaded nanocontainers C-SiO2-Ce, M-SiO2-Ce,
Y-AlOOH-Ce or C-AlOOH-Ce. An experiment containing cerium (10−3mol L−1) was displayed for comparison.
At 3 h of immersion (Fig. 6a), the phase angle shows only one time constant at 5–10 Hz in the range −77° to −73°, relative to a natural oxide layer with cerium derivated corrosion products, for all samples. However, different behaviors were observed depending on the nano-containers. Unlike mesoporous silica nanocontainers M-SiO2-Ce whose
values are very similar to those obtained with cerium without nano-containers, the evolutions of the phase angle and the impedance mod-ulus (Fig. 6b) for C-SiO2-Ce, Y-AlOOH-Ce and C-AlOOH-Ce indicate a
lower protection. This difference can be explained by the cerium loading on the later nanocontainers, decreasing the available amount of cerium in the solution. For the silica based nanomaterials, given that
Rsol Roxy Qoxy Rct Qdl Rsol Rint Qint Qdl Rsol Rsoxy Qsoxy Rint Qint Qdl a) b) c)
Fig. 3. Scheme of the equivalent circuits used for fitting the experimental data, (a) without cerium, (b and c) with cerium and nanocontainers.
0 25 50 75 100 125 150 175 200 225 250 275 300 325 350 102 103 104 105 106 Roxy / int ( cm 2 )
Immersion times (hours) NaCl NaCl + 10-5 M NaCl + 10-4 M NaCl + 10-3 M NaCl + 10-2 M
Fig. 4. Evolution of the Roxy/int obtained for AA2024-T3 during immersion in 0.045 mol L−1NaCl containing: 0 mol L−1(black square), 10−5mol L−1(orange bottom
triangle), 10−4mol L−1(green diamond), 10−3mol L−1(red circle) and 10−2mol L−1
(blue top triangle) cerium nitrate.(For interpretation of the references to colour in this figure legend, the reader is referred to the web version of this article.)
the nature of the interaction silica/inhibitor is the same between C- and M-SiO2 materials, the different behavior of both matrices can be related to the different morphologies. In the case of M-SiO2a surprisingly weak
loading can be observed, which is probably due to the tortuosity of the mesoporosity obtained using styrene as porogen agent in state of the well-ordered porosity obtained when a structuring agent such as CTAB was used.
After 336 h of immersion (Fig. 6c), the time constant observed at 5–10 Hz after 3 h, remained around −73° for Y-AlOOH-Ce and C-AlOOH-Ce, whereas it changed from −77° to −62° for M-SiO2-Ce,
in-dicating a higher release kinetics for boehmite nanocontainers com-pared to the silica ones. Changes were also apparent in the broadening of the frequency range observed for this time constant with free cerium or with cerium loaded boehmite nanocontainers, clearly indicating an increased availability of the inhibitor to protect the substrate from corrosion in these systems. A new time constant at the higher frequency of 2 × 10³Hz, was visible only in the case of silica nanocontainers,
which could be due to the deposition of nanocontainers at the surface of the AA2024-T3 substrate which was observed from 168 h of immersion time hindering any discussion about the release process from that moment on. The kind of silica film deposition was not explored in any further depth in this paper, in relation to the lower loading and release capacities of these nanocontainers highlighted for the shorter immer-sion time.
The positive effect of boehmite nanocontainers is confirmed by the increase of the impedance modulus from 1.5 × 10⁴Ω·cm2 up to
1.6 × 10⁵
Ω·cm2for both boehmite samples during immersion (Fig. 6d). The impedance spectra for samples in the presence of cerium or nanocontainers exhibiting only one time constant can be represented by the equivalent circuit given inFig. 3b, where Rintcorresponds to the
resistance of the interface constituted of natural oxide and cerium products and Qintits capacitance. In the presence of silica
nanocontai-ners at 336 h of immersion the spectra exhibiting two time constants can be represented by the circuit given inFig. 3c. In this case the parameters, Rsoxy and Qsoxy, were involved corresponding to the
re-sistance and the capacitance of the superficial oxide. The data in
Table 3show that the electrochemical parameters which characterized the interfaces of the systems have completely reliable values, with χ2 criterium around 10−3
value .
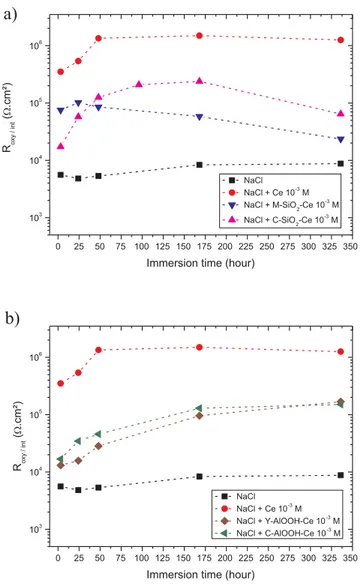
Because of the Eq.(1), free Ce(III), cerium loaded nanocontainers (NC-Ce) and unloaded nanocontainers (NC) coexist in solution. Con-sidering that only the free cerium acts as inhibitor, when corrosion occurs, free cerium concentration decreases and the position of equili-brium, Eq.(1), moves to the reverse reaction involving the releasing process. In order to track the release of cerium, evolution of Rintwas
performed throughout the immersion in the corrosive media (Fig. 7). Flagrant differences appeared on electrochemical parameters indicating that Rintis a real indicator of the activity of the free cerium in solution.
In this paper, EIS is therefore used to estimate the loading and the re-lease of the cerium inhibitor from nanocontainers.
Fig. 7a shows the evolution of the interface resistance as a function of the immersion time for the solutions containing free solvated cerium
10-3 10-2 10-1 100 101 102 103 104 105 106 -10 0 10 20 30 40 50 60 70 80 90 Phase (-) Frequency (Hz) 10-3 10-2 10-1 100 101 102 103 104 105 106 102 103 104 105 106 Zmod .cm 2 ) Fréquency (Hz)
a)
b)
10-3 10-2 10-1 100 101 102 103 104 105 106 -10 0 10 20 30 40 50 60 70 80 90 Phase (-) Frequency (Hz) 10-3 10-2 10-1 100 101 102 103 104 105 106 102 103 104 105 106 Zmod .cm 2 ) Fréquency (Hz)c)
d)
Fig. 6. Bode diagrams obtained for AA2024 T3 after 3 h (a, b) and 336 h (c, d) of immersion in a 0.045 mol L−1NaCl solution containing cerium without nanocontainers, M-SiO 2-Ce;
(III) (10−3mol L−1) and the two loaded silica nanomaterials, C-SiO
2-Ce
and M-SiO2-Ce. The resistance values at 3 h of immersion are
sig-nificantly different between silica nanocontainers indicating that the amount of free cerium is not the same for the three experiments. The lower value obtained with C-SiO2silica nanomaterials highlights that
cerium loading occurs since the resistance values decrease from 3.5 × 10⁵Ω·cm2for the free cerium solution to 1.7 × 10⁴Ω·cm2in the presence of C-SiO2-Ce nanocontainers. In the presence of M-SiO2-Ce Rint
is near constant (7.5 × 10⁴
Ω·cm2) indicating that a lower amount of cerium is loaded compared to the dense Ludox silica C-SiO2
nanoma-terials. This unexpected difference can be explained by an easier area accessibility of the silica surface for the later. The evolution of the re-sistance according to the time-frame determines the inhibitor release from the nanocontainers. In the presence of the M-SiO2-Ce
nano-containers, the resistance remains quite constant from 3 h to 336 h, indicating that no release occurs. In the case of the C-SiO2-Ce
nano-containers, a gradual increase of the resistance is observed between 3 h and 168 h of immersion. This result emphasizes the releasing process, which reaches it maximum at 168 h.
The results involving loaded boehmite nanomaterials are given in
Fig. 7b. The values of Rintat the beginning of immersion (3h) are yet
again lower than the value observed for the free inhibitor experiments. Both C-AlOOH-Ce and Y-AlOOH-Ce nanocontainers exhibit the same behavior with a unique resistance value of an average of
1.4 × 10⁴
Ω·cm2. This value, which is lower than that observed with silica based nanocontainers, indicates that loading phenomenon is more important on boehmite nanomaterials. In regard to the evolution of the resistance values throughout the immersion, more than one decade between 3 h and 336 h, inhibitor release is yet to be established. In-terestingly, for boehmite nanocontainers the release process is present for longer immersion times than for C-SiO2-Ce containers. Due to the
fact that the loading amount of cerium(III) is the same for both boeh-mite nanocontainers whose morphology is similar, the same behavior is observed throughout the immersion times. Moreover, the resistance values reached their limit at 1.7 × 10⁵ and 1.5 × 10⁵Ω·cm2 for
Y-AlOOH-Ce and C-Y-AlOOH-Ce respectively, which are lower than those obtained for the free cerium experiments, and indicate that cerium partially remains loaded on boehmite nanocontainers even after 336 h of immersion.
According to the electrochemical results, the cerium loading was established and the morphology of the matrix seems to be more influent than the chemical nature since for a constant available surface, the mesoporous silica nanomaterial provides the lower loaded amount. Surprisingly, it is of interest to give priority to dense nanocontainers for the reservoir application. The effect of the chemical nature of the na-nocontainers is pointed out when the inhibitor release is taken into consideration. Cationic cerium species are more quickly liberated from C-SiO2-Ce (168 h) than the anionic ones from the C-AlOOH-Ce and
Y-AlOOH-Ce boehmite nanocontainers (336 h). In order to develop self-healing coatings boehmite nanocontainers appeared as the prime can-didate, combining a good loading ratio with the highest release in the first week of immersion.
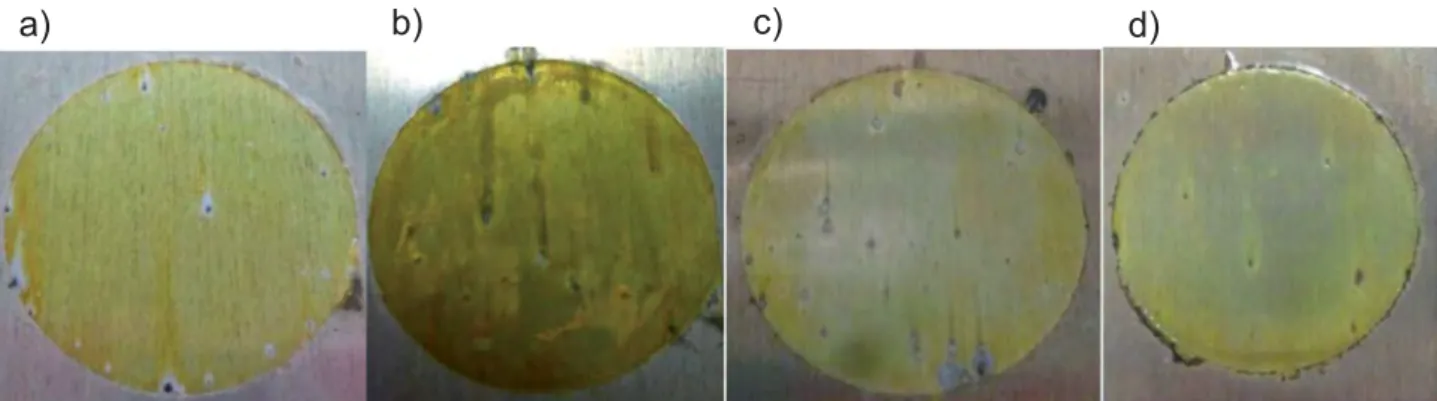
By comparing the images inFig. 8, the loading of cerium in nano-containers is demonstrated by the presence of corrosion pits which are visible in samples 8c and 8d. Physisorption is clearly highlighted since the images (Fig. 8c and d) are very different from those inFig. 5d. The pits which can be observed here are a result of concentration of the free cerium in the early stages due to the physisorption phenomenon. Nevertheless, the evaluation of the releasing rate between silica and boehmite is not possible with these images. These results emphasize that silica and boehmite nanoparticles when introduced in solution and eventually in sol-gel coatings, will act as nanocontainers, reinforcing the inhibitor effect of the free cerium.
3.2.3. Effect of the C-AlOOH nanocontainers concentration
We have investigated the effect of the C-AlOOH-Ce nanocontainers concentration on the electrochemical responses. The previous results, detailed in Section 3.2.2 (aluminum concentration equal to 0.02 mol L−1
), were compared with a new electrolytic sol, the alu-minum concentration of which was 0.05 mol L−1and the cerium
con-centration of 10−3mol L−1was retained.
Fig. 9shows the evolution of the modulus and phase angle shift as a function of the frequency for two nanocontainers content, (9a) 1.2 g L−1 and (9b) 3 g L−1, at different immersion times (24 h and
336 h). On both graphs, at 24 h of immersion (black curves), a plateau on the modulus part is associated with the resistance of the interface layer consisting of the natural oxide layer and the layer formed by the precipitation of the cerium. This resistance value is lower for the highest aluminum concentration, 4 × 10⁴and 1.4 × 10⁴
Ω·cm2for 0.02 and 0.05 mol L−1, respectively. This decrease corresponds with a higher
available surface area for loading involving a lower amount of free cerium in solution. For the lower aluminum concentrations 0.02 mol L−1, the increase of the modulus between 24 h and 336 h from
4 × 10⁴to 1.1 × 10⁵Ω·cm2indicates the cerium release as previously
described. This phenomenon is highlighted in the case of the 0.05 mol L−1 concentration (1.4 × 10⁴ to 1.7 × 10⁵
Ω·cm2), demon-strating an equivalent protection at 336 h for both concentrations.
On the phase angle shift part, two time constants are visible at 24 h for both concentrations, the first one at 12 Hz, associated with the natural oxide layer and cerium products at the interface and the second
0 25 50 75 100 125 150 175 200 225 250 275 300 325 350 103 104 105 106 Roxy / int ( .cm²)
Immersion time (hour)
NaCl NaCl + Ce 10-3 M
NaCl + M-SiO2-Ce 10 -3 M
NaCl + C-SiO2-Ce 10 -3 M 0 25 50 75 100 125 150 175 200 225 250 275 300 325 350 103 104 105 106 NaCl NaCl + Ce 10-3 M NaCl + Y-AlOOH-Ce 10-3 M NaCl + C-AlOOH-Ce 10-3 M Roxy / int ( .cm²)
Immersion time (hour)
a)
b)
Fig. 7. Evolution of the interface resistance obtained for AA2024-T3 during immersion in 0.045 mol L−1NaCl solution containing (a) 10−3mol L−1cerium and silica-based
at around 0.02 Hz, associated with an oxydo-reduction phenomenon, as already reported by Mishra[12].
This observation can also be related to the increase of the low fre-quency modulus indicating a higher global resistance. The spreading on the frequency range with the immersion time, for the time constant around 10 Hz, indicates a better protection due to the inhibitor release. As expected this phenomenon is more pronounced when nanocontai-ners concentration is higher.
These experiments show that the release phenomenon is retained even if the same inhibitor amount is in the presence of a large number of nanocontainers.
4. Conclusions
This work highlights the loading and the release of the inorganic corrosion inhibitor from nanocontainers in corrosive solution using EIS
spectroscopy. Two inorganic matrices have been evaluated as nano-containers towards cerium (III) ion as inhibitor.
Cerium loaded silica nanocontainers have been studied highlighting the influence of the microstructure of the nanomaterials. Surprisingly mesoporous silica (M-SiO2) provides the lower loaded amount
com-pared to the dense one (C-SiO2) because of a tortuous porosity.
Both boehmite nanocontainers, Y-AlOOH and C-AlOOH, are con-venient nanocontainers towards cerium (III) since the loading and the release of the corrosion inhibitor have been well established and these nanomaterials are now available to be introduced in sol-gel coatings. The result obtained in the presence of a large amount of C-AlOOH nanocontainers indicates that it could be possible to carry out coatings using these particles as both containers and fillers in order to improve the corrosion protection of the AA2024-T3 aluminum alloy.
Table 3
Values of impedance parameters obtained after fitting the experimental spectra of AA2024-T3 after 3 h and 336 h of immersion in a 0.045 mol L−1NaCl solution containing 10−3mol L−1
cerium without nanocontainers, M-SiO2-Ce; C-SiO2-Ce; Y-AlOOH-Ce and C-AlOOH-Ce.
Fitting parameters 3 h
NaCl NaCl + Ce NaCl + C-SiO2-Ce NaCl + M-SiO2-Ce NaCl + C-AlOOH-Ce NaCl + Y-AlOOH-Ce
Rsol(Ω·cm2) 134 84.7 84.7 67.8 94.6 81.3 Roxy/int103(Ω·cm2) 5.30 52.9 16.0 68.3 10.7 10.9 Qoxy/int10−5(sn·Ω−1·cm−2) 2.24 1.29 1.05 0.97 1.30 1.26 noxy/int 0.87 0.93 0.98 0.94 0.91 0.97 Rct103(Ω·cm2) 14.7 Qdl10−4(sn·Ω−1·cm−2) 12.3 3.12 8.11 13.6 33.9 10.0 ndl 0.96 0.55 0.39 0.36 0.82 0.44 Rsoxy(Ω·cm2) Qsoxy10−5(sn·Ω−1·cm−2) nsoxy χ210−3 7.75 1.75 1.17 1.47 8.66 1.42 Fitting parameters 336 h
NaCl NaCl + Ce NaCl + C-SiO2-Ce NaCl + M-SiO2-Ce NaCl + C-AlOOH-Ce NaCl + Y-AlOOH-Ce
Rsol(Ω·cm2) 141 113 77.7 67.8 106 83.2 Roxy/int103(Ω·cm2) 3.75 498 37.2 48.3 207 145 Qoxy/int10−5(sn·Ω−1·cm−2) 29.3 0.91 1.60 0.10 1.37 1.66 noxy/int 0.80 0.89 0.83 0.87 0.84 0.85 Rct103(Ω·cm2) 45.7 – – – – – Qdl10−4(sn·Ω−1·cm−2) 4.53 31.3 221 41,899 102 30.0 ndl 0.78 0.24 0.28 0.41 0.15 0.28 Rsoxy(Ω·cm2) – – 544 1023 – – Qsoxy10−5(sn·Ω−1·cm−2) – – 1.81 1.93 – – nsoxy – – 0.60 0.57 – – χ210−3 5.97 1.09 0.764 0.74 3.12 1.39
a)
b)
c)
d)
Fig. 8. Optical images of AA2024-T3 samples (7 cm2) after 336 h immersion in 0.045 mol L−1NaCl solution containing nanocontainers with 10−3mol L−1cerium: M-SiO
2(a); C-SiO2(b);
Acknowledgements
The present work was carried out as a part of the ECOREV project. The Regional Councils of the Midi-Pyrénées and the Mecaprotec Industries are gratefully acknowledged for the financial support they provided for this project. The authors are grateful for the Institut Carnot CIRIMAT. This work benefited from the assistance of the Multiscale Electron Imaging platform (METi) of the FRBT and the authors would like to thank Stéphanie Balor for the Cryo-TEM measurements.
Appendix A. Supplementary data
Supplementary data associated with this article can be found, in the online version, athttp://dx.doi.org/10.1016/j.mseb.2017.12.026.
References
[1] M.W. Kendig, R.G. Buchheit, Corrosion inhibition of aluminum and aluminum al-loys by soluble chromates, chromate coatings, and chromate-free coatings, Corrosion 59 (5) (2003) 379–400.
[2] W.R. McGovern, P. Schmutz, R.G. Buchheit, R.L. McCreery, Formation of chromate conversion coatings on Al-Cu-Mg intermetallic compounds and alloys, J. Electrochem. Soc. 147 (12) (2000) 4494–4501.
[3] J.H. Osborne, K.Y. Blohowiak, S.R. Taylor, C. Hunter, G. Bierwagon, B. Carlson, D. Bernard, M.S. Donley, Testing and evaluation of nonchromated coating systems for aerospace applications, Prog. Org. Coat. 41 (4) (2001) 217–225.
[4] E. Gonzalez, J. Pavez, I. Azocar, J.H. Zagal, X. Zhou, F. Melo, G.E. Thompson, M.A. Paez, A silanol-based nanocomposite coating for protection of AA-2024 alu-minum alloy, Electrochim. Acta 56 (22) (2011) 7586–7595.
[5] M. Oubaha, P.C.R. Varma, B. Duffy, Z.M. Gasem, S.J. Hinder, Development of a novel hybrid aluminum-based Sol-Gel materials: application to the protection of AA2024-T3 alloys in alkaline environment, Adv. Mater. Phys. Chem. 4 (2014) 75–84.
[6] M.L. Zheludkevich, I. Miranda, Salvado, M.G.S Ferreira, Sol-gel coatings for cor-rosion protection of metals, J. Mater. Chem. 15 (2005) 5099–5111.
[7] K.A. Yasakau, M.L. Zheludkevich, O.V. Karavai, M.G.S. Ferreira, Influence of in-hibitor addition on the corrosion protection performance of sol-gel coatings on AA2024, Prog. Org. Coat. 63 (3) (2008) 352–361.
[8] I. Recloux, M. Mouanga, M.-E. Druart, Y. Paint, M.-G. Olivier, Silica mesoporous thin films as containers for benzotriazole for corrosion protection of 2024 alu-minum alloys, Appl. Surf. Sci. 346 (2015) 124–133.
[9] M. Iannuzzi, T. Young, G.S. Frankel, Aluminum alloy corrosion inhibition by va-nadates, J. Electrochem. Soc. 153 (12) (2006) 533–541.
[10]P. Campestrini, H. Terryn, A. Hovestad, J.H.W. de Wit, Formation of a cerium-based conversion coating on AA2024: relationship with the microstructure, Surf. Coat. Technol. 176 (2004) 365–381.
[11]K.A. Yasakau, M.L. Zheludkevich, S.V. Lamaka, M.G.S. Ferreira, Mechanism of corrosion inhibition of AA2024 by rare-earth compounds, J. Phys. Chem. B 110 (11) (2006) 5515–5528.
[12]A.K. Mishra, R. Balasubramaniam, Corrosion inhibition of aluminum alloy AA2014 by rare earth chlorides, Corros. Sci. 49 (2007) 1027–1044.
[13]A. Kumar Mishra, R. Balasubramaniam, Corrosion inhibition of aluminium by rare earth chlorides, Mater. Chem. Phys. 103 (2007) 385–393.
[14]E.A. Matter, S. Kozhukharov, M. Machkova, V. Kozhukharov, Comparison between the inhibition efficiencies of Ce(III) and Ce(IV) ammonium nitrates against corro-sion of AA2024 aluminum alloy in solutions of low chloride concentration, Corros. Sci. 62 (2012) 22–33.
[15]M. Machkova, E.A. Matter, S. Kozhukharov, V. Kozhukharov, Effect of the anionic part of various Ce(III) salts on the corrosion inhibition efficiency of AA2024 alu-minium alloy, Corros. Sci. 69 (2013) 396–405.
[16]E.A. Matter, S. Kozhukharov, M. Machkova, V. Kozhukharov, Electrochemical study on the corrosion inhibition of AA2024 aluminum alloy by rare earth ammonium nitrates in 3.5% NaCl solutions, Mater. Corros. 64 (5) (2013) 408–414. [17]J.B. Cambon, F. Ansart, J.P. Bonino, V. Turq, Effect of cerium concentration on
corrosion resistance and polymerization of hybrid sol-gel coating on martensitic stainless steel, Prog. Org. Coat. 75 (2012) 486–493.
[18]J.B. Cambon, J. Esteban, F. Ansart, J.P. Bonino, V. Turq, S.H. Santagneli, C.V. Santilli, S.H. Pulcinelli, Effect of cerium on structure modifications of a hybrid sol-gel coating, its mechanical properties and anticorrosion behavior, Mater. Res. Bull. 47 (2012) 3170–3176.
[19]D.G. Shchukin, H. Mohwald, Self-repairing coatings containing active nanor-eservoirs, Small 3 (6) (2007) 926–943.
[20]M.L. Zheludkevich, R. Serra, M.F. Montemor, K.A. Yasakau, I.M.M. Salvado, M.G.S. Ferreira, Nanostructured sol-gel coatings doped with cerium nitrate as pre-treatments for AA2024-T3 corrosion protection perfomance, Electrochim. Acta 51 (2005) 208–217.
[21]J. Fu, T. Chen, M.D. Wang, N.W. Yang, S.N. Li, Y. Wang, X.D. Liu, Acid and alkaline dual stimuli-responsive mechanized hollow mesoporous silica nanoparticles as smart nanocontainers for intelligent anticorrosion coatings, ACS Nano 7 (12) (2013) 11397–11408.
[22]M. Yeganeh, M. Saremi, Corrosion inhibition of magnesium using biocompatible alkyd coatings incorporated by mesoporous silica nanocontainers, Prog. Org. Coat. 79 (2015) 25–30.
[23]D. Borisova, H. Mohwald, D.G. Shchukin, Influence of embedded nanocontainers on the efficiency of active anticorrosive coatings for aluminum alloys Part I: influence of nanocontainer concentration, ACS Appl. Mater. Interfaces 4 (2012) 2931–2939. [24]G.L. Li, Z. Zheng, H. Mohwald, D.G. Shchukin, Silica/polymer double-walled hybrid nanotubes: synthesis and application as stimuli-responsive nanocontainers in self-healing coatings, ACS Nano 7 (3) (2013) 2470–2478.
[25]M. Wang, M. Liu, J. Fu, An intelligent anticorrosion coating based on pH-responsive smart nanocontainers fabricated via a facile method for protection of carbon steel, J. Mater. Chem. A 3 (2015) 6423–6431.
[26]A. Chenan, S. Ramya, R.P. George, U.K. Mudali, Hollow mesoporous zirconia na-nocontainers for storing and controlled releasing of corrosion inhibitors, Ceram. Int. 40 (2014) 10457–10463.
[27]A.C. Balaskas, I.A. Kartsonakis, L.A. Tzivelaka, G.C. Kordas, Improvement of anti-corrosive properties of epoxy-coated AA2024-T3 with TiO2nanocontainers loaded with 8-hydroxyquinoline, Prog. Org. Coat. 74 (2012) 418–426.
[28]Y. Tang, Z. Cao, J. Xu, H. Cang, W. Jing, Titanate matrices as potential corrosion inhibitor nanocontainers, Corros. Sci. 88 (2014) 487–490.
[29]M.F. Montemor, D.V. Snihirova, M.G. Tabira, S.V. Lamaka, I.A. Kartsonakis, A.C. Balaskas, G.C. Kordas, J. Tedim, A. Kuznetsova, M.L. Zheludkevich, M.G.S. Ferreira, Evaluation of self-healing ability in protective coatings modified with combinaisons of layered double hydroxides and cerium molibdate nano-containers filled with corrosion inhibitors, Electrochim. Acta 60 (2012) 31–40. [30]J. Tedim, M.L. Zheludkevich, A.N. Salak, A. Lisenkov, M.G.S. Ferreira,
Nanotructured LDH-container layer with active protection functionality, J. Mater. Chem. 21 (2011) 15464–15470.
[31]M.L. Zheludkevich, S.K. Poznyak, L.M. Rodrigues, D. Raps, T. Hack, L.F. Dick, T. Tunes, M.G.S. Ferreira, Active protection coatings with layered double hydroxide nanocontainers of corrosion inhibitor, Corros. Sci. 52 (2010) 602–611. [32]E. Abdullayev, R. Price, D.G. Shchukin, Y. Lvov, Halloysite tubes as nanocontainers
for anticorrosion coating with benzotriazole, ACS Appl. Mater. Interfaces 1 (7) (2009) 1437–1443.
[33]D.G. Shchukin, S.V. Lamaka, K.A. Yasakau, M.L. Zheludkevich, M.G.S. Ferreira,
10-3 10-2 10-1 100 101 102 103 104 105 106 101 102 103 104 105 106 Modulus t0+ 24h Modulus t0+336h Phase t0+ 24h Phase t0+336h Frequency (Hz) Zmod ( .cm²) -10 0 10 20 30 40 50 60 70 80 90 Phase (-) 10-3 10-2 10-1 100 101 102 103 104 105 106 101 102 103 104 105 106 Modulus t0+ 24h Modulus t0+336h Phase t0+ 24h Phase t0+336h Frequency (Hz) Zmod ( cm²) -10 0 10 20 30 40 50 60 70 80 90 Phase (-)
a)
b)
Fig. 9. Bode diagrams obtained for AA2024 T3 after 24 h (black square) and 336 h (red circle) of immersion in a 0.045 mol L−1NaCl solution containing (a) 0.02 mol L−1and (b)
0.05 mol L−1aluminum concentration.(For interpretation of the references to colour in
[34] R.F. Fakhrullin, A. Turnsunbayeva, V.S. Portnov, Y.M.L. Lvov, Ceramic nanotubes for polymer composites with stable anticorrosion properties, Crystallogr. Rep. 59 (7) (2014) 1107–1113.
[35] S.H. Sonawane, B.A. Bhanvase, A.A. Jamali, S.K. Dubey, S.S. Kale, D.V. Pinjari, R.D. Kulkarni, P.R. Gogate, A.B. Pandit, Improved active anticorrosion coatings using layed-by-layer assembled ZnO nanocontainers with benzotriazole, Chem. Eng. J. 189–190 (2012) 464–472.
[36] I.A. Kartsonakis, E. Athanasopoulou, D. Snihirova, B. Martins, M.A. Koklioti, M.F. Montemor, G. Kordas, C.A. Charitidis, Multifunctional epoxy coatings com-bining a mixture of traps and inhibitor loaded nanocontainers for corrosion pro-tection of AA2024-T3, Corros. Sci. 85 (2014) 147–159.
[37] S.V. Lamaka, M.L. Zheludkevich, K.A. Yasakau, M.F. Montemor, M.G.S. Ferreira, High effective organic corrosion inhibitor for 2024 aluminum alloy, Electrochim. Acta 52 (2007) 7231–7247.
[38] N.P. Tavandashti, S. Sanjabi, Corrosion study of hybrid sol-gel coatings containing boehmite nanoparticles loaded with cerium nitrate corrosion inhibitor, Prog. Org. Coat. 69 (2010) 384–391.
[39] Y. Wang, D. Zhang, Synthesis, characterization and controlled release anticorrosion behavior of benzoate intercalated Zn-Al layered double hydroxides, Mater. Res. Bull. 46 (2011) 1963–1968.
[40] C. Motte, M. Poelman, A. Roobroeck, M. Fedel, F. Deflorian, M.-G. Olivier, Improvement of corrosion protection offered to galvanized steel by incorporation of lanthanide modified nanoclays in silane layer, Prog. Org. Coat. 74 (2012) 326–333. [41] A. Aballe, M. Bethencourt, F.J. Botana, M.J. Cano, M. Marcos, Inhibition of the
corrosion process of alloy AA5083 (Al-Mg) in seawater by cerium cations. An EIS study, Mater. Corros. 52 (2001) 344–350.
[42]R.B. Figueira, C.J.R. Silva, E.V. Pereira, Organic–inorganic hybrid sol-gel coatings for metal corrosion protection: a review of recent progress, J. Coat. Technol. Res. 12 (1) (2015) 1–35.
[43]J.A. Schwarz, C.T. Driscoll, A.K. Bhanot, The zero point of charge of silica- alumina oxide suspensions, J. Colloid Interface Sci. 97 (1) (1984) 55–61.
[44]B.E. Yoldas, Alumina gels that form porous transparent Al2O3, J. Mater. Sci. 10 (1975) 1856–1860.
[45]A.B.D. Nandiyanto, S.G. Kim, F. Iskandar, K. Okuyama, Synthesis of spherical me-soporous silica nanoparticles with nanometer-size controllable pores and outer diameters, Microporous Mesoporous Mater. 120 (2009) 447–453.
[46]D. Massiot, F. Fayon, Modelling one- and two-dimensional solid-state NMR spectra, Magn. Reson. Chem. 40 (2002) 70–76.
[47]K.S.W. Sing, Reporting physisorption data for gas/solic systems, Pure Appl. Chem. 54 (11) (1982) 2201–2218.
[48]B. Bouchaud, J. Balmain, G. Bonnet, F. Petraza, pH distribution of cerium species in aqueous systems, J. Rare Earths 30 (6) (2012) 559–562.
[49]R. Wood, D. Fornasiero, J. Ralston, Electrochemistry of the boehmite-water inter-face, Colloids Surf. 51 (1990) 389–403.
[50]R. Bleta, O. Jaubert, M. Gressier, M.-J. Menu, Rheological behaviour and spectro-scopic investigations of cerium-modified AlO(OH) colloidal suspensions, J. Colloid Interface Sci. 363 (2011) 557–565.
[51]M.L. Zheludkevich, K.A. Yasakau, S.K. Poznyak, Triazole and thiazole derivatives as corrosion inhibitors for AA2024 aluminum alloy, Corros. Sci. 47 (2005) 3368–3383. R.
H. Mohwald, Active anticorrosion coatings with halloysite nanocontainers, J. Phys. Chem. C 112 (2008) 958–964.