1
Millennial disturbance-driven forest stand dynamics in the Eastern Canadian
1
taiga reconstructed from subfossil logs
2
Fabio Gennaretti1*, Dominique Arseneault1 and Yves Bégin2. 3
1. Département de biologie, chimie et géographie, Centre d’Études Nordiques, 4
Université du Québec à Rimouski, 300, allée des Ursulines, C. P. 3300, succ. A, 5
Rimouski (Québec) Canada, G5L 3A1. 6
2. Centre Eau Terre Environnement, Institut national de la recherche scientifique, 7
490, rue de la Couronne, Québec (Québec) Canada, G1K 9A9. 8
*Correspondence author. Email: Fabio.Gennaretti@uqar.ca; Fax number: 001 418 9
724 1849 10
Running headline: Fire impacts on boreal landscape diversity 11
2
Summary
12
1. Although wildfire is the main natural disturbance factor driving changes in the 13
North American boreal forest, understanding how the fire history of the last 14
millennium shaped the present-day landscape diversity is a difficult task due to the 15
lack of paleoecological reconstructions with high spatial (few hundreds of square 16
meters) and temporal (annual) resolutions. 17
2. We combined a detailed inventory of the present-day lakeshore forest of two 18
lakes of the Eastern Canadian taiga with the dendrochronological dating of the 19
subfossil logs that accumulated in the littoral zones facing these shores. Our 20
objective was to compare the millennial impact of wildfires among stands of various 21
structures and compositions. Past stem densities and fire years were 22
reconstructed from log recruitment rates and dating of charred logs. 23
3. Multivariate analysis of the present-day lakeshore forest revealed three and two 24
homogeneous shore segments per site (i.e. clusters). Cluster 1 at both sites 25
exhibited denser forest, higher dead wood values and a higher percentage of 26
balsam fir, a fire-sensitive species. 27
4. In total, 426 and 611 subfossil logs (mostly black spruce) were crossdated over 28
the last ~1400 years. Their dendrochronological analysis confirmed that each 29
lakeshore cluster, identified from the traits of the present-day forest, experienced 30
a specific fire history over the last millennium (i.e. 0-5 fires of variable severity) that 31
locally influenced forest composition, tree density and growth. Each fire triggered 32
3
a specific forest structure trajectory characterized by a different stem density and 33
rate of recovery. 34
5. Climate variability also impacted our sites. Lakeshore trees grew faster during 35
the Medieval Climate Anomaly whereas an early 1800's volcano-induced cold 36
episode coincided with a sharp reduction in tree growth and a peak in tree 37
mortality. 38
6. Synthesis: This study provides a long-term perspective that helps explain how 39
the present-day landscape diversity in the Eastern Canadian taiga reflects the site-40
specific fire history over the last millennium. Fires have caused persistent and 41
cumulative impacts resulting in a progressive opening of the forest cover along 42
with balsam fir exclusion. Present-day landscapes are mosaics of forest stands 43
characterized by different times since fire and different postfire forest structure 44
trajectories. 45
4
Key-words
46
Abies balsamea, boreal forest, dendrochronology, determinants of plant 47
community diversity and structure, fire ecology, paleoecology, Picea mariana, 48
plant–climate interactions, Quebec, successional trajectory 49
5
Introduction
50
Many ecosystems depend on or are well-adapted to the occurrence of 51
disturbances (Le Goff & Sirois 2004; Brunbjerg et al. 2012; Newbery et al. 2013). 52
However, disturbances may also produce long-term alterations of the natural 53
landscape (He et al. 2002; Vanderwel, Coomes & Purves 2013), as well as a 54
degradation in ecosystem functioning (Villnäs et al. 2013; Zwicke et al. 2013) or a 55
creation of divergent successional pathways (Folke et al. 2004; Johnstone et al. 56
2010; Harvey & Holzman 2013). Spatio-temporal variation in disturbance 57
frequency and severity is an agent of ecological diversity in several biomes 58
(Fraterrigo & Rusak 2008). 59
For example, the North American boreal forest is characterized by large and 60
frequent stand-replacing wildfires (Johnson 1992; Stocks et al. 2003) and is 61
dominated by even-aged communities of fire-adapted species such as black 62
spruce (Picea mariana (Mill.) B.S.P.) and jack pine (Pinus banksiana Lamb.) 63
(Johnson 1992; Sirois 1995). Although spruce and pine stands recover rapidly after 64
fire due to their serotinous cones (i.e. cones that remain closed and disperse seed 65
following a fire), tree density and forest composition vary according to several factors, 66
such as the magnitude of the pre-fire seed banks (Greene & Johnson 1999), the time 67
since the last fire (Morneau & Payette 1989), the severity of the fire (Arseneault 68
2001), and the duration of the fire-free interval preceding the last fire (Lavoie & Sirois 69
1998). In these environments, fire frequency and severity are the dominant drivers 70
of change in forest structure and composition at both the site and landscape levels, 71
6
and also determine ecosystem net primary production and the regional carbon 72
balance (Bond-Lamberty et al. 2007). 73
In Eastern Canada, these short-term (decadal to secular) fire effects have been 74
superimposed onto a longer-term, large-scale climate-induced decrease in conifer 75
stem density, which was also mediated by fire disturbance (Payette & Gagnon 76
1985). The boreal biome of the region is subdivided into three main latitudinal bands 77
from south to north: the closed-crown forest, the spruce-lichen woodland (hereafter 78
referred to as the taiga) and the forest tundra (Fig. 1; Saucier et al. 2003). In the 79
forest tundra zone, black spruce stands occur mostly in the lowlands, while upland 80
spruce stands systematically failed to recover and shifted to treeless ecosystems 81
after fire over the last 600-900 years, following the Medieval Climate Anomaly 82
(Payette & Gagnon 1985; Payette & Morneau 1993; Payette, Filion & Delwaide 83
2008). Many spruce-lichen woodland and dense forest stands also failed to recover 84
or shifted to more open woodlands after the fires of the 20th century in the closed-85
crown forest and the taiga zones (Sirois & Payette 1991; Lavoie & Sirois 1998; 86
Girard, Payette & Gagnon 2008; Boiffin & Munson 2013). This generalized fire-87
climate induced deforestation was accompanied by a decreasing occurrence of 88
fire-sensitive balsam fir (Abies balsamea (L.) Mill.) over the last millennia 89
(Arseneault & Sirois 2004; de Lafontaine & Payette 2010). Today, forest stands 90
with abundant fir are scattered in areas less affected by fire, frequently along streams 91
and lakeshores (Sirois 1997; Arseneault, Boucher & Bouchon 2007). It has been 92
hypothesized that these stands are remnants of a previously widespread closed-93
canopy spruce-fir vegetation zone, similar to that occurring further south, established 94
7
more than 5000 years ago when fires were less frequent due to a more humid climate 95
(Sirois 1997; Arseneault & Sirois 2004; Boucher, Arseneault & Hétu 2006; Ali et al. 96
2008; de Lafontaine & Payette 2010). 97
The taiga of Eastern Canada (Fig. 1), comprises a mosaic of spruce-lichen 98
woodlands of various postfire ages, stem densities and fir abundance, along with 99
numerous lakes and peatlands in concave landforms (Fig. S1 in Supporting 100
information). Deciphering how these spatially variable forest structures and 101
compositions reflect long-term fire and climate impacts is a difficult task due to the 102
lack of paleoecological records available to reconstruct millennial forest dynamics 103
with both high spatial and temporal resolutions. Dendrochronology can be used to 104
reconstruct forest dynamics at the stand level with an annual resolution, but such 105
reconstructions are limited to a few centuries because of fast decay of dead wood 106
(Bond-Lamberty & Gower 2008). Conversely, pollen and charcoal and plant 107
macroremains allow the reconstruction of long-term vegetation changes and fire 108
histories (e.g. Carcaillet et al. 2010; Payette et al. 2012; Senici et al. 2013), but 109
provide no direct information on past tree density or growth trends and the dating 110
of disturbances relies on radiocarbon methods that are less precise than 111
dendrochronology. Furthermore, contrary to fire impacts, pollen data are not stand-112
specific because of pollen mobility. 113
In this study, we first conducted a detailed inventory of the present-day lakeshore 114
forest structure and composition of 2.2 kilometres of shoreline situated along two 115
boreal lakes. Subsequently, we used dendrochronology to analyse the large stocks 116
of submerged subfossil logs that accumulated in the littoral zones facing these 117
8
same shores in order to reconstruct the millennial impacts of wildfires on lakeshore 118
forest stands. Our objective was to verify whether variations in the forest structure 119
and composition of the present-day lakeshore forest at each site can be attributed 120
to varying fire histories during the last millennium. Our hypotheses are that (i) there 121
is a negative correlation between past wildfire frequency and present-day tree 122
density and balsam fir abundance, and that (ii) impacts of past fires have been 123
spatially heterogeneous even within a given site and have persisted over several 124
centuries. 125
9
Materials and methods
126
Study sites and sampling 127
Two lakes, hereafter called L18 (54.25 N, 72.38 W) and L20 (54.56 N, 71.24 W), 128
were the object of this study. They are located at the interface between the taiga and 129
the forest tundra of Northern Quebec in Eastern Canada (Fig. 1). Black spruce is the 130
prevalent tree species and a mosaic of postfire spruce-lichen woodlands 131
characterizes the region (Fig. S1). Other less abundant tree species include balsam 132
fir and tamarack (Larix laricina (Du Roi) K. Koch). The regional burn rate is about 133
0.2% per year (Boulanger et al. 2012). The mean annual temperature is -3°C and the 134
average annual precipitation is 760 mm, of which 550 falls as rain (La Grande IV 135
weather station; 22 years of observations, Environment Canada 2014). The region is 136
located in the northern part of the balsam fir range and east of the jack pine range 137
limit. The easternmost jack pine stands are located about 10 kilometres westward of 138
L18. 139
The two sites are part of a network of lakes selected to study the stocks of subfossil 140
logs in boreal lakes and their fluxes across the forest-lake interface (Gennaretti, 141
Arseneault & Bégin 2014), as well as to develop a dendroclimatic reconstruction 142
of the summer temperatures of Eastern Canada over the last millennium 143
(Gennaretti et al. in press). The lakes were selected because they comprise a 144
littoral segment with abundant subfossil logs facing old-growth lakeshore forest 145
vegetation (i.e. time since last fire of about 300-400 years) on a well-drained glacial 146
deposit and on the lakeside protected from dominant winds. 147
10
To characterize the structure and composition of the present-day lakeshore forest 148
stands, we sampled 39 and 33 plots (10 x 10 m) spaced at 20 m intervals along 149
and adjacent to the selected shore segments at L18 and L20, respectively (Fig. 1). 150
Within each plot we recorded the diameter at breast height (DBH) by species 151
(spruce, fir or tamarack) of all living trees and snags ≥ 2 cm DBH. We also recorded 152
the maximum diameter of all stumps and coarse woody debris pieces on the forest 153
floor, excluding specimens with a maximum diameter < 4 cm. Snags were defined 154
as standing dead trees connected to their roots and taller than breast height, 155
stumps as dead trees connected to their roots and lower than breast height, and 156
coarse woody debris pieces as dead trees on the floor not connected to their roots. 157
The two or three tallest living trees (depending on species diversity) at each plot 158
were cored as close to the collar as possible using a Haglöf increment borer. In 159
the laboratory, tree-ring counting on the increment cores (No. = 165) allowed the 160
minimum time since the last stand-replacing fire at each plot to be determined (i.e. 161
maximum number of tree-rings per tree after applying a correction for coring 162
height). Seedlings and saplings (< 2 cm DBH) were counted within two subplots (1 163
x 10 m) perpendicular to the lakeshore, nested within and on the two opposite 164
edges of each main plot. 165
In the littoral zone facing the lakeshore segments, all subfossil logs with diameter 166
≥ 4 cm were sampled in the water or in the superficial sediments within 15-20 m 167
from the shores, using the method described by Arseneault et al. (2013). In total, 168
627 and 848 logs were sampled along 1170 and 990 m of shoreline at L18 and L20, 169
respectively. For each subfossil log, the sampling location was mapped with a total 170
11
station and a cross-section was collected at its maximum diameter for 171
dendrochronological analysis. In the lab, the tree species were identified using wood 172
anatomy characteristics (spruce, fir or tamarack) and tree-ring width measurements 173
and dendrochronological dating were performed with standard procedures as 174
described by Gennaretti, Arseneault & Bégin (2014). In total, 426 (all black spruce) 175
and 611 (595 black spruce and 16 balsam fir) logs could be crossdated over the last 176
~1400 years at L18 and L20, respectively. Whereas fir and spruce individuals could 177
be crossdated together, no master chronology could be developed for tamarack. 178
These subfossil logs have not been significantly redistributed along the littoral zone 179
after recruitment into the water as proven by the relatively high proportion of 180
specimens oriented perpendicularly to the shore with their base toward the forest and 181
by the contrasting recruitment patterns of logs between consecutive shore segments 182
with different fire histories (Gennaretti, Arseneault & Bégin 2014). Thus, the logs can 183
be used to reconstruct the long term dynamics of the facing forest stands (i.e. past 184
fire years, past fire impacts on tree mortality and regeneration and past changes in 185
stem density and spruce growth; see "Data analysis" below). However, these data 186
do not allow reconstructing past variations in species abundance within the lakeshore 187
forests because very few fir and no tamarack logs were crossdated (Fig. S2). This is 188
due to the fact that fir and tamarack are much less abundant than spruce stems in 189
the studied lakeshore forests, especially within the first line of tall dominant trees near 190
the shoreline, which can generate persistent subfossil samples with a sufficient 191
number of tree-rings for the crossdating procedure (Gennaretti, Arseneault & Bégin 192
2014). 193
12
Data analysis 194
The data used in this study (living plots and subfossil logs) and the analysis 195
workflow are summarized in Fig. S2. First, triplets of consecutive neighbouring 196
plots in the lakeshore forests were considered, so as to obtain 37 and 31 triplets 197
at L18 and L20, respectively (e.g. triplet 1 comprises plots 1, 2 and 3; triplet 2 198
comprises plots 2, 3 and 4, etc.). Using triplets allowed compiling data within larger 199
and more representative portions of the lakeshore forests and smoothing out the 200
background noise among plots. Several variables were then developed to 201
characterize the forest structure and composition of each triplet (Table 1). When 202
two variables were strongly correlated (r > 0.8 or < -0.8), one of them was excluded 203
from the subsequent analyses to limit redundancy (Tables S3 and S4). In this way, 204
"Nliv", "Ntot", "F%reg", "BAliv" and "a" were excluded for L18, while "Nliv", "Ntot", 205
"Nliv6", "BAliv" and "a" where excluded for L20. Correlation between "F%" and 206
"Ndead" was slightly higher than 0.8 at L18, but the two variables were retained as 207
their association is not straightforward. 208
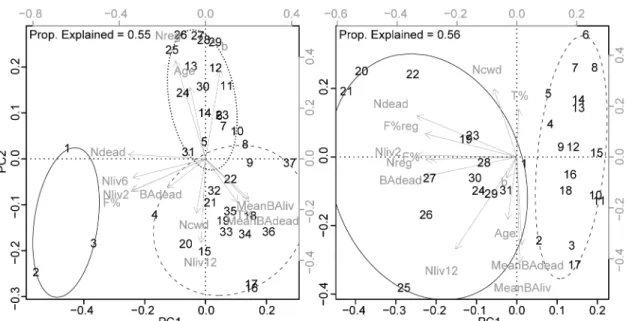
We performed a Principal Component Analysis (PCA) on the triplets of each lake 209
using our set of descriptive variables. All variables were scaled to unit variance. 210
Only principal components with eigenvalues > 1 were retained (Figs 2 and S3 to 211
S6). A hierarchical cluster analysis was subsequently used to detect associations 212
among triplets at each site based on a Euclidean distance matrix obtained from 213
the component scores scaled so as to have variance proportional to their 214
corresponding eigenvalues. Euclidean distance was chosen because it is 215
appropriate with quantitative descriptors and enhances differences among objects 216
13
by squaring (Legendre & Legendre 1998). Ward's method was applied in clustering 217
because it minimizes variance intra-clusters and maximizes variance inter-218
clusters. Homogeneous clusters of triplets were then defined for each lake by 219
cutting dendrograms at distance two (Figs S7 and S8). Sensitivity of clustering 220
results to the choice of the method is evaluated in Table S5. Each lakeshore forest 221
plot was finally considered as a part of a cluster if the majority of the triplets in 222
which it was included belonged to that cluster. Two plots (one per lake) could not 223
be assigned to any cluster because their corresponding triplets were equally 224
distributed amongst more than one cluster (Fig. 1). 225
Crossdated spruce and fir logs were subsequently assigned to the nearest 226
lakeshore plot and then to the corresponding cluster. To limit data fragmentation 227
along the shoreline, logs assigned to a series of less than three contiguous plots 228
belonging to the same cluster were discarded from the subsequent analyses (i.e. 229
logs facing plots 9 and 10 at L18, and those facing plot 1 at L20; Fig. 1). Cluster 3 230
at L18 was also divided into two sub-clusters for the analysis of the subfossil logs 231
as, even if today the lakeshore plots are characterized by a similar forest, their 232
histories showed some differences (cluster 3A contains logs assigned to plots 6-8 233
and 11-15, while cluster 3B contains those assigned to plots 24-32; see Figs 1 and 234
3). 235
Tree-ring dating of charred subfossil logs (see Fig. S9 for some examples), along 236
with concurrent variations of log abundance, allowed us to determine when 237
wildfires affected the lakeshore forest of each cluster during the last millennium. 238
Each identified fire was assigned to the date of its most recent evidence 239
14
considering that some subfossil logs may have lost their charred marks and may 240
have been more or less eroded. Fire evidences are the outermost tree-ring dates 241
of charred logs or of subfossil logs in proximity of a charred specimen and 242
preceding a clear discontinuity in the temporal sequence of outermost tree-ring 243
dates. A detailed analysis of more than 1600 logs from five lakes indicates that our 244
estimated fire dates may precede the actual dates by a few years because an 245
average of three outermost tree-rings per century is lost through decay per log 246
(Gennaretti, Arseneault & Bégin 2014). The relative severity of the detected 247
wildfires was evaluated from their impacts on the number of subfossil logs 248
produced by the lakeshore forest and preserved in the adjacent littoral zone. A 249
typical response to fire includes a peak in subfossil log recruitment (this peak may 250
be attenuated if several killed trees on the shore decompose in an upright position), 251
followed by a recruitment reduction as trees grown up after fire have to reach a 252
minimum height before being available to generate subfossil logs from their upper 253
stem portions (Gennaretti, Arseneault & Bégin 2014). Here, a complete interruption 254
or a strong reduction of log recruitment for several years after a fire were used as 255
an indicator that most of the trees were killed and that the stand developed as an 256
even-aged postfire cohort. 257
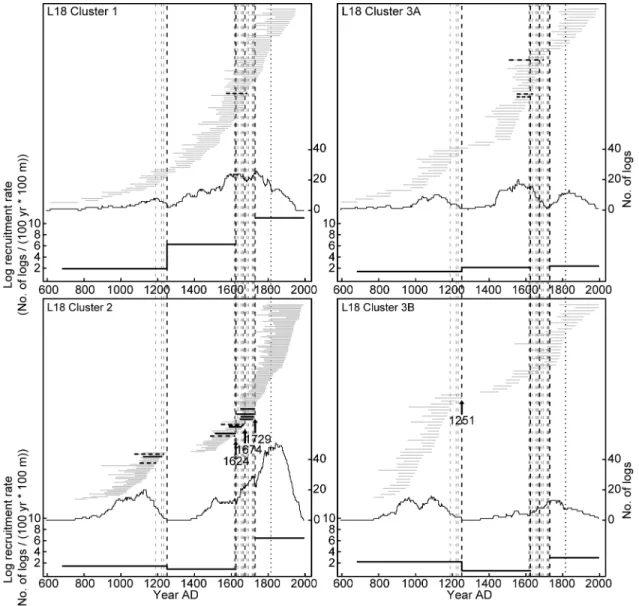
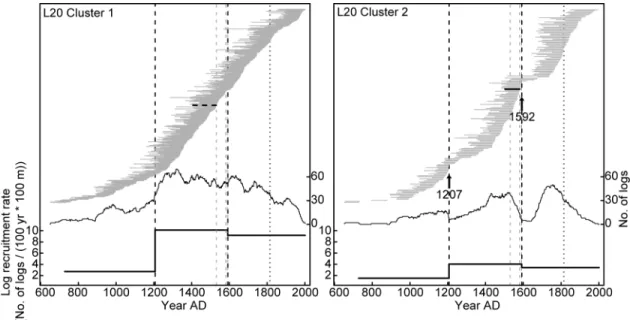
The subfossil records of both sites were divided into discrete fire-free intervals 258
delineated by the estimated wildfire dates. Three fire-free intervals were identified 259
at both sites: AD 682-1251, 1251-1624 and 1729-1994 at L18, and 728-1207, 260
1207-1592 and 1592-2002 at L20. The recruitment rates of subfossil logs (number 261
recruited per 100 years per 100 m of shoreline based on their outermost tree-ring 262
15
dates) were computed for each of these intervals in order to compare the relative 263
openness of the lakeshore forest cover between clusters at each site (Figs 3 and 264
4). Assuming that the number of subfossil logs produced by the lakeshore forest 265
in a cluster is directly related to the density of large trees during a fire-free interval, 266
which in turn depends on the pathway of forest recovery following the last fire, 267
regular and high recruitment rates were attributed to a dense mature forest cover 268
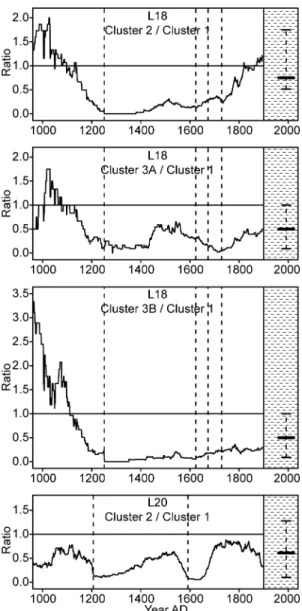
and low rates to an open cover. However, because subfossil logs progressively 269
decay, these recruitment rates fade out when moving backward in time and cannot 270
be compared among different fire-free intervals. To allow this comparison, we used 271
the presence at each site of a cluster that has escaped severe fires over the entire 272
study period (see results). For each site, we standardized the number of subfossil 273
logs that were living each year per 100 m of shoreline in each fire-affected cluster 274
by dividing it with the number of logs in the cluster that had escaped severe fires. 275
These ratios show the relative openness of the lakeshore forest cover among fire-276
free intervals and clusters (Fig. 5). 277
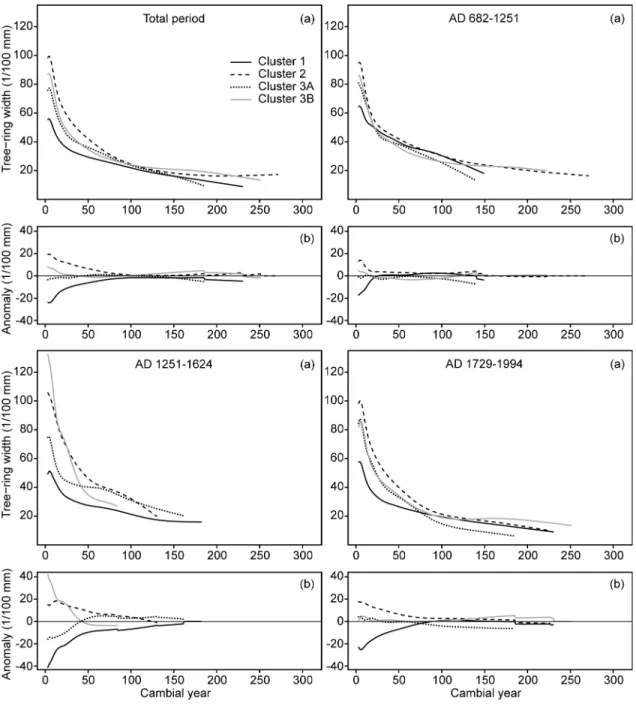
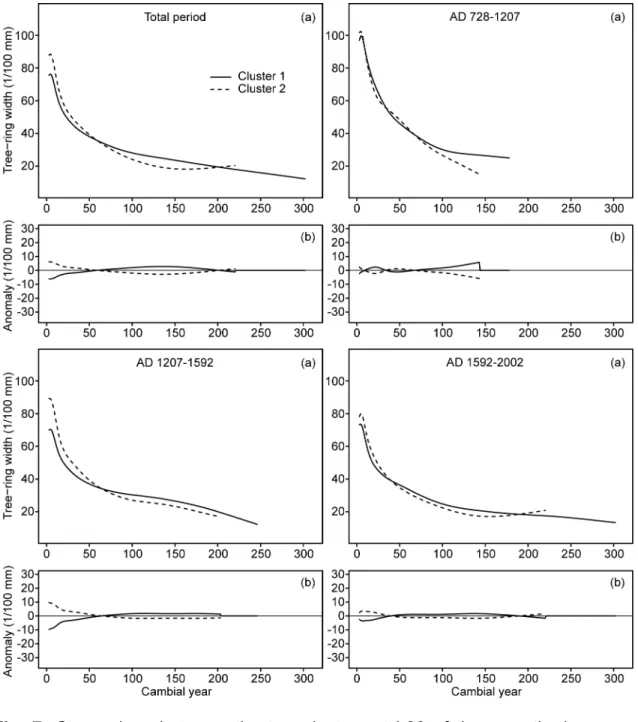
The smoothed average age-related growth curves of the black spruce subfossil 278
logs recruited during different fire-free intervals were compared among clusters 279
and fire-free intervals at each lake. For each interval and cluster, all individual ring 280
width series were aligned according to cambial age and averaged. Firs (16 logs at 281
L20) and specimens with missing pith (seven and 14 logs at L18 and L20, 282
respectively) were discarded. A spline with a 50% frequency cut-off and time-283
varying response (starting from 10 years and increasing by one each year; Melvin 284
et al. 2007) was then used as smoothing algorithm to generate the smoothed 285
16
growth curves. These growth curves allowed us to detect the most important 286
temporal and spatial shifts of lakeshore forest growth in response to disturbances 287
and climate change (Figs 6, 7, S10 and S11). 288
17
Results
289
Partitioning of the present-day forest 290
Principal component and cluster analyses identified three and two clusters of 291
homogeneous lakeshore forest stands at L18 and L20, respectively (Figs 1 and 2). 292
At L18, the first principal component (31% of the variance explained) differentiated 293
cluster 1 from clusters 2 and 3, based on its higher percentages of fir, higher 294
densities of snags and stumps, and higher densities of living trees, especially of 295
small size classes (Figs 2 and S3 and Table 2). The second principal component 296
(24% of the variance explained) differentiated cluster 3 from clusters 1 and 2, 297
based on its lower densities of large-sized trees (≥ 12 cm DBH) and higher 298
densities of saplings and seedlings that together influenced the coefficient "b" of 299
the power function models (Figs 2 and S3 and Table 2). Compared to cluster 1 300
and 3, cluster 2 displayed intermediate characteristics and lower densities of 301
saplings and seedlings. At L20, the two clusters differed mainly by their first 302
principal component scores (35% of the variance explained). In comparison to 303
cluster 2, cluster 1 was associated with higher fir percentages, higher basal areas 304
of dead trees and higher densities of regeneration, dead trees and living trees ≥ 2 305
cm DBH (Figs 2 and S4 and Table 2). 306
Past fires, subfossil recruitment and lakeshore tree density 307
At least four wildfires of varying severities affected the lakeshore forest at L18 308
during the last millennium (Fig. 3). Cluster 1, which is today characterized by 309
denser forest with more abundant fir, was clearly less severely affected by these 310
18
wildfires than clusters 2 and 3, and escaped stand-replacing fires over at least the 311
last 1200 years. A fire event completely interrupted the recruitment of subfossil 312
logs in clusters 2 and 3B and strongly reduced the recruitment in cluster 3A at AD 313
1251, indicating severe tree mortality in the lakeshore environment. The fire may 314
have partially burned the forest of cluster 1, where the recruitment of subfossil logs 315
slightly decreased, but several individuals survived. Because fires generally 316
reduce the recruitment of subfossil logs for about 120 years in these boreal lakes 317
(Gennaretti, Arseneault & Bégin 2014), the interruption/reduction that lasted for at 318
least 200 years at clusters 2 and 3 after the AD 1251 event suggests the 319
occurrence of a second fire before about AD 1400. This presumed fire most likely 320
killed trees established after AD 1251 before they could become tall enough to 321
generate subfossil logs with diameters ≥ 4 cm. Three subsequent closely spaced 322
fires burned across the lakeshore forest of clusters 2 and 3 during the 17th and the 323
first part of the 18th century. The AD 1624 fire was identified from charred subfossil 324
logs preceding a discontinuity in the temporal sequence of innermost tree-ring 325
dates (i.e. several lakeshore trees established after this fire), while the AD 1674 326
and 1729 fires were identified from charred subfossil logs and discontinuities in the 327
sequence of outermost tree-ring dates (i.e. a break and a sudden increase in log 328
recruitment indicating that several lakeshore trees died during these fires; see 329
cluster 2 in Fig. 3). All these wildfires were less severe than the AD 1251 fire, as 330
the recruitment of subfossil logs was altered but not interrupted. Despite the fact 331
that a charred log with an outermost tree-ring in 1684 was found at the boundary 332
between clusters 1 and 2, the recruitment of subfossil logs remained high and 333
19
constant in cluster 1, indicating uninterrupted forest development and negligible 334
fire impact. 335
Although all clusters at L18 exhibited similar recruitment rates of subfossil logs 336
prior to the AD 1251 fire, cluster 1, which escaped severe fire disturbances during 337
the last millennium, has been subsequently characterized by much higher and 338
constant rates of recruitment of subfossil logs than clusters 2 and 3 (Fig. 3). This 339
suggests that the density of lakeshore trees was similar among clusters before AD 340
1251 and that the fires produced a long-lasting decrease of stem density at clusters 341
2 and 3. These two clusters seem to have diverged from each other following the 342
fires of the 17th and 18th centuries because cluster 2 has exhibited higher 343
recruitment rates than cluster 3 since the mid 18th century (6.5 vs 2.4 to 2.9 logs 344
per 100 years per 100 meter of shoreline). These higher rates are consistent with 345
the higher present-day density of large-sized trees (≥ 12 cm DBH) in the lakeshore 346
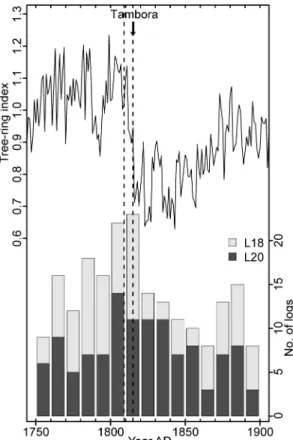
plots of cluster 2 as compared to cluster 3 (Table 2). At L18, an important pulse 347
followed by a reduction of subfossil log recruitment is also coincident with the large 348
Tambora volcanic eruption in AD 1815 (Figs 3 and 8). 349
Fires were less frequent at L20 than at L18, as we detected only two fire events 350
over the last millennium (Fig. 4). The only fire confirmed by charred marks on the 351
logs occurred at AD 1592 and almost completely burned the lakeshore forest of 352
cluster 2, as based on a severe reduction of subfossil log recruitment. The fire 353
probably stopped near plot 20, at the border between clusters 1 and 2, where we 354
found a charred subfossil log. The remaining plots of cluster 1 escaped the fire, as 355
indicated by the very regular and high recruitment rates of subfossil logs. A peak 356
20
of tree mortality in cluster 2 most likely indicates a previous moderate severity fire 357
at about AD 1207, even if no charred log was discovered. 358
Similarly to L18, dense present-day forest stands with high fir percentages at L20 359
have escaped stand-replacing fires over the last millennium (over at least the last 360
1400 years at cluster 1 of L20). Recruitment rates of subfossil logs have always 361
been higher at cluster 1 than at cluster 2, denoting that stem density has probably 362
been higher at cluster 1 over the entire time period covered by our study (Fig. 4). 363
The yearly ratios of subfossil log abundance in burned relative to unburned clusters 364
at each lake indicate that each fire triggered a specific trajectory of stem density in 365
the burned lakeshore clusters with varying postfire density alterations and rates of 366
recovery (Fig. 5). These effects included prompt and complete recovery to pre-fire 367
stem density (e.g. cluster 2 at L20 after the AD 1592 fire), full but progressive 368
recovery over several centuries (e.g. cluster 2 at L20 after the AD 1207 fire), 369
extremely slow and partial recovery (e.g. clusters 2 and 3A at L18 following the 370
two successive AD 1251 and ~1400 fires), persistent shift to low stem densities 371
(e.g. cluster 3B at L18 following the two successive AD 1251 and ~1400 fires), as 372
well as increased stem densities relative to pre-fire conditions (e.g. cluster 2 at L18 373
after the three fires between AD 1624 and 1729). 374
Age-related growth curves of the subfossil logs 375
The analysis of the average growth curves of the subfossil logs showed important 376
climate- and fire-induced impacts on the lakeshore forest growth during the last 377
millennium. Fires reduced lakeshore stem density and, as a consequence, the 378
21
juvenile growth of trees (i.e. for young cambial ages) was faster in the burned 379
lakeshore clusters than in the unburned ones (i.e. cluster 1 at both sites) during 380
the subsequent fire-free intervals (see the juvenile growth of the subfossil logs of 381
clusters 2 or 3 in comparison to that of logs of cluster 1 in Figs 6 and 7). 382
Furthermore, the average growth curves showed that, in clusters that escaped 383
severe fire disturbances over the entire time period covered by the study (i.e. 384
cluster 1 at both sites), trees grew faster during Medieval times than afterward, 385
suggesting the influence of a warmer climate (Figs S10 and S11). 386
22
Discussion
387
Fire vs. trajectories of forest structure and composition 388
The long-term perspective, along with the high spatial and temporal resolutions 389
provided by this study, allowed the verification of whether or not variations in the 390
present-day structure and composition of contiguous lakeshore forest stands in the 391
Eastern Canadian taiga correspond to their respective fire histories during the last 392
millennium. Our multivariate analysis of the current lakeshore forest vegetation 393
revealed three and two homogeneous clusters with different forest compositions 394
and structures at L18 and L20, respectively, even if these forests only face 1170 395
and 990 m of shore (Figs 1 and 2 and Table 2). The dendrochronological analysis 396
of the subfossil logs collected in the littoral zone facing these clusters confirmed 397
that they experienced site-specific fire histories over the last millennium that locally 398
influenced tree density and tree growth (Figs 3 to 7), thus shaping the present-day 399
landscape diversity. Unfortunately, our results do not allow reconstructing past 400
variations in species abundance within the studied lakeshore forests (see "Study 401
sites and sampling"). However, all the lakeshore segments that were affected by 402
fire during the last millennium are today characterized by more open forests with 403
less dead wood and lower percentages of balsam fir than the unburned stands 404
(Table 2), even despite the most recent fire occurring about 300 to 400 years ago. 405
Consequently, our results support the hypothesis that fire impacts may persist for 406
several centuries in the Eastern Canadian taiga and that present-day landscapes 407
are the outcome of the progressive fire-induced breakup (i.e. forest cover opening 408
and balsam fir exclusion) of a previously closed-crown spruce-fir vegetation zone 409
23
(Sirois 1997; Arseneault & Sirois 2004; Ali et al. 2008; de Lafontaine & Payette 410
2010). 411
An important result of this study is the large variability in the postfire forest structure 412
trajectories in the lakeshore environment over the last millennium. Although it is 413
generally assumed that black spruce is a fire-adapted species due to its serotinous 414
cones, our results suggest that the classical model of postfire forest recovery in 415
black spruce forests (i.e. fast recovery to pre-fire stem densities) is over-simplistic 416
because each fire can trigger a specific forest structure trajectory characterized by 417
a different stem density reduction and a different rate of recovery. Despite the fact 418
that an increase in stem density relative to pre-fire conditions occurred at cluster 2 419
of L18 following the three low to moderate severity fires between AD 1624 and 420
1729, all other fires decreased stem densities or maintained the low densities 421
triggered by previous fires and the rates of recovery were extremely variable (Fig. 422
5). All time periods of fire-induced low stem densities reconstructed from low 423
recruitment rates of subfossil logs (i.e. AD 1207-1592 at cluster 2 of L20 and AD 424
1251-1994 at clusters 2 and 3 of L18) are confirmed by concomitant faster juvenile 425
growth of spruce trees in burned clusters (Figs 6 and 7). Indeed, black spruce 426
grows faster in open postfire woodlands than in dense postfire or old-growth 427
forests stands due to less intense competition (Fourrier, Pothier & Bouchard 2013). 428
Although we could not identify the processes that have influenced the variability of 429
the postfire forest trajectories, several circumstances may have contributed to 430
hamper rapid postfire recovery to pre-fire stem densities, especially in the taiga 431
context where severe climate conditions may limit spruce growth and reproduction 432
24
and may lead to significant tree mortality events (Bond-Lamberty et al. 2014). For 433
example, high fire severity and a short time interval between the severe AD 1251 434
fire and the subsequent supposed fire prior to AD 1400 may explain the low stem 435
densities that have characterized the last 750 years in the clusters 2 and 3 of L18 436
(Fig. 5). Unfavourable conditions for seed maturation during the Little Ice Age may 437
also have contributed to these low postfire tree densities. Once such open stands 438
are initiated due to insufficient postfire regeneration, tree density is likely to remain 439
low until at least the next fire because a continuous lichen mat subsequently 440
develops at the soil surface and inhibits seedling establishment (Morneau & 441
Payette 1989). 442
Contrary to black spruce, balsam fir does not retain its seeds in serotinous cones 443
and thus must re-establish from fire survivors outside burned areas (Asselin, Fortin 444
& Bergeron 2001). Consequently, balsam fir abundance and dominance increase 445
with decreasing fire recurrence across its distribution range. Paleoecological 446
studies have already suggested that balsam fir migrated northward more than 447
5000 years ago under the low-frequency fire regime of the mid-Holocene 448
(Carcaillet & Richard 2000) and that an increased fire frequency subsequently 449
reduced its abundance in the taiga of Eastern Canada (Sirois 1997; Arseneault & 450
Sirois 2004; Boucher, Arseneault & Hétu 2006; Ali et al. 2008; de Lafontaine & 451
Payette 2010). Indeed, subfossil trunks buried in peat and alluvial deposits revealed 452
that balsam fir occurred much more frequently prior to 4000 BP than afterward (Sirois 453
1997; Arseneault & Sirois 2004; Boucher, Arseneault & Hétu 2006). Our results did 454
not allow the reconstruction of past variations in fir abundance from direct field 455
25
evidence because very few firs were found among the subfossil logs (see "Study 456
sites and sampling" and Fig. S2). However, at both of our study sites, all lakeshore 457
clusters that experienced at least one severe fire exhibited low fir percentages (0-458
8%) and all clusters with abundant fir (i.e. more than 20%; Table 2) had escaped 459
fire or were only marginally affected by fire over remarkably long time intervals of 460
more than 1200 years (Figs 3 and 4). This exclusive and systematic high fir 461
abundance in the present-day unburned forest remnants strongly supports the idea 462
that balsam fir is out of phase with the late Holocene fire regime and the associated 463
climate and that fir has persisted mainly in unburned refugia. 464
Climate change impacts 465
Despite the fact that fire disturbance has been the dominant driver of change in 466
forest stem density and growth over the past millennium, climate variability was 467
also important. Recent climate reconstructions indicate that a well-defined 468
Medieval Climate Anomaly occurred at about AD 900-1250 in the North American 469
taiga and forest tundra, followed by a progressive decrease of summer 470
temperatures down to the coldest period of the last millennium, which occurred 471
during the first half of the 19th century (Viau, Ladd & Gajewski 2012; Pages 2k 472
Consortium 2013). A reconstruction of summer temperatures from tree-ring widths 473
of more than 1700 subfossil logs collected in six lakes of our study area, including 474
L18 and L20 (Gennaretti et al. in press), closely reproduces these trends, also 475
indicating that the cold period of the early 1800's was triggered by the successive 476
AD 1809 (unknown volcano) and AD 1815 (Tambora) volcanic eruptions (see also 477
Fig. 8). Both of these opposed climate anomalies influenced forest dynamics at 478
26
our study sites. At the unburned clusters (i.e. cluster 1), where age-related growth 479
trends have not been disturbed by fire events and consequent changes in forest 480
density, spruce trees grew faster during the Medieval Anomaly than afterward, 481
reflecting its warmer climate (Figs S10 and S11). This period was also 482
characterized by relatively high stem density at all clusters of both sites (Fig. 5). 483
However, our data do not allow the differentiation of the role of the warmer climate 484
or of the possible absence of previous fire disturbances on these high stem 485
densities for this older period. At the other extreme of the climatic gradient, the 486
precise correspondence between the AD 1809-1815 eruptions, a sharp tree growth 487
reduction, and a peak in lakeshore tree mortality at our sites (Fig. 8), confirms that 488
volcanoes forced this cold episode and influenced forest dynamics. At L18, this 489
episode of tree mortality was less severe in cluster 2 than in clusters 1 and 3 (Fig. 490
3), possibly reflecting its more sheltered position along concave lakeshore 491
segments (Fig. 1). At L18, the subsequent decrease of subfossil log recruitment 492
over the 1820-1870 time period also suggests that, at this site, the most vulnerable 493
lakeshore trees died rapidly in less than about 10 years after the two eruptions, 494
thus attenuating later mortality (Fig. 8). 495
Long-term fire imprints on landscape diversity 496
Our study provides a long-term perspective that helps explain how fire disturbance 497
and time since fire have shaped the present-day landscape diversity in the Eastern 498
Canadian taiga, in the context of the generalized decrease in conifer stem density 499
that has characterized the northern boreal zone over the last 600-900 years (Payette 500
& Gagnon 1985; Sirois & Payette 1991; Payette & Morneau 1993; Lavoie & Sirois 501
27
1998; Girard, Payette & Gagnon 2008; Payette, Filion & Delwaide 2008). The high 502
variability in the postfire stem density reduction and in its rate of recovery displayed 503
by our lakeshore clusters since the first detected fire at about AD 1207 (Fig. 5) 504
suggests that present-day landscapes (see Fig. S1) are mosaics of forest patches 505
representing different times since fire along specific postfire forest structure 506
trajectories. In the taiga, open woodlands would have experienced at least one 507
severe fire since the Medieval Climate Anomaly, often reducing tree densities or 508
maintaining low densities triggered by previous fires and excluding balsam fir from 509
stands where the species was still present. In addition some important implications 510
can be deduced from the fact that present-day forest stands reflect the past fire 511
history even if the last fire occurred at least 300-400 years ago. First, it indicates that 512
several centuries are needed for stem density and forest composition to converge 513
between forest stands that experienced or escaped fire. Second, it proves that the 514
taiga contains two types of old-growth forest stands (i.e. some centuries old) on well-515
drained soils (dense vs open old-growth forest stands) depending on whether or not 516
they burned during the last 800 years. 517
It has already been observed that the long-term absence of severe disturbances 518
can lead to the decline of forest ecosystems and to the reduction of forest biomass 519
in several biomes (Wardle, Walker & Bardgett 2004). In this study, we observed 520
rather that sites that did not severely burn during the last 1200 years had higher 521
stem density, tree basal area and tree species diversity than sites that burned 2-5 522
times over the same time period. Even if these dense stands are relict from 523
previous more favourable climate conditions, they nevertheless indicate that 524
28
relatively high stem densities can be maintained over at least a millennium in 525
absence of fire. Extrapolating the recent regional burn rate of about 0.2% per year 526
(based on the 1980-2010 fire data; Boulanger et al. 2012) to the last millennium, 527
and assuming that stand age distribution is negative exponential (Johnson 1992), 528
stands older than 1000 years would represent only about 15% of the present-day 529
landscape. We conclude that the forest decline stage linked to the absence of 530
disturbances is uncommon in the northern taiga of Eastern Canada. 531
The increase in fire occurrence and area burned that is expected for the Eastern 532
Canadian taiga over the 21st century (Boulanger et al. 2013) is likely to impact 533
landscape diversity in our study area. Our data suggest that higher burn rates will 534
accelerate the regression of balsam fir and will increase the abundance of more 535
open woodlands, unless climactic thresholds that once allowed the development 536
of dense spruce-fir stands are surpassed, improving the forest regeneration 537
processes (Sirois, Bonan & Shugart 1994). In addition, considering that the jack 538
pine eastern range limit is located only 10 km west of site L18, and that pine has 539
faster juvenile growth, earlier sexual maturity, and higher seed retention in 540
serotinous cones than black spruce (Rudolph & Laidly 1990), jack pine is likely to 541
expand into our study region with an increased fire frequency. If a pine expansion 542
occurs, then open spruce woodlands will be likely shift to denser pine-spruce 543
stands after fire with pine abundance increasing after repeated fires, as observed 544
within the current pine range limit (Lavoie & Sirois 1998; Le Goff & Sirois 2004). 545
29
Acknowledgments
546
The authors wish to thank Julia Autin, Yves Bouthillier, Pierre-Paul Dion, Sébastien 547
Dupuis, Benjamin Dy, Joëlle Marion and Antoine Nicault for field and laboratory 548
assistance, Aurore Catalan for technical assistance, and Luc Sirois and two 549
referees for their constructive comments on the paper. This research is a 550
contribution of the ARCHIVES project and was financially supported by NSERC, 551
Hydro-Quebec, Ouranos, ArcticNet, the EnviroNorth training program and the 552
Centre for Northern Studies. 553
30
Data Accessibility
554
All data from the manuscript will be archived in "Figshare" (the DOI is still to be 555
obtained). 556
31
References
557
Ali, A. A., Asselin, H., Larouche, A. C., Bergeron, Y., Carcaillet, C. & Richard, P. J. 558
H. (2008) Changes in fire regime explain the Holocene rise and fall of Abies 559
balsamea in the coniferous forests of western Québec, Canada. Holocene, 560
18, 693-703.
561
Arseneault, D. (2001) Impact of fire behavior on postfire forest development in a 562
homogeneous boreal landscape. Canadian Journal of Forest Research, 31, 563
1367-1374. 564
Arseneault, D., Boucher, E. & Bouchon, E. (2007) Asynchronous forest-stream 565
coupling in a fire-prone boreal landscape: insights from woody debris. 566
Journal of Ecology, 95, 789-801. 567
Arseneault, D., Dy, B., Gennaretti, F., Autin, J. & Bégin, Y. (2013) Developing 568
millennial tree ring chronologies in the fire-prone North American boreal 569
forest. Journal of Quaternary Science, 28, 283-292. 570
Arseneault, D. & Sirois, L. (2004) The millennial dynamics of a boreal forest stand 571
from buried trees. Journal of Ecology, 92, 490-504. 572
Asselin, H., Fortin, M. J. & Bergeron, Y. (2001) Spatial distribution of late-573
successional coniferous species regeneration following disturbance in 574
southwestern Québec boreal forest. Forest Ecology and Management, 140, 575
29-37. 576
32
Boiffin, J. & Munson, A. D. (2013) Three large fire years threaten resilience of 577
closed crown black spruce forests in eastern Canada. Ecosphere, 4, art56. 578
Bond-Lamberty, B. & Gower, S. T. (2008) Decomposition and fragmentation of 579
coarse woody debris: Re-visiting a boreal black spruce chronosequence. 580
Ecosystems, 11, 831-840. 581
Bond-Lamberty, B., Peckham, S. D., Ahl, D. E. & Gower, S. T. (2007) Fire as the 582
dominant driver of central Canadian boreal forest carbon balance. Nature, 583
450, 89-92.
584
Bond-Lamberty, B., Rocha, A. V., Calvin, K., Holmes, B., Wang, C. & Goulden, M. 585
L. (2014) Disturbance legacies and climate jointly drive tree growth and 586
mortality in an intensively studied boreal forest. Global Change Biology, 20, 587
216-227. 588
Boucher, É., Arseneault, D. & Hétu, B. (2006) Late Holocene development of a 589
floodplain along a small meandering stream, northern Québec, Canada. 590
Geomorphology, 80, 267-281. 591
Boulanger, Y., Gauthier, S., Burton, P. J. & Vaillancourt, M. A. (2012) An 592
alternative fire regime zonation for Canada. International Journal of 593
Wildland Fire, 21, 1052-1064. 594
Boulanger, Y., Gauthier, S., Gray, D. R., Le Goff, H., Lefort, P. & Morissette, J. 595
(2013) Fire regime zonation under current and future climate over eastern 596
Canada. Ecological Applications, 23, 904-923. 597
33
Brunbjerg, A. K., Borchsenius, F., Eiserhardt, W. L., Ejrnæs, R. & Svenning, J. C. 598
(2012) Disturbance drives phylogenetic community structure in coastal 599
dune vegetation. Journal of Vegetation Science, 23, 1082-1094. 600
Carcaillet, C. & Richard, P. J. H. (2000) Holocene changes in seasonal 601
precipitation highlighted by fire incidence in eastern Canada. Climate 602
Dynamics, 16, 549-559. 603
Carcaillet, C., Richard, P. J. H., Bergeron, Y., Fŕchette, B. & Ali, A. A. (2010) 604
Resilience of the boreal forest in response to Holocene fire-frequency 605
changes assessed by pollen diversity and population dynamics. 606
International Journal of Wildland Fire, 19, 1026-1039. 607
de Lafontaine, G. & Payette, S. (2010) The Origin and Dynamics of Subalpine 608
White Spruce and Balsam Fir Stands in Boreal Eastern North America. 609
Ecosystems, 13, 932-947. 610
Esper, J., Cook, E. R., Krusic, P. J., Peters, K. & Schweingruber, F. H. (2003) 611
Tests of the RCS method for preserving low-frequency variability in long 612
tree-ring chronologies. Tree-ring research, 59, 81-98. 613
Folke, C., Carpenter, S., Walker, B., Scheffer, M., Elmqvist, T., Gunderson, L. & 614
Holling, C. S. (2004) Regime shifts, resilience, and biodiversity in ecosystem 615
management. Annual Review of Ecology, Evolution, and Systematics, 35, 616
557-581. 617
34
Fourrier, A., Pothier, D. & Bouchard, M. (2013) A comparative study of long-term 618
stand growth in eastern Canadian boreal forest: Fire versus clear-cut. 619
Forest Ecology and Management, 310, 10-18. 620
Fraterrigo, J. M. & Rusak, J. A. (2008) Disturbance-driven changes in the variability 621
of ecological patterns and processes. Ecology Letters, 11, 756-770. 622
Gennaretti, F., Arseneault, D. & Bégin, Y. (2014) Millennial stocks and fluxes of 623
large woody debris in lakes of the North American taiga. Journal of Ecology, 624
102, 367–380.
625
Gennaretti, F., Arseneault, D. Nicault, A. Perreault, L. & Bégin, Y. (in press) 626
Volcano-induced regime shifts in millennial tree ring chronologies from 627
northeastern North America. Proceedings of the National Academy of 628
Sciences of the USA. 629
Girard, F., Payette, S. & Gagnon, R. (2008) Rapid expansion of lichen woodlands 630
within the closed-crown boreal forest zone over the last 50 years caused by 631
stand disturbances in eastern Canada. Journal of Biogeography, 35, 529-632
537. 633
Greene, D. F. & Johnson, E. A. (1999) Modelling recruitment of Populus 634
tremuloides, Pinus banksiana, and Picea mariana following fire in the 635
mixedwood boreal forest. Canadian Journal of Forest Research, 29, 462-636
473. 637
35
Harvey, B. J. & Holzman, B. A. (2014) Divergent successional pathways of stand 638
development following fire in a California closed-cone pine forest. Journal 639
of Vegetation Science, 25, 88-99. 640
He, H. S., Hao, Z., Larsen, D. R., Dai, L., Hu, Y. & Chang, Y. (2002) A simulation 641
study of landscape scale forest succession in northeastern China. 642
Ecological Modelling, 156, 153-166. 643
Johnson, E. A. (1992) Fire and vegetation dynamics: studies from the North 644
American boreal forest. Cambridge University Press; Cambridge Studies in 645
Ecology. 646
Johnstone, J. F., Hollingsworth, T. N., Chapin, F. S. & Mack, M. C. (2010) Changes 647
in fire regime break the legacy lock on successional trajectories in Alaskan 648
boreal forest. Global Change Biology, 16, 1281-1295. 649
Lavoie, L. & Sirois, L. (1998) Vegetation Changes Caused by Recent Fires in the 650
Northern Boreal Forest of Eastern Canada. Journal of Vegetation Science, 651
9, 483-492.
652
Legendre, P. & Legendre, L. (1998) Numerical Ecology. Elsevier, Amsterdam. 653
Le Goff, H. & Sirois, L. (2004) Black spruce and jack pine dynamics simulated 654
under varying fire cycles in the northern boreal forest of Quebec, Canada. 655
Canadian Journal of Forest Research, 34, 2399-2409. 656
36
Melvin, T. M., Brifffa, K. R., Nicolussi, K. & Grabner, M. (2007) Time-varying-657
response smoothing. Dendrochronologia, 25, 65-69. 658
Morneau, C. & Payette, S. (1989) Postfire lichen-spruce woodland recovery at the 659
limit of the boreal forest in northern Quebec. Canadian Journal of Botany, 660
67, 2770-2782.
661
Newbery, D. M., Van Der Burgt, X. M., Worbes, M. & Chuyong, G. B. (2013) 662
Transient dominance in a central african rain forest. Ecological 663
Monographs, 83, 339-382. 664
Pages 2k Consortium (2013) Continental-scale temperature variability during the 665
past two millennia. Nature Geoscience, 6, 339-346. 666
Payette, S., Delwaide, A., Schaffhauser, A. & Magnan, G. (2012) Calculating long-667
term fire frequency at the stand scale from charcoal data. Ecosphere, 3, 668
art59. 669
Payette, S., Filion, L. & Delwaide, A. (2008) Spatially explicit fire-climate history of 670
the boreal forest-tundra (Eastern Canada) over the last 2000 years. 671
Philosophical Transactions of the Royal Society B: Biological Sciences, 672
363, 2301-2316.
673
Payette, S. & Gagnon, R. (1985) Late Holocene deforestation and tree 674
regeneration in the forest-tundra of Québec. Nature, 313, 570-572. 675
37
Payette, S. & Morneau, C. (1993) Holocene Relict Woodlands at the Eastern 676
Canadian Treeline. Quaternary Research, 39, 84-89. 677
Rudolph, T. D. & Laidly, P. R. (1990) Pinus banksiana Lamb. Silvics of North 678
America: 1. Conifers; 2. Hardwoods. Agriculture Handbook 654. (eds R. M. 679
Burns & B. H. Honkala), pp. 555-586. U.S. Department of Agriculture, Forest 680
Service, Washington, DC. 681
Saucier, J.-P., Grondin, P., Robitaille, A. & Bergeron, J.-F. (2003) Zones de 682
végétation et domaines bioclimatiques du Québec. Gouvernement du 683
Québec, Ministère des Ressources naturelles, de la Faune et des Parcs, 684
Québec. 685
Senici, D., Lucas, A., Chen, H. Y. H., Bergeron, Y., Larouche, A., Brossier, B., 686
Blarquez, O. & Ali, A. A. (2013) Multi-millennial fire frequency and tree 687
abundance differ between xeric and mesic boreal forests in central Canada. 688
Journal of Ecology, 101, 356-367. 689
Sirois, L. (1995) Initial phase of postfire forest regeneration in two lichen 690
woodlands of northern Quebec. Ecoscience, 2, 177-183. 691
Sirois, L. (1997) Distribution and dynamics of balsam fir (Abies balsamea L. Mill.) 692
at its northern limit in the James Bay area. Ecoscience, 4, 340-352. 693
Sirois, L., Bonan, G. B. & Shugart, H. H. (1994) Development of a simulation model 694
of the forest-tundra transition zone of northeastern Canada. Canadian 695
Journal of Forest Research, 24, 697-706. 696
38
Sirois, L. & Payette, S. (1991) Reduced postfire tree regeneration along a boreal 697
forest-forest- tundra transect in northern Quebec. Ecology, 72, 619-627. 698
Stocks, B. J., Mason, J. A., Todd, J. B., Bosch, E. M., Wotton, B. M., Amiro, B. D., 699
Flannigan, M. D., Hirsch, K. G., Logan, K. A., Martell, D. L. & Skinner, W. 700
R. (2003) Large forest fires in Canada, 1959-1997. Journal of Geophysical 701
Research D: Atmospheres, 108. 702
Vanderwel, M. C., Coomes, D. A. & Purves, D. W. (2013) Quantifying variation in 703
forest disturbance, and its effects on aboveground biomass dynamics, 704
across the eastern United States. Global Change Biology, 19, 1504-1517. 705
Viau, A. E., Ladd, M. & Gajewski, K. (2012) The climate of North America during 706
the past 2000 years reconstructed from pollen data. Global and Planetary 707
Change, 84-85, 75-83. 708
Villnäs, A., Norkko, J., Hietanen, S., Josefson, A. B., Lukkari, K. & Norkko, A. 709
(2013) The role of recurrent disturbances for ecosystem multifunctionality. 710
Ecology, 94, 2275-2287. 711
Wardle, D. A., Walker, L. R. & Bardgett, R. D. (2004) Ecosystem properties and 712
forest decline in contrasting long-term chronosequences. Science, 305, 713
509-513. 714
Zwicke, M., Alessio, G. A., Thiery, L., Falcimagne, R., Baumont, R., Rossignol, N., 715
Soussana, J. F. & Picon-Cochard, C. (2013) Lasting effects of climate 716
39
disturbance on perennial grassland above-ground biomass production 717
under two cutting frequencies. Global Change Biology, 19, 3435-3448. 718
40
Tables
719
Table 1. Variables used to describe present-day forest structure and composition
720
in triplets of sampling plots at the sites L18 and L20 721
Variable ID Unit Description
Nliv No. ha-1 Density of living trees comprising saplings and seedlings
Ntot No. ha-1 Density of living trees comprising saplings and seedlings plus snags and stumps
Nreg No. ha-1 Density of saplings and seedlings
Nliv2 No. ha-1 Density of living trees ≥ 2 cm DBH
Nliv6 No. ha-1 Density of living trees ≥ 6 cm DBH
Nliv12 No. ha-1 Density of living trees ≥ 12 cm DBH
Ndead No. ha-1 Density of snags and stumps
Ncwd No. ha-1 Density of coarse woody debris pieces on the floor
BAliv m2 ha-1 Basal area of living trees ≥ 2 cm DBH
MeanBAliv m2 tree-1 Average basal area per living tree ≥ 2 cm DBH
BAdead m2 ha-1 Basal area of snags and stumps
MeanBAdead m2 tree-1 Average basal area per snag or stump
F%reg % Percentage of fir in the sapling and seedling F% % Percentage of fir among living trees ≥ 2 cm DBH T% % Percentage of tamarack among living trees ≥ 2 cm DBH
Age years Average minimum time since the last stand-replacing fire of the three plots
a - Coefficient "a" of the power function model describing the stand size structure of living trees*
b - Coefficient "b" of the power function model*
* y = a * x(-b) where y is the number of individuals per hectare and x is the central value of 2-cm size classes (Tables S1
and S2) 722
41
Table 2. Description of the lakeshore forest of each cluster at L18 and L20.
723
Distinguishing traits are in bold (i.e. values of the variables contributing the most 724
to the discrimination of the clusters of homogeneous lakeshore forest according to 725
our multivariate analysis; see Figs 2, S3 and S4). Standard deviations (SD) refer 726
to variability among triplets of sampling plots. Variables are described in Table 1 727 Variable L18 L20 Cluster 1 (mean ± SD) Cluster 2 (mean ± SD) Cluster 3 (mean ± SD) Cluster 1 (mean ± SD) Cluster 2 (mean ± SD) Nliv (No. ha-1) 22578 ± 9255 11671 ± 2640 25806 ± 6088 24393 ± 5432 15396 ± 4337 Ntot (No. ha-1) 23778 ± 9103 12171 ± 2714 26457 ± 6120 25671 ± 5672 16135 ± 4370 Nreg (No. ha-1) 17889 ± 9083 9225 ± 2367 23500 ± 5931 19964 ± 5156 12608 ± 4197 Nliv2 (No. ha-1) 4689 ± 435 2445 ± 758 2306 ± 548 4429 ± 418 2788 ± 488 Nliv6 (No. ha-1) 2244 ± 271 1182 ± 262 1237 ± 308 2036 ± 385 1351 ± 250 Nliv12 (No. ha-1) 544 ± 19 482 ± 207 296 ± 142 421 ± 103 273 ± 123 Ndead (No. ha-1) 1200 ± 219 500 ± 166 651 ± 95 1279 ± 379 739 ± 166 Ncwd (No. ha-1) 811 ± 84 757 ± 335 580 ± 254 610 ± 100 590 ± 116 Baliv (m2 ha-1) 18.6942 ± 1.9140 14.8115 ± 4.9150 10.8277 ± 2.6050 18.1739 ± 2.8759 11.4771 ± 2.4030 MeanBAliv (m2 tree-1) 0.0040 ± 0.0001 0.0067 ± 0.0031 0.0049 ± 0.0013 0.0041 ± 0.0005 0.0041 ± 0.0006 Badead (m2 ha-1) 10.8140 ± 1.6916 6.7733 ± 1.7550 6.9507 ± 2.1521 10.4133 ± 2.4791 6.0797 ± 1.9972 MeanBAdead (m2 tree-1) 0.0090 ± 0.0002 0.0142 ± 0.0037 0.0109 ± 0.0038 0.0085 ± 0.0020 0.0085 ± 0.0027 F%reg (%) 3 ± 3 0 ± 0 0 ± 0 42 ± 21 9 ± 16 F% (%) 22 ± 4 1 ± 2 0 ± 0 28 ± 13 8 ± 9 T% (%) 0 ± 0 2 ± 2 1 ± 1 1 ± 2 2 ± 1 Age (years) 245 ± 32 226 ± 15 252 ± 13 217 ± 15 207 ± 17 a 17871 ± 9090 9220 ± 2367 23497 ± 5932 19949 ± 5159 12597 ± 4201 b 2.0 ± 0.4 2.2 ± 0.5 3.1 ± 0.5 2.2 ± 0.2 2.2 ± 0.4 728
42 Figures 729 730
Fig. 1. Map of the study area in the northern taiga of Eastern Canada (a) and of
731
lake L18 (b) and L20 (c) with plots assigned to the corresponding cluster. In b and 732
c, the outermost tree-ring dates of charred subfossil logs are also shown. If two or 733
more charred logs are facing the same plot, their outermost tree-ring dates are 734
separated by a minus sign. 735
43
736
Fig. 2. Biplots of the first two principal components of the L18 (left) and L20 (right)
737
PCAs. Variables (see Table 1) are in grey and triplets of plots are in black. Triplets 738
belonging to the same cluster are enclosed in minimum spanning ellipses (solid: 739
cluster 1; dashed: cluster 2; dotted: cluster 3). 740
44
741
Fig. 3. Life spans, abundance and recruitment rate of L18 subfossil logs
742
crossdated to the calendar year and assigned to the corresponding cluster 743
according to their location. Each horizontal grey solid line refers to the life span of 744
one log. Charred logs facing plots at the boundary between two cluster (horizontal 745
black dashed lines) and other charred logs (horizontal black solid lines) are also 746
shown, as well as the recruitment date of all charred logs in the littoral zone (based 747
on their outermost tree-ring date; vertical grey dashed lines), the estimated wildfire 748
dates (vertical black arrows on the most recent fire evidence and vertical black 749
dashed lines) and the date of the Tambora eruption (AD 1815; vertical black dotted 750
line). The thin black line at the middle of each panel shows the number of logs that 751
were living each year. The thick black line at the bottom of each panel shows the 752
average recruitment rate of logs during the identified fire-free interval (number 753
recruited per 100 years per 100 m of shoreline based on the outermost tree-ring 754
dates). 755
45
756
Fig. 4. Life spans, abundance and recruitment rate of L20 subfossil logs
757
crossdated to the calendar year and assigned to the corresponding cluster 758
according to their location. All symbols are as in Fig. 3. 759