HAL Id: hal-02296971
https://hal.archives-ouvertes.fr/hal-02296971
Submitted on 28 Oct 2019
HAL is a multi-disciplinary open access
archive for the deposit and dissemination of
sci-entific research documents, whether they are
pub-lished or not. The documents may come from
teaching and research institutions in France or
abroad, or from public or private research centers.
L’archive ouverte pluridisciplinaire HAL, est
destinée au dépôt et à la diffusion de documents
scientifiques de niveau recherche, publiés ou non,
émanant des établissements d’enseignement et de
recherche français ou étrangers, des laboratoires
publics ou privés.
Analysis and modelling of remote sensing reflectance
during anoxic crisis in the Thau lagoon using satellite
images
Manchun Lei, Audrey Minghelli, Annie Fiandrino
To cite this version:
Manchun Lei, Audrey Minghelli, Annie Fiandrino. Analysis and modelling of remote sensing
re-flectance during anoxic crisis in the Thau lagoon using satellite images. Oceans 2019, Marseille, Jun
2019, Marseille, France. pp.1-6, �10.1109/OCEANSE.2019.8867565�. �hal-02296971�
Analysis and modelling of remote sensing reflectance
during anoxic crisis in the Thau lagoon
using satellite images
Manchun LEI
Univ. Paris-Est, LASTIG, IGN, ENSG 94160 Saint-Mandé, France
manchun.lei@ign.fr
Audrey MINGHELLI University of Toulon, LIS,
CNRS UMR 7020 83957 La Garde, France
minghelli@univ-tln.fr
Annie FIANDRINO IFREMER UMR MARBEC
34200 Sète, France annie.fiandrino@ifremer.fr
Abstract — This study concerns the spectral behavior of
remote sensing reflectance Rrs of Thau lagoon water during the
anoxic crisis in the summer of 2003 and 2006. The proliferation of photosynthetic sulfur-oxidizing bacteria (SOB) in anoxic water make the water color becomes opaque and turbid until milky. An identification method using 665 nm, 709 nm and 754 nm bands of Medium Resolution Imaging Spectrometer (MERIS) sensor is proposed to identify the total anoxic water filled by SOB. The reflectance of the SOB layer is described as a specific reflectance relating to the SOB concentration. The results show that SOB contaminated water during the anoxic crisis can be quantitatively remote sensed by multispectral sensor.
Keywords — remote sensing reflectance, anoxia, sulfur-oxidizing bacteria
I. INTRODUCTION
Thau lagoon is located on the Mediterranean coast. It is about 21 km long and 8 km wide, covers approximately 70 km2
and its depth is about 4.5 meter in average. It is one of the main shellfish producers in the south of France. Thau lagoon is often affected by anoxic crises (known locally as “malaïgue”) during summer. From 1969 until 2018, 12 malaïgues have been observed in summer [1]–[3], of 1969, 1971, 1975, 1982, 1983, 1987, 1990, 1994, 1997, 2003, 2006 and 2018. The malaïgues induce sometimes significant mortality of shellfish [1] in the Thau lagoon. 5000 tons of shellfish were lost due to the anoxic crisis in August 2003 [2] and 7500 tons in July 2006 [3].
Biochemical process of the anoxic crisis in Thau lagoon was described in [4]–[7]. In the sediment/water interface, Decomposition of organic matter is usually an aerobic process. If the rate of consumption of dissolved oxygen (DO) by aerobic decomposition is greater than the supply of DO, bottom DO will be depleted and an anaerobic decomposition by sulfate-reducing bacteria will replace the aerobic decomposition. This process produces sulfides (S2-, HS-, and
H2S), which will be oxidized with the rest of DO in the water
column until the water column is completely anoxic. At this stage, hydrogen sulfide releases into the air, emits the inured smell. Photosynthetic sulfur-oxidizing bacteria (SOB) are then proliferated in the water column and milky colored patches appear at water surface [8]. The malaïgue may occur in
summer with high water surface temperature (> 25°C) and windless ( wind speed < 5 m/s) during 2 or 3 days [9] because high temperature decreases the maximum amount of DO and the calm wind slows down the air circulation.
Monitoring DO in Thau lagoon is carried out by permanent local measurements. Earlier work of Minghelli-Roman et al. [10] found a good correlation (R2 = 0.7) between chlorophyll concentration derived from MERIS satellite images and in-situ DO at -1 m depth. This relationship shows the possibility of monitoring hypoxia using MERIS chl2 product, which provides temporal regularity and spatial coverage as advantages compared to local measurements. However, when milky color appears at the water surface, the chlorophyll product is not available for these total anoxic waters because the reflectances are not anymore dominated by chlorophyll concentration.
Weeks et al. [11] observed that the appearance of milky discoloration along the Namibian coast is created by particles of sulfur resulting from the oxidation of sulfide ions. Previous work of Ohde et al. [12] analyzed the spectral characteristics of Namibian sulfur plume and proposed a classification algorithm, with thresholds in the different spectral bands to determine the sulfured pixels. In the Thau lagoon case, the oxidation of sulfide is a biochemical process through the SOB, the particles of sulfur are accumulated within the SOB cells, and a rise of bacterioplankton account was observed during the anoxic crisis [7]. These phenomena could impact the spectral behavior of Thau lagoon anoxic water reflectance.
In this work, we are interested in the spectral behavior of reflectance of the milky colored patches during anoxic crisis. Our objectives are to identify the SOB contaminated water through its spectral properties and model the relationship between water reflectance and the SOB. In-situ measurements of DO during the anoxic crisis in summer of 2003 and 2006 were used to indicate the water state. MERIS Remote sensing reflectances (Rrs) corresponding to the in-situ stations locations
were then collected and analyzed. Unfortunately, there is no quantitative measurement of SOB or sulfur during this period, an hypothetical factor related to the concentration of SOB has to be given in order to apply the semi-analytical model of Lee [13]–[15] on milky colored water reflectance.
Section II presents the in-situ data, MERIS data, and a method for modelling the reflectance of anoxic water filled by SOB. Section III presents the results.
II. DATA AND METHOD
A. In-situ measurements
Since 2000, the RSL (Réseau de Suivi Lagunaire) lagoon
monitoring network has supported the management of the lagoon environments in the Languedoc-Roussillon region. The parameters measured annually between June and August in the lagoon are: temperature, salinity, turbidity, DO, nitrate, nitric oxide, ammonium, phosphates and chlorophyll [10]. DO measurement is carried out at surface level (-1 m) and bottom level (+1 m). The in-situ measurement stations are especially located close to the shellfish tables, towards the northeast and northwest of the lagoon (Fig. 1). Two anoxic crises have been recorded since the launch of MERIS in 2002. The first one occurred in 2003, DO was measured through 8 stations with a frequency of 7 days between June and September. The second one occurred in 2006, the number of stations was increased to 25, with a frequency of 3 days between July and August. There are 312 in-situ measurements of DO (surface and bottom) during the anoxic crises of Thau lagoon in 2003 and 2006.
Fig. 1. Location of the study site and in-situ measurement stations. Grey solid circle symbol presents 8 stations during summer 2003, and empty square symbol presents 25 stations during summer 2006.
SOB grows in anoxia and sulfide environment. During the anoxic crisis, sulfides and DO are inversely related. In-situ observation found that the color of the Thau lagoon surface water becomes opaque and milky when surface DO fewer than 2 mg/L. This value is used to classify the water as normal state
water (NSW) (DO > 2 mg/L), bottom anoxic water (BAW) (only bottom DO < 2 mg/L) and total anoxic water (TAW) (bottom DO < 2 mg/L and surface DO < 2 mg/L). Note that if the surface is anoxic, it is caused by the anaerobic decomposition of organic matter on bottom therefore the bottom is anoxic too. Fig. 2 shows the evolution of surface DO at the stations where water color has been changed due to the anoxic crisis. When the DO decreases from the normal state to the anoxic state, it remains in this state until the temperature drops or the wind speed increases. Because of the long time interval between 2 measurements, we don’t know the exact time of the beginning and the end of anoxic state on each station. Nevertheless, we can consider that the period between 2 low DO values is a period of anoxic state. Fig. 2 shows that there are 4 stations recorded the total anoxia period in 2003 and 10 stations in 2006. The stations ME, NV and MB are close and they were anoxic between August 18 and August 25, 2003. Total anoxia periods recorded in 2006 are shorter. The stations in northeast of lagoon (P19, P21) were in total anoxic state between July 12 and 17, 2006 and the stations in northwest of lagoon (P9, P10, P11) were in total anoxic state between July 20 and 24, 2006.
Fig. 2. Evolution of the dissolved oxygen concentration at the surface (-1 meter) level during the anoxic crisis period in 2003 (up) and in 2006 (down).
B. MERIS data
MERIS Level-2 version MEGS 8.1 products were used for this work. These data can be found from kalicotier site (www.kalicotier.com). The normalized remote sensing reflectance Rrs were used to analyze the spectral behavior of
anoxic water in Thau lagoon. The spatial resolution of MERIS is 300 m with 13 spectral bands from 412.5 to 885 nm. The revisit period of MERIS is 3 days, but many images were not available due to cloud coverage. 54 Rrs spectra were collected
on the pixels corresponding to the in-situ stations location between June and September 2003 and on July 2006. The Rrs
spectra were classified as NSW, BAW and TAW according to the in-situ DO values.
As observed in Minghelli-Roman et al. [10], MERIS chl2 product has a consistent linear relationship with the ground measurements but it gives an high error of overestimation. The proposed linear correction with a slope at 0.2092 and an intercept at 1.8118 mg/Lwas applied in this work. Only the
chl2 of NSW and BAW were taken into account. C. Water reflectance model
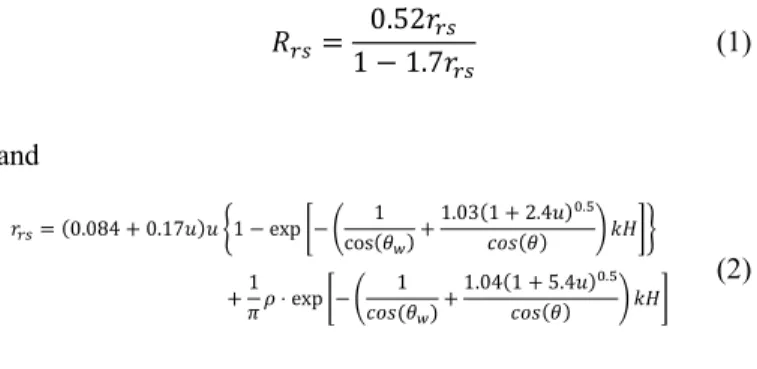
Based on the quasi-single-scattering theory, Rrs cans be
approximately described by semi-analytical model of Lee [13]– [15] as: 𝑅𝑟𝑠=1 − 1.7𝑟0.52𝑟𝑟𝑠 𝑟𝑠 (1) and 𝑟𝑟𝑠= (0.084 + 0.17𝑢)𝑢 {1 − exp [− ( 1 cos(𝜃𝑤)+ 1.03(1 + 2.4𝑢)0.5 𝑐𝑜𝑠(𝜃) ) 𝑘𝐻]} +1 𝜋𝜌 ⋅ exp [− ( 1 𝑐𝑜𝑠(𝜃𝑤)+ 1.04(1 + 5.4𝑢)0.5 𝑐𝑜𝑠(𝜃) ) 𝑘𝐻] (2)
Where rrs is subsurface remote sensing reflectance, defined
as the ratio of upwelling radiance to downwelling irradiance.
θw and θ are subsurface solar and viewing zenith angle, k is the sum of absorption coefficient a and backscattering coefficient
bb, u is the ratio of bb to k, H is the bottom depth and ρ is
bottom albedo.
When SOB grows in the total anoxic water column, the bacteria layer is opaque, so that the bottom albedo can be replaced by the bacteria reflectance ρbac, and the bottom depth
is accounted from surface to bacteria layer. We suppose that the milky discoloration of total anoxic water is due to the rise of SOB layer to water surface so that H is considered as 0 and the ρbac can be simply derived from Rrs:
𝜌𝑏𝑎𝑐 =
𝜋 ⋅ 𝑅𝑟𝑠
0.52 + 1.7𝑅𝑟𝑠 (3)
We considered that the ρbac is a function of the
concentration of SOB as:
𝜌𝑏𝑎𝑐(𝜆) = 𝜌𝑏𝑎𝑐∗ (𝜆) ∙ 𝑓(𝐶𝑏𝑎𝑐) (4)
𝜌𝑏𝑎𝑐∗ (𝜆) is defined as specific SOB reflectance which is a
spectrum in constant. 𝐶𝑏𝑎𝑐 is the concentration of SOB.
III. RESULTS
A. SOB spectral behavior analysis
As presented in Fig. 2, the ground DO measurements on August 18, 2003 found 4 stations (ME, NV, MB and BN) in total anoxic state, and we found also 2 stations (PB and BE) in bottom anoxic state. In Fig. 3, we present the MERIS Rrs
spectra of stations ME (Total anoxic water) and BE (Bottom anoxic water) on the same date. We can compare these spectra with the MERIS Rrs in normal state, inside the lagoon (Normal
lagoon water) and outside the lagoon (Normal sea water), obtained before the anoxic crisis, on July 12, 2003.
We can notice that the bottom anoxic water reflectance looks similar to the normal lagoon water reflectance. Both of them have chlorophyll backscattering peak at 560 nm and the fluorescence peak at 681 nm. The chlorophyll concentration estimated given by MERIS chl2 after correction are: 4.38 mg/L for bottom anoxic water and 3.17 mg/L for normal lagoon water. The Rrs spectral form and chlorophyll value of BAW are
suitable for eutrophication situation. The normal sea water reflectance presented is a typical clear water reflectance; its chlorophyll concentration is 0.3 mg/L.
The TAW reflectance presented in Fig. 3 is significantly different to the others. We can notice a high reflective peak at 560 nm, which is similar to some very high turbid waters reflectance, but its second peak located at 709 nm is a distinctive property compared to other waters. This reflectance behavior is also different to the MERIS reflectance of sulfur plumes along the Namibian coast [12]. In the case of the Namibian sulfur plumes, the MERIS reflectances have a peak at 560 nm, high value at 510 nm, but the peak at 709 nm did not appeared.
Fig. 3. MERIS normalized remote sensing reflectance spectra corresponding to different water states during summer 2003.
B. Sulfur Line Height method
The sulfur identification algorithm proposed in [12] is not suitable in Thau lagoon anoxic crisis because of their different behaviors. For example, the ratio of anoxic water reflectance between 665 and 681 nm are < 1 in this study, but the value found in [12] is > 1.0146. Moreover, a threshold value for the reflectance at 560 nm is difficult to fix. As we consider the reflectance of SOB layer depends on its concentration, and its
contribution in Rrs varies with the surface-SOB layer distance H, the Rrs value of 560 nm peak may be reduced with a low concentration or high distance.
We propose to use the peak of 709 nm to identify the total anoxic water. As the algorithm proposed in [16] for estimating the fluorescence signal, Fluorescence Line Height (FLH), we propose to calculate the Sulfur Line Height (SLH) as:
𝑆𝐿𝐻 = 𝑅1− 𝑅2− (𝑅3− 𝑅1)(𝜆(𝜆2− 𝜆1)
3− 𝜆1) (5)
Where 𝑅𝑖 is the reflectance for MERIS band i, centered at
wavelength𝜆𝑖. 𝜆2= 709 nm, the SOB peak band, 𝜆1= 665
nm and 𝜆3= 754 nm, are used to determine the baseline.
In Fig. 4, The SLH of bottom anoxic water is close to 0,
SLH of normal sea water is negative and also close to 0, only SLH of total anoxic water has a high positive value. The band
at 665 nm was selected for the left baseline in order to avoid the impact of chlorophyll fluorescence at 681 nm in eutrophication situation.
Fig. 4. Comparison of sulfur line height of total anoxic water and other waters.
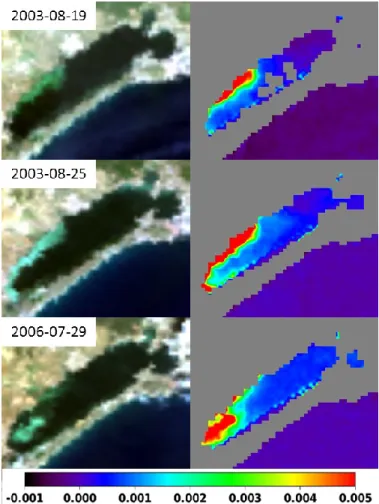
We calculated the SLH map of Thau lagoon area during summer of 2003 and 2006, and we compared these maps to the true color images created by MERIS Level 1 Top-of-Atmosphere radiance image (Fig. 5). In Fig. 5, the milky colored patch appears in the true color image only when SLH has a strong enough value (≥ 0.005), so the true color image does not allow discriminating between moderated SOB contaminated water and normal water, which can be clearly separated in SLH map. Note that some pixels located near the
coast line whose depth are less than 1 m, were hidden because their reflectances are strongly impacted by the bottom reflection.
Fig. 5. Left: True color images of Thau lagoon created by MERIS Level 1 Top-of-Atmosphere radiance image during the anoxic crisis, in which the milky patch is presented. Right: SLH map calculated using MERIS Level 2 remote sensing reflectance at 665 nm, 709 nm and 754 nm bands. The color bar of SLH is presented below the maps.
For the identification of TAW, a pixel can be considered in total anoxic state if its SLH > 0.001. We considered that SLH value is related to the concentration of SOB.
C. Retrieval of SOB reflectance
We applied the presented TAW identification on MERIS
Rrs image during summer of 2003 and 2006. Reflectance spectra of these classified TAW pixels are presented in Fig. 6. The average and the standard deviations of these reflectances are also shown (red line). We considered these reflectances are related to the SOB reflectances𝜌𝑏𝑎𝑐, and we calculate the SOB
reflectance by Equation 3. The result is presented in Fig. 7. We assumed that the SOB reflectance is a function of the concentration of SOB (Equation 4) and its spectral characteristics is based on a specific SOB reflectance𝜌𝑏𝑎𝑐∗ (𝜆).
This hypothesis can be proven if there is a good correlation between 𝜌𝑏𝑎𝑐 and SLH. Consistent linear relationship is found
when comparing 𝜌𝑏𝑎𝑐(𝜆) and SLH (Fig. 8), provides a median
good in blue band that is probably due to error of atmospheric correction on coastal area.
The dataset used in this work does not allow to give the true value of 𝜌𝑏𝑎𝑐∗ (𝜆) and 𝐶𝑏𝑎𝑐. We made a hypothesis that
𝜌𝑏𝑎𝑐∗ (𝜆) is the mean value of the derived𝜌𝑏𝑎𝑐(𝜆), which is
presented in Fig. 7 (red solid line). And we assumed a simplified function of 𝑓(𝐶𝑏𝑎𝑐) as 𝑓(𝐶𝑏𝑎𝑐) = 𝐶𝑏𝑎𝑐′ . We can then
calculate the factor 𝐶𝑏𝑎𝑐′ as the mean value of the ratio
𝜌𝑏𝑎𝑐(𝜆) ∕ 𝜌𝑏𝑎𝑐∗ (𝜆). 𝐶𝑏𝑎𝑐′ were found between 0.3 and 2.05. The
𝜌𝑏𝑎𝑐 calculated by equation 4 have a good agreement with the
𝜌𝑏𝑎𝑐derived from the MERIS Rrs. The averaged R2 is 0.94 and
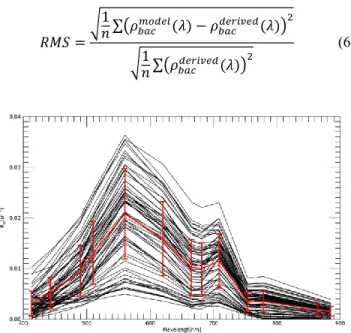
Root Mean Square (RMS) of relative spectral error is 16.16%. 𝑅𝑀𝑆 = √1𝑛 ∑(𝜌𝑏𝑎𝑐𝑚𝑜𝑑𝑒𝑙(𝜆) − 𝜌 𝑏𝑎𝑐𝑑𝑒𝑟𝑖𝑣𝑒𝑑(𝜆)) 2 √1𝑛 ∑(𝜌𝑏𝑎𝑐𝑑𝑒𝑟𝑖𝑣𝑒𝑑(𝜆))2 (6)
Fig. 6. MERIS Rrs of the Thau lagoon during summer 2003 and 2006 which are classified as total anoxia. Red line presents the average and standard deviation of these reflectances.
Fig. 7. SOB reflectance 𝜌𝑏𝑎𝑐 retrieved from the MERIS Rrs given in Fig. 6. Red line presents the average and standard deviation of these reflectances.
Fig. 8. Plot of the 𝜌𝑏𝑎𝑐(𝜆) vs SLH.
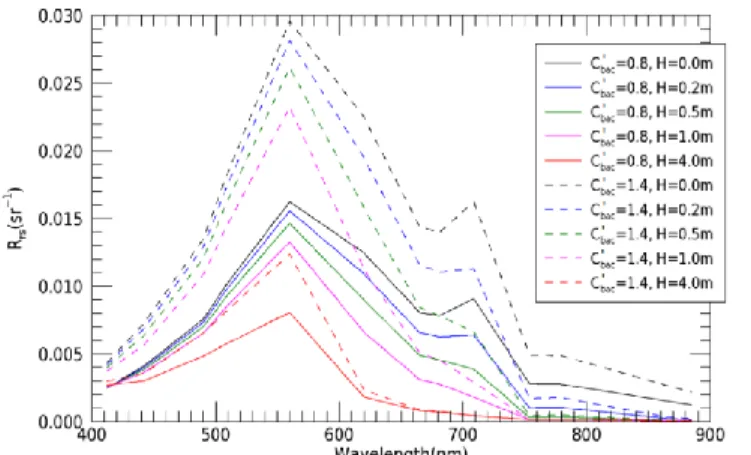
D. Rrs simulations
We performed Rrs simulations of anoxic waters using the
above presented model. The simulations consist of a variation of SOB layer depths and concentrations. When H is > 0 m, the water column between SOB layer and surface were considered as eutrophic water body, chlorophyll concentration was given as 5 mg/L, and suspended particulate matter concentration was given as 1 g/m3. The results presented in Fig. 9 show that the SLH values decrease quickly with SOB depth H. That might
explains why SLH method cannot identify the bottom anoxic water whose SOB layer has not yet reached the water surface.
The simulated SOB Rrs for H = 0 are very similar to the
MERIS Rrs as presented in Fig. 6, but it is difficult to compare
the bottom anoxic case with H > 0 that we cannot identify in the MERIS Rrs images. The simulated Rrs with 𝐶𝑏𝑎𝑐′ = 0.8 and
presented in Fig. 3, but the simulation with 𝐶𝑏𝑎𝑐′ = 1.4 and
𝐻 = 4.0 m is higher than the MERIS reflectance.
Fig. 9. Simulation of Rrs spectra of anoxic waters with various SOB layer depths and concentrations.
We considered that the effect of SOB layer in the underwater light transfer is like the bottom reflection because of its high opacity. As hydrogen sulfide is produced at the bottom of lagoon, we assumed that the SOB development is an opaque layer that rises from the bottom up to the surface. The results presented in Fig. 9 show that the simulated reflectances with small H (< 0.5 m) based on these assumptions present the same characteristics as the measured SOB reflectances but the method needs to be improved for modelling the reflectance of SOB water with various H. The suggested approach is to investigate the inherent optical properties of sulfur, SOB and bacteriochlorophyll, and combine them with the water reflectance model.
IV. CONCLUSION
Remote sensing reflectance of anoxic water in Thau lagoon was studied in this work. A Sulfur Line Height method has been proposed to classify the total anoxic water and to evaluate the SOB contamination during the anoxic crisis of Thau lagoon. The SLH plumes have a good agreement with the milky colored patches found in MERIS true color images and the SLH maps make possible for a quantitative remote sensing of SOB. More ground measurements will be needed to establish the relationship between the concentration of SOB and the SLH of total anoxic water in Thau lagoon.
Authors proposed a SOB reflectance model and combined it with the Lee water reflectance model to simulate the remote sensing reflectance depending on the water constituent’s concentration, SOB concentration and the depth between SOB layer and water surface. The simulated Rrs show the same
characteristics as the Rrs of milky colored patches measured by
MERIS sensor.
REFERENCES
[1] P. Y. Hamon, C. Vercelli, Y. Pichot, F. Lagarde, P. Gall, and J. Oheix, “Distrophyc crisis in Thau Lagoon. Tome 1,” IFREMER, DRV/RA/RST/2003-01, 2003.
[2] IFREMER, “Réseau de Suivi Lagunaire du Languedoc-Roussillon : Bilan des résultats 2003,” IFREMER, RSL-04/2004, 2004.
[3] IFREMER, “Réseau de Suivi Lagunaire du Languedoc-Roussillon : Bilan des résultats 2006,” IFREMER, RSL-07/2007, 2007.
[4] H. Tournier, P. Y. Hamon, and P. Arnaud, “Développement de la malaïgue en 1975 dans l’étang de Thau,” 25–26./03, 1979.
[5] G. F. Frisoni and A. M. Cejpa, “La malaïgue dans les étangs littoraux du Languedoc-Roussilon,” 1989.
[6] P. Souchu et al., “Biogeochemical aspects of bottom anoxia in a Mediterranean lagoon (Thau, France),” Mar. Ecol.-Prog. Ser., vol. 164, pp. 135–146, 1998.
[7] P. Souchu, E. Abadie, C. Vercelli, D. Buestel, and J. C. Sauvagnargues, “La crise anoxique du bassin de Thau de l’été 1997. Bilan du phénomène et perspectives,” IFREMER, DEL.98.04, 1998. [8] P. Caumette, “Participation des bactéries phototrophes
sulfo-oxydantes dans le métabolisme du soufre en milieu lagunaire méditerranéen (Etang du Prévost). Etude des crises dystrophiques (Malaïgues),” University of Montpellier, 1978.
[9] H. Tournier, A. Lasram, and Y. Pichot, “Dévasement expérimental des tables conchylicoles dans l’étang de Thau,” IFREMER, DRV, 1989.
[10] A. Minghelli-Roman, T. Laugier, L. Polidori, S. Mathieu, L. Loubersac, and P. Gouton, “Satellite survey of seasonal trophic status and occasional anoxic ‘malaigue’ crises in the Thau lagoon using MERIS images,” Int. J. Remote Sens., vol. 32, pp. 909–923, 2011. [11] S. J. Weeks, B. Currie, and A. Bakun, “Massive emissions of toxic
gas in the Atlantic,” Nature, vol. 415, no. 6871, pp. 493–494, 2002. [12] T. Ohde, H. Siegel, J. Reißmann, and M. Gerth, “Identification and
investigation of sulphur plumes along the Namibian coast using the MERIS sensor,” Cont. Shelf Res., vol. 27, no. 6, pp. 744–756, 2007. [13] Z. Lee, K. L. Carder, C. D. Mobley, R. G. Steward, and J. S. Patch,
“Hyperspectral Remote Sensing for Shallow Waters. I. A Semianalytical Model,” Appl. Opt., vol. 37, no. 27, pp. 6329–6338, 1998.
[14] Z. Lee, K. L. Carder, C. D. Mobley, R. G. Steward, and J. S. Patch, “Hyperspectral Remote Sensing for Shallow Waters. 2. Deriving Bottom Depths and Water Properties by Optimization,” Appl. Opt., vol. 38, no. 18, pp. 3831–3843, 1999.
[15] Z. Lee, K. L. Carder, and R. A. Arnone, “Deriving Inherent Optical Properties from Water Color: a Multiband Quasi-Analytical Algorithm for Optically Deep Waters,” Appl. Opt., vol. 41, no. 27, pp. 5755–5772, 2002.
[16] J. F. R. Gower, R. Doerffer, and G. A. Borstad, “Interpretation of the 685nm peak in water-leaving radiance spectra in terms of fluorescence, absorption and scattering, and its observation by MERIS,” Int. J. Remote Sens., vol. 20, no. 9, pp. 1771–1786, 1999.