Science Arts & Métiers (SAM)
is an open access repository that collects the work of Arts et Métiers Institute of Technology researchers and makes it freely available over the web where possible.
This is an author-deposited version published in: https://sam.ensam.eu Handle ID: .http://hdl.handle.net/10985/8696
To cite this version :
Kilian CROCI, Michel ARRIGONI, P BOYCE, Céline GABILLET, Hervé GRANDJEAN, Nicolas JACQUES, Steven KERAMPRAN - Mitigation of underwater explosion effects by bubble curtains : experiments and modelling - In: 23rd MABS (Military Aspects of Blast and Shock), Oxford, UK, 7-12 September 2014, United Kingdom, 2014-09-7-12 - Proceedings of the 23rd MABS - 2014
Any correspondence concerning this service should be sent to the repository Administrator : [email protected]
MITIGATION OF UNDERWATER EXPLOSION EFFECTS BY
BUBBLE CURTAINS: EXPERIMENTS AND MODELLING.
K. Croci1, M. Arrigoni1, P. Boyce4, C. Gabillet2, H. Grandjean3, N. Jacques1, S. Kerampran1
1
ENSTA Bretagne, Laboratoire Brestois de Mécanique et des Systèmes (LBMS), 2 rue François Verny, Brest Cedex 9, 29806, France; 2IRENAv, BP 600, Ecole Navale, Lanvéoc Poulmic, Brest Naval, 29240, France ; 3DGA Techniques Navales, Chaussée du Vexin, BP 510, Val de Reuil, 27105, France, 4DGA Techniques Navales, Avenue de la Tour Royale, BP
40915, 83050 Toulon Cedex, France.
Mine fields and UneXploded Ordnances (UXO) become a danger regarding maritime activities. Since UXOs are strongly affected by marine corrosion after decades, they cannot be handled safely. A safe solution to get rid of them would be to explode them in their locations. However, this method generates noise pollution and damaging shock waves. Mitigation of shocks and noises is made possible by the use of a bubble curtain set around the explosive charge. Physical aspects of shock propagation in bubbly flows have been the subject of numerous investigations in the past decades and theoretical models of aerated liquids now reproduce main shock features with acceptable accuracy in the case of a uniform distribution of bubbles of the same size. However, the bubble distribution obtained by air blown in a porous pipe is far to be monodisperse. So the modeling of the interaction of a shock wave with a polydisperse medium still remains a challenge.
In the present study, the transmission of a shock wave propagating through a bubble curtain is investigated experimentally on a water filled tank. A microporous pipe, connected to a compressed air supply system and a flowmeter, is placed on the floor in the tank. A dual-tip fiber optical probe is used to measure the gas fraction distribution, bubble rising velocity and bubble size distribution in the curtain. A calibrated shock wave is generated by plate impact, upstream of the bubble curtain, and recorded downstream with a hydrophone. The mitigation of the pressure peak by the bubbly medium is evidenced by recorded pressure signals with and without bubble curtain. Experimental gas fraction profiles and bubble size distributions, measured in the bubble curtains, are finally used as input parameters in the numerical model developed by Grandjean et al. (2011). This numerical model enables prediction of shock wave mitigation and allows calibrating a suitable bubble curtain. Key words: Bubble curtain – Bubbly Media – Underwater explosion – UXO – Shock wave
mitigation – Optical probes – Numerical simulation
1. Introduction
UneXploded Ordnances (UXOs), left on seas and oceans after past wars, or left in underwater dumpsites, have become an hazardous burden. After decades, marine corrosion provokes leaks of hazardous explosive and carcinogenic substances that can threaten the sea life and contaminate our food chain (OSPAR report 2010; Francken 2011). Some of them may even contain yperite. Moreover, UXOs can be found in fisher nets and provoke accidental explosions. As UXOs are unsure and cannot be easily handled, one efficient solution could be to explode them at their place on the seabed. However, this solution is not acceptable regarding the pollution of the ecosystem and the threat on the sea life and surrounding human activities. Palliative solutions have come and, among them, bubble curtains are used to mitigate shock waves and noise produced by underwater explosions (Domenico 1982; Rude et al. 2007; Schmidtke et al. 2009) or during impact pile driving (Rustemeier et al. 2012; Dahl and Reinhall 2013). However this device is mostly empirically used. The analytical models available, describing this physics, mostly focus on shock wave propagation through a monodisperse bubbly media and thus are still not predictive enough for a realistic case (Van Wijngaarden 1970; Drumheller and Kipp 1982; Kameda et al. 1998). The few models which have been proposed to describe the interaction of a shock wave with a polydisperse bubbly media (Ando et al. 2009) or with a bubble curtain (Surov 1999; Sychev 2006) give relevant results only for restrictive conditions.
In his PhD dissertation, Grandjean (2012) provides relevant shock wave mitigation by polydisperse bubble curtain model which takes into account several phenomena poorly used into other models such as thermal and bubble fission effects or heterogeneous gas fraction profiles. This model considers as input: bubble size distributions, gas fraction profiles and curtain widths which have unfortunately not been characterized in previous investigations concerning bubble curtains.
The purpose of this work is to propose a method, based on experiments and numerical simulation, able to predict the underwater shockwave mitigation by realistic bubble curtain under controlled parameters (essentially the incident peak pressure intensity, gas rate into the bubbly media and bubble size distribution).
Experiments involving underwater detonations are not safe, the plate impact method has been chosen in this work since this method can provide similar loads (Espinosa 2006). In the present work, the underwater shockwave is created by projectile impact on an armored water tank including a bubble generator and a dynamic pressure sensor. The experimental setup and its analytical considerations are respectively introduced in section 2.1 and 2.2. The bubble curtain characterization is investigated in section 2.3 that deals with gas fraction and bubble distribution measurement by optical probes. In section 3, a discussion is given about experimental shock wave measurements whereas, in section 4, the mitigation models proposed by Grandjean (2011, 2012) are introduced. It also concludes with the mitigation potential of the tested bubbly media.
2. Experimental Setup
2.1. The water filled Tank
The experimental setup is described on figure 1. The tank is made of 2 cm thick plates of 330 steel reinforced by ribs. 3 cm thick polycarbonate windows are placed on three sides (lateral and upper sides) in order to observe the bubble curtain. The inner dimensions of the tank are 25 cm long, 30 cm wide and 20 cm deep. A 81 mm long piston-anvil is placed on the front face. This anvil is cylindrical and has a 60 mm diameter. It is made on aluminium 7075 since it has a high elastic limit of the order of 500 MPa. The tank is filled with tap water at the room temperature of about 20°C. The bubble generator is made of a porous pipe supplied in air by an inlet through the upper side on which is connected a flowmeter. The pie is fixed on the bottom side of the tank. Its position and dimension are given in section 2.3. A calibrated outlet valve allows the added air to escape outside of the tank in order to keep a constant inner pressure. The inner static pressure is monitored by a pressure transmitter and kept equal to the ambient atmospheric pressure (1 bar).
Fig.1 Experimental setup of the water tank including bubble and shock generators.
A piezoelectric shock sensor Neptune Sonar© T11, based upon a piezoelectric tourmaline crystal, is mounted on the back side of the tank (in vis a vis of the piston-anvil). It has a time rise less than 4 µs and a pressure range from 0 to 275 Mpa. It is connected to a Müller Charge amplifier MCPA 10 which offers a bandwidth from 100Hz to 10 MHz.
projectile 0 V r Gun sensor anvil
The signal is recorded by a numeric fast oscilloscope.This sensor is aligned with the axis of the anvil and can be moved along this axis. The shock gauge was placed at 12 cm from the inner end of the anvil and the curtain was set at the middle between the gauge and the anvil.
A gas gun of 50 mm diameter and 2 m long is aligned with the axis of the anvil and the sensor.
It accelerates a 2 mm thick aluminium plate of a diameter of 40 mm. This projectile is held in a 50 mm long sabot until the impact on the anvil. The impact velocity V0 is controlled by the
gas pressure in the gun tank and can reach up to 100 m/s. It is measured by photodiode barriers at the end of the gun.
In this work, the impact velocity has been set to 45 ± 2 m/s. Pressure signals were recorded with and without the bubble curtain at 5 MHz sampling rate during almost 10 ms. The oscilloscope was trigged on the rising front of the shock sensor when the bubble curtain was off and on the photodiode barriers at the end of the gun when the bubble curtain was on (since the rising front was hardly perceptible among the noise).
2.2 Analytical description of shock generation and wave propagation
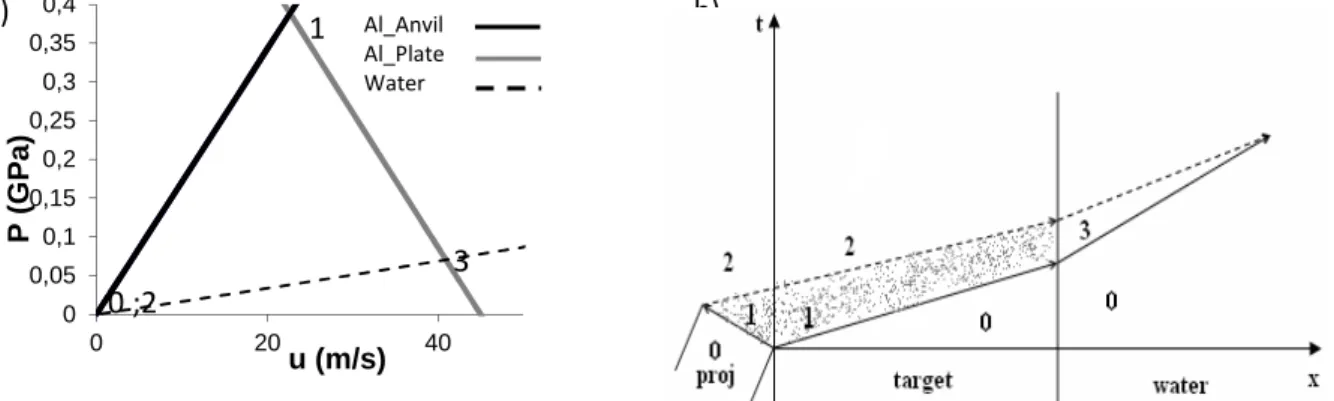
When the plate launched by the gas gun impacts the anvil, a shock wave is produced and propagates through the anvil. At the interface with the water, inside the tank, the shock is transmitted in the water and propagates through the bubbly media and reaches the sensor. Another wave is also reflected towards the impacted surface in the anvil. The shock pressure can be deduced by an analytical approach relying on the shock polar technique (Fig. 2) (Meyers 1994). The material parameters are gathered in table 1.
In the pressure and material velocity plane (P,u), the possible thermodynamic states of materials involved in a shock sequence are described by the Hugoniot curves. As the anvil and the plate are made of the same material, they have the same Hugoniot. However, the shock generated within the plate (i.e. projectile) at the impact is propagating at the opposite direction of the one generated in the anvil. Thus, the plate hugoniot has a negative slope and starts with P=0 at V0 (Fig. 2a) while the one of the anvil, without initial velocity, passes
through the origin of the P-u plane. The thermodynamic state of the anvil and plate after impact is determined by the intersection of the two polars, noted “1” in the (P,u) plane. The hydrodynamic pressure is then a flat top temporal profile of 640 ns of duration and about 380 MPa, which is below the elastic limit of Al 7075 (see table 1). The shock velocity D transmitted in the anvil is given by relation (1) and reaches 6210 m/s :
D = C0 +su (1)
When the shock wave generated in the plate reaches its free surface (i.e. opposite to the impacted face), it is reflected in rarefaction waves (sonic in the shocked material) usually determined by the characteristics method. These sound waves are propagating in a shocked medium (with a material velocity u and density ρ>ρ0) faster than the shockwave itself. Its
velocity C is assumed to follow the relation (2) :
= + 2 (2)
With the bulk velocity = + (3)
The bulk velocity has been considered instead of the longitudinal velocity CL because this
experiment does not match with sound propagation in bars. Indeed, the diameter of the anvil remains of the same order of magnitude of its length.
Fig.2 : a) Shock polar diagram of the early stage of the experiment in the P-u plane. b) Space-time diagram with thermodynamic states occurring in the experiment.
Material ρ0 Kg/m3 C0 m/s s Y0 GPa E (GPa) G (GPa) CL m/s
AL 7075 2804 6180 * 1,34 0.5 71,2 26,9 6330 Water 998 1647 1.921 - - - -
Table 1: Materials parameters involved in the experiment from (LASL 1980) excepted * calculated with relation (3) since it is in elastic regime.
The lagrangian sound velocity in the shocked state will be thus C+u that is to say about 6240 m/s. This velocity depends on the velocity impact and the material characteristics. Since the head of rarefaction waves is faster than the shock propagating in the anvil, it will catch it up and attenuate it (hydrodynamic damping). In these experimental conditions (V0= 45 m/s and
plate thickness = 2 mm), the catch up distance is about 80 cm, which is much greater than the anvil length. At the anvil/water interface, the shockwave is transmitted in the water and reflected in the anvil. A new thermodynamic state is deduced from the polar diagram, noted state “3”. The hydrodynamic pressure in the water is then a flat top pressure profile of 70 MPa, the shock velocity transmitted in water is about 1726 m/s and the sound velocity of the head of the rarefaction waves propagating behind the shock is 1802 m/s. Thus, the head of the rarefaction wave will catch the shock wave 2.3 cm after having left the anvil and then will decrease it. After this point, the determination of thermodynamic parameters can be treated with a hydrodynamic code.
2.3. Bubble curtain characterization
2.3.1. Experimental setup and procedure
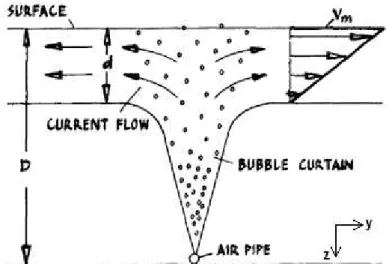
The experiments were conducted in a pool where a bubble curtain has been generated with a 15 cm long ceramic microporous aquarium pipe fixed at a depth H of 12.6 ± 0. 2 cm from the free surface. The pipe was connected to a pressure relief valve which permits to maintain the inner air flow to a constant value of 11.75 L/min ± 1.75% that can be measured in real time by a flowmeter. Figure 3 displays a conceptual sketch of a bidimensional bubble curtain developing under the free surface.
0 0,05 0,1 0,15 0,2 0,25 0,3 0,35 0,4 0 20 40 P ( G P a ) u (m/s) a) Al_Anvil b) Al_Plate Water 0 ;2 1 3
Fig. 3 Sketch of the main parameter to describe a bubble curtain proposed by Bulson (1968). D is the total depth,
d is the depth where the surface velocity of the current Vm is non-zero.
Regarding figure 3, Y profiles of the gas fraction, bubble rising velocity and bubble size were taken at depth Z where surface effects are negligible (area of thickness d except). Bulson (1968) gives an empirical equation to estimate the depth d:
= 0.32 !" #1 +$ % (4)
where
ρ
e corresponds to the water density, g is the gravity and Patm is the atmosphericpressure. In the present study the total depth D (also written H) is about 12.6 cm, thereby d is equal to 4 cm. Hence a profile has been taken at a depth Z about 6.6 cm from the free surface in order to have a relevant characterization of the bubble curtain for this depth.
2.3.2. Measurement techniques used for the characterization of the bubble curtain A dual-fiber optical probe associated with an optoelectronic module was used to measure the gas fraction, rising gas velocity, Ug, and bubble size distributions. The end of
each optical fiber had a cone-shaped tip, leading to an amount of light reflected back to the optoelectronic module being sensitive to the refractive index (liquid or gas) where the tip is immersed. The optical probe was the same as used downstream of a ventilated cavity along a flat plate by Mäkiharhu et al. (2013). The probe was made of two sapphire tips, 30 µm large. For the purpose of our study, the two tips were aligned in the bubble rising direction and separated by a distance l12 of 1.15 mm (Fig. 4). The tips are submitted to successive dewetting
and rewetting processes each time a bubble crosses the tips. Thus a bubble is correctly detected if the dewetting and rewetting characteristic times are smaller than the residence time of the bubble on the tip. The resolution of the probe (ie: the smallest bubble size that can be correctly detected by the tips) was characterized by Mäkiharhu et al. (2013), it is expected to be as small as 500µm.
The output voltage of each fiber was recorded, with a sampling frequency set to 25 kHz and a measurement time of 120 s. Same processing was performed as in Makiharju and al. (2013) and Gabillet et al. (2002).
First of all, a single voltage threshold was applied to binarize the output voltage (1: in the bubble, 0: in the liquid) and thus determine arrival and departure time of each bubble crossing the tips. The ratio between the total residence time of the bubbles on the tips and the measurement time was considered as the local gas fraction
α
. The velocity and chord length of each bubble was deduced, based on the signals recorded by the two tips. As prescribed in Makiharju and al. (2013), by using the local chord length distribution of the bubbles, it was then possible to use the inverse method developed by Clark and Turton (1988) to determine the local bubble size distribution. For this purpose, bubbles were assumed spherical.Transverse profiles of the gas fraction, mean velocity and mean diameter of the bubbles were achieved by shifting the dual fiber optical probe horizontally through the bubble curtain at fixed depths (cf. 2.3.1). Accuracy of the traverse mechanism for positioning the probe was about 0.5 mm.
Taking into account the sensitivity of the optical probe to the different processing parameters, sampling frequency and measurement time, it leads to a possible relative error of ±10 %, ±5 %, ± 10 % respectively for the determination of the gas fraction α, gas velocity Ug and bubble
diameter db.
2.3.3. Characteristics of the bubble curtain
Transverse Y profiles of the gas fraction α, mean bubble rising velocity Ug and mean
bubble size db measured at depth Z=6.6 ±0. 2 cm in the curtain are respectively presented in
Fig. 5, 6 and 7. Profiles are plotted as a function of ratio between transverse axis y and the total depth H. Error bars referred to the global error are also plotted.
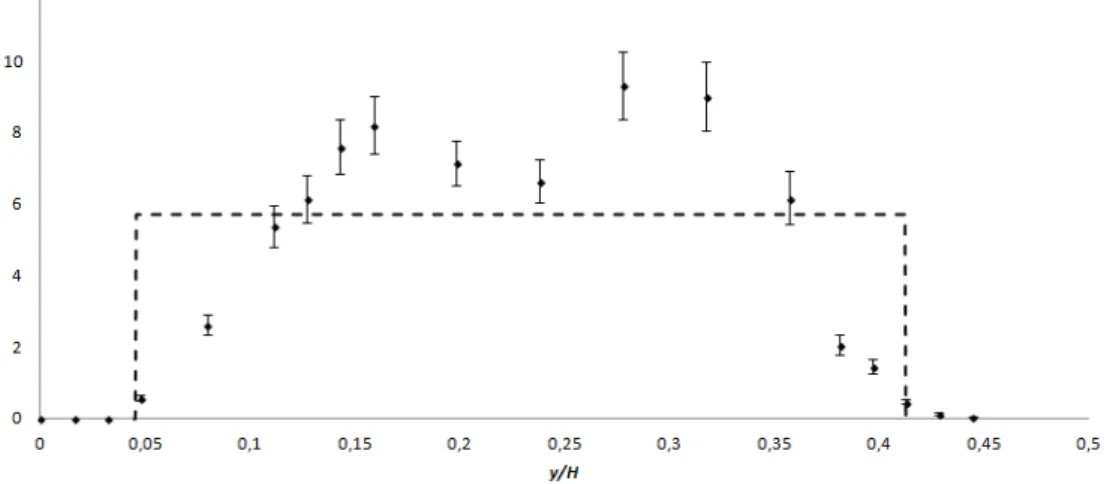
Fig. 5 Percent gas fraction profile at depth 6.6 cm and inner air flow of 11.75 L/min.
Fitted homogenous square profile implemented in Model 1 (dotted line) and experimental profile implemented in Model 2 (points).
As explained in paragraph 4, two numerical models have been used to simulate the shock wave mitigation by a bubble curtain. Hence, the second model takes into account the experimental gas fraction heterogeneity whereas the first model is based on an homogenous gas fraction profile. This profile has been determined regarding the gas fraction area conservation where the curtain width δ is taken between the two curtain edges having gas fractions of 0.5%.
As a result, a curtain width of 5,6 ±0. 2 cm and the gas fraction profile above (Fig. 5) are implemented in the Model 2 whereas in Model 1 δ is equal to 3,7 cm and α is about 5.69%.
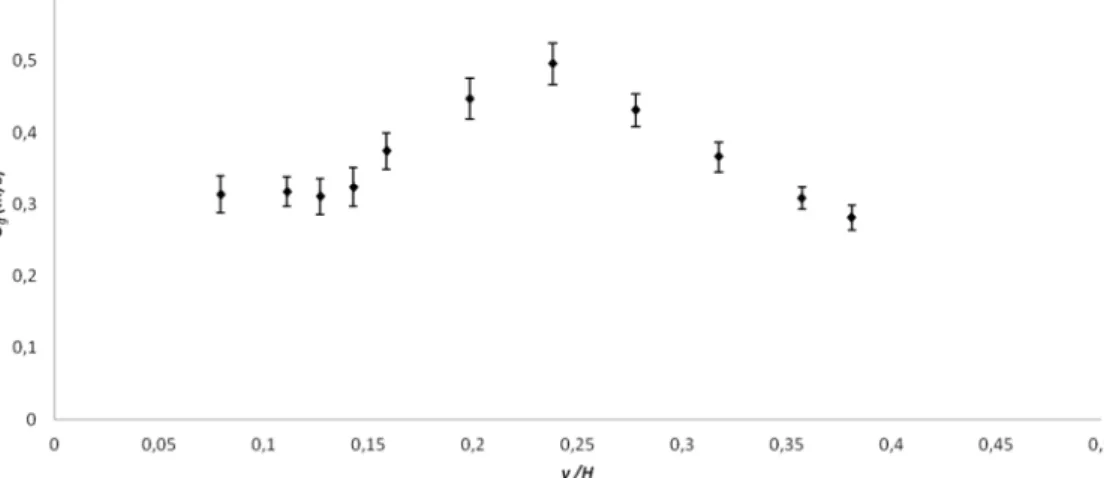
Fig. 6 Mean bubble rising velocity profile at depth 6.6 cm and inner flow of 11.75 L/min.
Fig. 7 Mean bubble size profile at depth 6.6 cm and inner flow of 11.75 L/min.
Fig. 7 confirms that the bubble population in the curtain is quite monodisperse, the bubble diameter being around 1.8 mm ± 10 % all along the profile.
This experimental approach, by using optical probes, gives the characteristics of the curtain, namely the curtain width, the gas fraction profile and the bubble size. Those are the first three input parameters that have to be given in the numerical model, presented in paragraph 4, in order to calculate the damping of an incident shock wave by the bubbly media. The last input parameter that has to be determined is this incident pressure signal.
3. Shock wave measurements
3.1. Underwater shock wave measurement
The underwater shock wave resulting from the propagation after impact has been recorded by the T11 sensor (Fig. 8). Despite the fact that the number of shots was limited, successful shots show an acceptable reproducibility on the time of arrival at the sensor, (around 250 µs) and the peak amplitude (about 10 % of variation).
Fig.8: Overpressure signal recorded by the T11 gauge without bubble curtain.
Introducing the sound level notations used by Rustemeier et al. (2012), the incident shock wave energy is given in decibel relative to a reference pressure p0 of 1 µPa by the Sound
Exposure Level (SEL) defined with an integral between two times T1 and T2 (normalized to a
T0 = T2 – T1 period) with Eq. 5.
&'( = 10 log #,-10. /.00 2% (5)
Meanwhile, the amplitude is characterized by the Peak Level (PL) defined with Eq. 6.
3( = 20 log 45.6 75
. 8 (6)
Where ppeak is the absolute pressure peak.
In the case of the inner signal presented in figure 8, the peak level is equal to 223.3 dB.re.1µPa and the sound exposure level is about 199 dB.re.1µPa.
3.2. Shock mitigation by bubble curtain
Shots have been performed at the same velocity impact, with the bubble curtain described in paragraph 2.3.3. Figure 9 shows the pressure recorded by the gauge. The signal of the arrival of the first shock is hardly perceptible among the noise and may not be reproducible enough since it is trigged by the photodiode barriers that imply a long recording time with a large uncertainty on the time of arrival.
Fig.9: Pressure recorded by the gauge with the presence of the bubble curtain.
In the case of the signal recorded by the gauge in presence of the bubble curtain, the peak level is equal to 95 dB.re.1µPa.
The mitigation procured by the bubbles is about 48 dB which appears very important. However, the characteristic length of the incident shock (shock thickness) is of the order of several mm since it is a very short impulse, while the thickness of the bubble curtain is 5.6 cm with bubble radius of 1,8 mm, of the order of magnitude of the shock itself. The impedance mismatch between the curtain and the water is likely to cause the quasi total reflection of the incident shock which almost does not pass through bubbles.
4. Numerical model of mitigation
In the present section, the model developed by Grandjean (2012) is applied to the simulation of shock attenuation by a bubble curtains. Grandjean (2012) carried out similar calculations for shock signal corresponding to underwater explosion. Here, the bubble curtains characteristics determined previously (section 2) and the pressure signal recorded without bubble curtain (fig. 8) have been used as input parameters.
4.1. Models presentation and assumptions
4.1.1. Homogeneous bubbly liquid model
Grandjean (2012) has developed and implemented in an explicit Lagrangian Finite Element code (ABAQUS/explicit) a model of shock wave propagation in bubbly liquids (see also Grandjean et al. (2012)). This model is based on homogenization techniques and aims to replace the heterogeneous bubbly media at micro-scale by an equivalent homogeneous fluid. The model accounts for thermal transfers between bubbles and the liquid, liquid compressibility and bubble dynamic effects. It should be noted that Grandjean (2012) also proposed an extension of this models 1 and 2 taking bubble fission phenomenon into account. Hovewer, due to the relatively low pressure amplitudes considered in the present study, bubble fission is unlikely to occur and will not be taken into account in the present study.
-0,06 -0,04 -0,02 0 0,02 0,04 0,06 0,08 10 15 20 25 30 P re ss u re ( B a r) time (ms)
In the model, the liquid, with a density ρL and a dynamic viscosity µ, is supposed isothermal
(constant temperature TL), whereas the bubble gas is considered non-condensable and to obey
the ideal gas law. Furthermore, it is assumed that bubbles remain spherical during deformation and that there is no relative displacement between bubbles and the surrounding liquid (no slip assumption). With these hypotheses, the evolution of the bubble radius is described by the following differential equation:
3 = 9:− < =>>? #1 − @ 1 A% + B>C² #1 − @ 1 A+,@DA%E − 4µG GC 1 − @ − BH G (7)
where P, pb, a , < and σ respectively denote the macroscopic pressure, the pressure inside the
bubble, the bubble radius and the surface tension coefficient. The computation of the bubble pressure evolution, accounting for thermal exchanges with the liquid, is described in (Grandjean, 2012) and (Grandjean et al., 2012).
The effect of liquid compressibility is taken into account at the macroscale, through the following relationship (Grandjean et al., 2012):
3 = I #1 −,JK,JK L2M% (8)
where χL is the liquid bulk modulus, α0 is the initial gas volume fraction and M is the
deformation gradient.
The (macroscopic) continuity and balance of momentum equations are written in Lagrangian form as:
= L2M (9)
<$N$/ = −∇3 (10)
With U the velocity vector of a material point.
4.1.2. Void volume fraction distribution within the curtain.
Two different models of bubble curtain have been used in the present study. The
model 1 assumes that the gas volume fraction distribution is homogeneous in the bubble
curtains, while model 2 considers the measured (heterogeneous) distribution (see Fig. 5).
4.2 Result analysis
The results of 1D simulations of the interaction of a pressure wave with a bubble curtain are presented in this section. The characteristics of the bubble curtain and of the incident pressure wave were presented in section 2.3.3 and 3.1, respectively. The pressure histories after the bubble curtain, corresponding to Model 1 and 2, are displayed in Fig. 11, whereas a zoom on beginning of the incident pressure signal is plotted in Fig. 10.
Fig. 10 Overpressure signal recorded by the T11 gauge without bubble curtain; zoom on the [240-400 µs] interval.
Fig. 11 Overpressure with bubble screen on given by model 1 (blue) and 2 (blue).
As a result the homogeneous model (Model 1) gives a SEL and a PL attenuation (see Eqs. 5 and 6) of 18.7 dB.re.1µPa and 12.2 dB.re.1µPa, respectively. With the heterogeneous model (Model 2), these quantities are equal to 21.4 dB.re.1µPa and 13.3 dB.re.1µ Pa.
The two models give peak pressure of the same order and, as expected, the model 2 which takes into account higher and sudden curtain impedance mismatch, induces more wave reflections than the first model. Comparing with the experimental results presented in figure 9, the mitigation obtained with the simulation is underestimated with a factor of almost 10.
4. Conclusions
As a result, a method involving experimental set-ups and numerical simulations has been elaborated in order to characterize the shock wave mitigation by a bubble curtain.
The description of a process, with experimental setup and numerical simulations, has been described in order to estimate shock wave mitigation with an as realistic as possible bubble curtain.
First the bubbly media has been characterized by optical probes measuring gas fraction profiles, curtain widths and bubble diameters. In a second time, shock wave pressure histories have been recorded with the experimental setup presented in section 2.1, with and without bubble curtain. Finally, the shock wave mitigation has been simulated with models developed by Grandjean (2011, 2012) and compared to measurements, by implementing realistic characteristics of the bubble curtain, obtained from optical probes measurements.
The computed results are the less optimistic. Two models have been considered, respectively with an homogeneous (model 1) and with an heterogeneous (model 2) gas volume fraction distribution. Both models lead to comparable Sound Exposure Level attenuation of about 20 dB while the attenuation is around 13 dB if the Peak Level is considered. However, the numerical results do not agree perfectly with the recorded signal of pressure after the curtain. Experimental records reveal an attenuation of about 48 dB. However, it should be noted that pressure waves emerging from the bubble curtain are difficult to record. Indeed, the peak pressure is of the order of magnitude of the ambient pressure fluctuation (noise), so the oscilloscope cannot be trigged by the rising front of the signal.
However, if correct, this strong mitigation can be due to both the important impedance mismatch between media and to the shortness of the wave impulse, that lead to almost all the incident shock wave being reflected by the bubble curtain. Hence a comparison between experimental records and simulation outputs appears to be intricate.
The direct continuation of this work would be first to confirm experimental records obtained with curtain. Then the purpose would be to generate a shock wave with a longer impulse and/or characterize another bubble curtain with lower gas fractions. Thereby the mitigation models could be used with more efficiency and compared to experimental results.
Aknowledgement
This study is a part of the RESIBAD project (REduction of Sounds in Immersion by BiphAsic Drape) funded by the “Aile Marine (Iberdrola)” consortium in the frame of off-shore wind farms installation in France. The authors would like to thank the “Ailes Marine” consortium for its financial support. The authors would also like to thank the DGA TN center of Toulon, France, for theirs good advices.
References
Ando, K., Colonius, T., Brennen, C.E., 2009, Shock Propagation in Polydisperse Bubbly Flows, 7th International Symposium on Cavitation, Ann Arbor, Michigan, USA.
Ando, K., Sanada, T., Inaba, K., Shepherd, J., Colonius, T. et Brennen, C.E, 2011, Shock Propagation Through a Bubbly Liquid in a Deformable Tube, J. Fluid Mech., 671:339-363.
Bulson, P.S., 1968, The Theory and Design of Bubble Breakwaters, Coastal Engineering Proceedings, 1:11.
Clark, N.N., Turton, R., 1988, Chord Length Distributions Related to Bubble Size Distributions in Multiphase Flows, Int. J. Multiphase Flow, 14(4):413–424.
Dahl, P. H. and Reinhall, P. G., 2013, Beam Forming of the Underwater Sound Field from Impact Pile Driving, J. Acoust. Soc. Am. Express Letters, 2013.
Domenico, S., 1982, Acoustic Wave Propagation in Air-Bubble Curtains in Water - Part II : Field experiment. Geophysics, 47(3):354–375.
Espinosa, H. D., S. Lee, N. Moldovan, 2006, A Novel Fluid Structure Interaction Experiment to Investigate Deformation of Structural Elements Subjected to Impulsive Loading,
Experimental Mech., 46(6):805-824.
Drumheller, D.S., Kipp, M.E., Bedford, M., 1982, Transient Wave Propagation in Bubbly Liquids, J. Fluid Mech., 19:347-365.
Francken, F., 2011, Dispersion of Critical Substances from Dumped Ammunition in Marine Sediments on Paardenmarktsite, Belgium, Miremar NABU Conference, Neumunster, Germany.
Gabillet, C., Colin, C., Fabre, J., 2002, Experimental Study of Bubble Injection in a Turbulent Boundary Layer, Int. J. Multiphase Flow, 28:553–578.
Grandjean, H., Jacques, N., Arrigoni, M., Zaleski, S., 2011, Damping of Underwater Wave Pressure by Bubble Curtain, Safer seas, Brest, France.
Grandjean, H., 2012, Propagation d’une Onde de Choc dans un Liquide Aéré: Modélisation et Application aux Rideaux de Bulles, PhD thesis, ENSTA Bretagne, 2012.
Grandjean, H., Jacques, N., Zaleski, S., 2012, Shock propagation in liquids containing bubbly clusters: a continuum approach, J. Fluid Mech., 701:304-332.
Kameda, M., Shimaura, N., Higashino, F., Matsumoto Y., 1998, Shock Waves in a Uniform Bubbly Flow, Phys. Fluids, 10(10):2661-2668.
Mäkiharju, S.A., Gabillet, C., Paik, B.G., Chang, N.A., Perlin, M., Ceccio, S.L., 2013, Time-Resolved Two-Dimensional X-ray Densitometry of a Two-Phase Flow Downstream of a Ventilated Cavity, Exp. Fluids, 54:1561.
Meyers M.A., 1994, Dynamic Behaviour of Materials, Academic Press, 1994 OSPAR Quality Status Report, 2010, http://qsr2010.ospar.org/en/ch09_09.html
Rude, G., Lee, J., 2007, Performance Evaluation of the Roach Cove Bubble Screen Apparatus. Report of the Defense Research and Development Canada.
Rustemeier, J., Grießmann, T., Rolfes, R., 2012, Underwater Sound Mitigation of Bubble Curtains with Different Bubble Size Distributions, 11th European Conference on Underwater Acoustics, Edimbourg, Scotland.
Schmidtke, E., Nützel, B., Ludwig, S., 2009, Risk Mitigation for Sea Mammals – The Use of Air Bubbles Against Shock Waves, NAG/DAGA 2009, Rotterdam, Netherland.
Surov, V.S., 1999, Interaction of a Shock Wave with a Bubble Screen, Tech. Phys., 44:37-43. Sychev, A.I., 2006, Transformation of Shock Waves at the Interface of Bubble Media, Combustion, Explosion, and Shock Waves, 42: 210-216.
Van Wijngaarden, L., 1970, On the Structure of Shock Waves in Liquid-Bubble Mixtures, Appl. Sci. Res., 22(6):366-391.
![Fig. 10 Overpressure signal recorded by the T11 gauge without bubble curtain; zoom on the [240-400 µs]](https://thumb-eu.123doks.com/thumbv2/123doknet/7424323.219308/12.892.150.707.108.346/fig-overpressure-signal-recorded-gauge-bubble-curtain-zoom.webp)
