EDITH LACHANCE
FONDEMENTS ECOSYSTÉMIQUES DES COUPES A
RÉTENTION DE BOUQUETS SUR LA CÔTE-NORD
Mémoire présenté
à la Faculté des études supérieures et postdoctorales de l'Université Laval dans le cadre du programme de maîtrise en sciences forestières
pour l'obtention du grade de maître es sciences (M. Sc.)
DEPARTEMENT DES SCIENCES DU BOIS ET DE LA FORET FACULTÉ DE FORESTERIE, DE GÉOGRAPHIE ET DE GÉOMATIQUE
UNIVERSITÉ LAVAL QUÉBEC
2012
Résumé
La coupe à rétention de bouquets est un type de coupe à rétention variable visant à atténuer l'impact de la coupe totale sur la diversité biologique et sur la qualité visuelle des paysages. Puisque l'utilisation des types de coupe associés à l'aménagement écosystémique est encore récente au Québec, très peu d'études ont été réalisées afin d'en vérifier l'impact réel sur les écosystèmes forestiers. La présente étude vise à déterminer si les bouquets réussissent à préserver des attributs qui sont perdus lors de coupes traditionnelles en comparant la structure et les communautés de plantes de sous-bois retrouvées dans ces deux milieux. Nos résultats indiquent que la diversité végétale des deux milieux est semblable. Cependant, l'approche par traits fonctionnels montre que la tolérance à l'ombre semble jouer un rôle significatif dans la répartition des espèces entre les deux environnements. À
court terme, la coupe à rétention de bouquet devrait également préserver une plus grande quantité de bois mort qu'une coupe avec protection de la régénération et des sols (CPRS), ce qui pourrait avoir des effets bénéfiques à long terme pour le maintien de la biodiversité.
Avant-Propos
Ce projet de maîtrise s'intègre dans le cadre des travaux effectués par la Chaire de recherche industrielle CRSNG - Université Laval en sylviculture et faune. La chaire a été créée dans le but d'approfondir les connaissances sur la forêt boréale de la Côte-Nord afin d'améliorer l'aménagement durable des forêts. Ce mémoire de maîtrise comporte une insertion d'article. Il a été rédigé sous la direction des Docteurs David Pothier (Université Laval) et Mathieu Bouchard (MRN). Cet article, pour lequel je suis première auteure, sera soumis pour publication dans une revue avec révision par les pairs.
Tout d'abord, je souhaite remercier mon directeur David Pothier pour sa grande disponibilité, son écoute, ses suggestions, sa simplicité ainsi que son sens de l'humour. Merci de m'avoir donné la chance d'entreprendre ce projet et de m'avoir encouragé jusqu'à la fin.
Je tiens aussi à remercier mon co-directeur, Mathieu Bouchard, pour ses conseils et son support. Merci pour les nombreux commentaires constructifs et pour avoir su apporter un autre point de vue. Malgré qu'on ne se soit pas vu souvent, Mathieu a toujours été disponible et à l'écoute.
Cette étude n'aurait pas vu le jour sans la Chaire de recherche industrielle CRSNG-Université Laval en sylviculture et faune, qui a fourni le soutien financier et qui a mis à ma disposition de nombreuses ressources. Merci aux professionnels de recherche Gabriel Émond et Philippe Duval. Merci aux partenaires industriels (Arbec, Boisaco, Produits forestiers Résolu), pour l'accès aux traitements sylvicoles et pour le partage de données. Je tiens aussi à remercier Gaétan Daigle, Marc Mazerolle et Julien Béguin pour leur aide avec les nombreuses analyses statistiques qui ont été accomplies au cours de ma maîtrise. Merci à Pierre Racine et Stéfano Biondo pour leur aide logicielle. Je remercie également Martine Lapointe pour les nombreux conseils, services et connaissances infinies de la flore! Merci à William F.J. Parsons pour la révision linguistique. Merci au Centre d'étude de la
Ill
forêt pour l'aide financière consentie afin de participer à des congrès ainsi que pour les nombreuses ressources humaines, pour les conférences et les 5 à 7, bien entendu!
Un gros merci à ceux qui m'ont assisté sur terrain, Fabien Lanteigne, Gabriel Emond et Jean-François Guay. Sans votre aide, rien de tout ceci n'aurait été possible. Je crois qu'on peut dire aujourd'hui qu'on a survécu aux mouches noires!
Merci à mes amis et collègues du Laboratoire de sylviculture et al. pour toute l'aide apportée, pour les nombreuses discussions, les encouragements et les blagues de geek. Je suis enchantée d'avoir pu passer ces moments de labeur à vos côtés.
Merci à ma famille et à mes proches d'avoir cru en moi et de m'avoir apporté les encouragements nécessaires afin de mener à bien ce projet. Un merci spécial à ma mère qui m'a montré par son parcours atypique et toute la détermination, le courage et la patience dont elle a fait preuve que tout est possible quand on y croit.
Finalement, je tiens à remercier du fond du cœur mon conjoint, Jean-Philippe Roussy, qui a toujours été là pour moi tout au long de ce projet. Merci pour ton écoute, ton réconfort, tes encouragements et ton appui sans borne.
Table des matières
Résumé i Avant-Propos ii Table des matières iv Liste des tableaux v Liste des figures vi
Introduction 1 Aggregated retention: an ecosystem-based management approach in Quebec's boreal forest
5 Abstract 6 Résumé 7 1. Introduction 8 2. Methods 11 2.1 Study Area 11 2.2 Group retention cuts 13
2.3 Field sampling 14 2.4 Plant traits 16 2.5 Diversity indices 16 2.6 Statistical analyses 17
3. Results 19 3.1 Species abundance and richness 19
3.2 Species Traits 22 3.3 Dead wood 23 3.4 Regeneration 26 4. Discussion 28 4.1 Community response 28 4.2 Dead wood 29 4.3 Regeneration 30 5. Management Implications 32 6. Acknowledgements 33 7. References 34 Conclusion 40 Bibliographie 42
Liste des tableaux
Table 1. Means (± SD) for the principal characteristics of the study plots. For each characteristic (column), a different letter indicates a significant difference at P < 0.05
(mixed-model ANOVA) 20 Table 2. Mean percentage cover of species covering 0.25% or more of the plots in tree
retention groups and clearcut areas 21 Table 3. Results of mixed-model ANOVA 22 Table 4. Dead wood abundance in clearcuts. For each category (column) a different letter
Liste des figures
Figure 1. Location of the study sites, northeastern Quebec, Canada 12 Figure 2. Optimal distance between two tree retention groups following harvest. (Modified
from Pouliot et al. 2010) 14
Figure 3. Mean values of each level of species light requirement for both environments.
The error-bars correspond to standard errors (SE) ; 23 Figure 4. Snag basal area in each decay class for each environment. Significant differences
(P < 0.05) for means (± SE; n = 90 per environment) among classes are indicated by
different letters 24 Figure 5. Volume of CWD in each decay class for each environment. Significant
differences (P < 0.05) for means (± SE; n = 90 per environment) among classes are
indicated by different letters 25 Figure 6. Seedling number per height class for each environment. Significant differences
(P < 0.05) for means (± S.E; n = 90 per environment) among classes are indicated by
Introduction générale
Ces dernières années, un intérêt toujours grandissant s'est développé autour de l'aménagement écosystémique et il deviendra sans doute un sujet de premier plan avec la nouvelle loi sur l'aménagement durable du territoire forestier. L'aménagement écosystémique est une approche d'aménagement forestier s'inspirant de la dynamique naturelle des forêts (Bergeron et al. 1999). Cette approche vise à maintenir les écosystèmes sains et résilients en diminuant les écarts entre les paysages naturels et aménagés. Son but est d'assurer, à long terme, le maintien de la biodiversité ainsi que la préservation des multiples fonctions de l'écosystème et, par conséquent, de conserver les avantages sociaux et économiques que l'on en tire (Bergeron et al. 1999, Gauthier et al. 2008).
L'intérêt envers cette méthode découle du fait qu'un aménagement forestier visant seulement la production soutenue de matière ligneuse est en porte-à-faux avec la nécessité de préserver la diversité biologique (Halpern et al. 2005). Les professionnels du domaine forestier ont, depuis plusieurs années, observé la transformation du paysage forestier causée par l'augmentation des activités forestières. Les effets de cette intensification des pratiques touchent la structure d'âge des forêts à l'échelle du paysage, la composition végétale, la structure interne des peuplements, la configuration spatiale aux échelles du peuplement et du paysage ainsi que la productivité des sols forestiers (Gauthier et al. 2008).
Dans la pessière à mousses de l'est du Québec, la principale perturbation naturelle de grande envergure est le feu (Bouchard et al. 2008). Le feu est caractérisé par une intensité variable qui peut produire une mosaïque de zones brûlées à différents degrés et de zones non brûlées (Eberhart et Woodard 1987, Hunter 1993, Kafka et al. 2001, Bergeron et al. 2002, Angers et al. 2011). Un feu va aussi laisser derrière son passage un large éventail de legs biologiques tels que des chicots et des débris ligneux au sol, en plus des agglomérations d'arbres vivants résultant des zones non brûlées (Gauthier et al. 2001, Kafka et al.2001). Les chicots peuvent servir de nourriture ou d'abris à de nombreux organismes, comme les oiseaux et les insectes (Grove 2002, Martin et al. 2004, Lowe et al. 2011). Les débris ligneux au sol sont utilisés par les insectes et les bryophytes et sont aussi
un substrat préférentiel pour l'établissement et le développement de nombreuses espèces végétales (Simard et al. 2003, Robert 2010). De plus, les débris ligneux fortement décomposés jouent un rôle important dans la dynamique des sols (Means et al. 1992, Brais et al. 2005). De ce fait, les débris ayant atteint différents stades de décomposition sont également souvent associés à des communautés animales ou végétales particulières, et présentent une valeur économique qui varie puisque seul le bois sec et sain a un bon potentiel pour la transformation (Barette et al. 2012). À l'échelle du peuplement, les îlots d'arbres non brûlés peuvent servir de banque de graines (Zasada 1971) et de refuge pour de nombreux insectes, micro-organismes, mammifères et espèces à faible taux de dispersion (Bendell 1974, Neary et al. 1999, Gandhi et al. 2001, Swengel 2001). Ces îlots non brûlés peuvent aussi agir à titre de pierre de touche (« stepping stone ») pour la faune ayant à traverser un paysage perturbé (Franklin et al. 1997). Par conséquent, la structure héritée de l'ancien peuplement joue un rôle important pour la conservation de la biodiversité.
La rétention d'une quantité variable d'arbres vivants ou morts, groupés ou non, est une des méthodes qu'on peut utiliser en aménagement écosystémique pour atténuer l'impact de la coupe totale. Cette rétention vise à conserver, de façon permanente, certains éléments structuraux qui étaient présents dans le peuplement avant la coupe (Mitchell et Beese 2002). Ces éléments peuvent être des arbres vivants ou morts, des débris ligneux, ou tout autre élément jugé essentiel pour le bon fonctionnement de l'écosystème (Sougavinski et Doyon 2002). Ces éléments constituent alors des legs biologiques pour le futur peuplement. Le fait de préserver ces attributs pendant au moins une révolution complète est aussi une manière de reproduire jusqu'à un certain point l'effet des perturbations naturelles, comme le feu, qui laissent aussi des legs biologiques après leur passage (Sougavinski et Doyon 2002).
Il existe plusieurs méthodes pour conserver des legs biologiques et l'une d'elles est la coupe à rétention de bouquets. Cette coupe correspond à une coupe avec protection de la régénération et des sols (CPRS) dans laquelle des bouquets d'arbres marchands non récoltés sont laissés intacts et représentent 5 % de la superficie récoltée (Leblanc et Pouliot 2011). Selon les lignes directrices du Ministère des Ressources naturelles du Québec
(MRNQ), la superficie des bouquets peut varier de 150 à 300 m2. Ce type de coupe vise
principalement à (1) maintenir une irrégularité dans la structure du peuplement à long terme, (2) conserver du bois mort et en permettre le recrutement, (3) maintenir l'habitat d'espèces à faible capacité de dispersion, (4) créer des foyer de recolonisation, (5) favoriser la préservation d'essences forestières en raréfaction, telles que l'épinette blanche (Picea glauca (Moench) Voss) ou le pin blanc (Pinus banksiana Lambert), lorsqu'elles sont présentes, et (6) minimiser l'impact visuel négatif d'une CPRS (Leblanc et Pouliot 2011). Étant donné que la coupe à rétention de bouquet est une méthode encore récente au Québec, très peu d'études ont documenté les effets réels de son application sur les écosystèmes forestiers.
Les petits îlots forestiers post-coupe peuvent présenter un bon potentiel de préservation des plantes de sous-bois (Shafer 1995, Nelson et Halpern 2005). Par contre, ces bienfaits peuvent être diminués par les effets de bordure (Murcia 1995, Moen et Jonsson 2003). Les conditions de vent, de lumière et d'humidité y sont souvent bien différentes de celles à l'intérieur de la forêt. Les communautés de plantes de sous-bois sont susceptibles d'être affectées par les changements de conditions qui surviennent à la suite d'une coupe à rétention variable, même si elles se trouvent dans des îlots de rétention. Par contre, les effets de bordures n'apparaissent pas nécessairement immédiatement après la création d'une lisière, mais plutôt progressivement au fils des ans (Matlack 1994). Il est aussi anticipé que les espèces végétales ayant certaines caractéristiques écologiques, comme l'intolérance à l'ombre, vont réagir plus rapidement que d'autres à l'effet de bordure (Harper et al. 2005). La végétation de sous-bois est un bon indicateur du statut des forêts, considérant qu'elle est directement influencée par les arbres qui forment le couvert forestier (Macdonald et Fenniak 2007 Roberts, 2007).
L'objectif général de cette étude est de déterminer si la coupe à rétention de bouquets réussit à préserver des communautés de plantes de fin de succession et la présence de bois mort ayant atteint différents stades de décomposition. Cela a été fait en comparant les communautés de plantes de sous-bois retrouvées dans le bouquet et sur le parterre de coupe. Nous avons étudié la réaction à court terme (une à cinq années après la coupe) des
espèces de sous-bois, en termes de biodiversité et de caractéristiques physiologiques. Nous avons également comparé la quantité d'arbres vivants et morts dans les bouquets et dans les zones de coupes adjacentes, ainsi que les stades de décomposition du bois mort. Nous avons formulé les hypothèses suivantes :
1) Les bouquets, de par leur milieu plus fermé et non perturbé, contiendront une plus grande abondance d'espèces de fin de succession que le parterre de coupe.
2) Les bouquets contiendront un plus grand volume de bois mort (chicots et débris ligneux) que le parterre de coupe. Les arbres morts présents dans les bouquets présenteront également une plus grande diversité de classes de décomposition.
Aggregated retention: an ecosystem-based management
approach in Quebec's boreal forest
Abstract
In a context of ecosystem-based management, several types of alternatives to cutting with protection of regeneration and soils (CPRS) have been designed to maintain healthy and resilient ecosystems. Tree group retention cutting is one of these new silvicultural methods that aim to reproduce the effect of fires of varying severity, which can leave residual islands of vegetation.
Since ecosystem management is still a recently adopted policy in Quebec, very few studies have evaluated the real impact of its application. The objective of this study is to determine if tree retention groups that remain after aggregate retention cutting can preserve attributes that are normally lost with traditional harvesting. This goal was assessed by comparing the vegetation structure and composition within tree retention groups and adjacent clearcut areas. The study was conducted in 15 tree group retention cuts located in the northeastern boreal forest of Québec, Canada. Six pairs of plots were established within each cut, each pair being formed of a plot in a tree retention group and a plot in an adjacent clearcut area (outside the logging trails). An inventory of the vegetation structure and composition was done in each of these plots. The floristic composition was then characterized using biodiversity indices and functional traits. The data were analyzed using mixed and multivariate statistical models.
Our results indicate that plant diversity of the two environments is similar. However, the great variability observed between cuts could mask differences between plant communities. The functional trait approach shows that shade tolerance appears to play a significant role in species distributions between the two environments. In the short-term, the tree group retention cut should also retain a greater quantity of dead wood than CPRS, which could have beneficial effects over the long-term for the maintenance of biodiversity. This study constitutes a first step towards verifying of the attainment of certain objectives of variable retention in the boreal forest of northeastern Canada.
Résumé
Dans un contexte d'aménagement écosystémique (AE), plusieurs types de coupes alternatives à la coupe avec protection de la régénération et des sols (CPRS) ont été conçus afin de maintenir les écosystèmes sains et résilients. La coupe à rétention de bouquets est l'une de ces nouvelles méthodes sylvicoles visant à reproduire l'effet de feux de sévérité variable qui font en sorte de laisser une partie du peuplement forestier intact.
Étant donné que l'utilisation des types de coupe associés à FAE est encore récente au Québec, très peu d'études ont été réalisées afin d'en vérifier l'impact réel sur les écosystèmes forestiers. La présente étude vise à déterminer si les bouquets réussissent à préserver des attributs qui sont perdus lors de coupes traditionnelles en comparant la structure et les communautés de plantes de sous-bois retrouvées dans ces deux milieux. L'étude s'est déroulée dans 15 coupes à rétention de bouquets de la Côte-Nord, plus précisément dans le sous-domaine de la pessière à mousses de l'est. Deux placettes appariées ont été établies, l'une dans un bouquet et l'autre sur le parterre de coupe adjacent (hors des sentiers de débardage), pour un total de six paires par coupe. Un inventaire incluant la structure du peuplement, les espèces arborescentes ainsi que la végétation de sous-bois a été fait dans chaque placette des deux milieux étudiés. La diversité des communautés végétales fut ensuite caractérisée à l'aide d'indices de biodiversité et de traits fonctionnels. Les données furent analysées à l'aide de statistiques multivariées et de modèles mixtes hiérarchiques. Nos résultats indiquent que la diversité végétale des deux milieux est semblable. Toutefois, il existe une grande variabilité entre les coupes, ce qui pourrait masquer d'éventuelles différences de communauté d'espèces. L'approche par traits fonctionnels montre que la tolérance à l'ombre semble jouer un rôle significatif dans la répartition des espèces entre les deux environnements. À court terme, la coupe à rétention de bouquet devrait également préserver une plus grande quantité de bois mort qu'une CPRS, ce qui pourrait avoir des effets bénéfiques à long terme pour le maintien de la biodiversité. Cette étude constitue un premier pas vers la vérification de l'atteinte de certains objectifs écosystémiques de la rétention variable pour les forêts de la Côte-Nord.
1. Introduction
In recent years, an ever-growing interest has developed regarding ecosystem-based management, which aims to maintain healthy and resilient ecosystems by focusing on the reduction of differences between natural and managed landscapes with the long-term goal of maintaining ecological functions (Gauthier et al. 2008). Interest in this method stems from the fact that, by focusing mostly on timber production, intensive silvicultural practices are in conflict with the preservation of biodiversity (Franklin et al. 2002). Ecosystem-based management thus can be seen as a way of reconciling operational harvesting with long-term maintenance of ecosystem processes by having multiple objectives when harvesting.
In the northeastern boreal forest of Canada, fire is the principal natural stand-replacing disturbance (Bouchard et al. 2008). The varying intensity of fires may result in a mosaic of areas that are burned to differing degrees interspersed with unburned patches (Eberhart and Woodard 1987, Hunter 1993, Kafka et al. 2001, Bergeron et al. 2002, Angers et al. 2011). A fire can also leave a wide range of biological legacies, such as snags and coarse woody debris (CWD), in addition to the green tree agglomerations that are created by unburned patches of forest (Gauthier et al. 2001, Kafka et al.2001). Standing dead trees or snags can serve as food or shelter for different organisms such as birds, insects, and fungi (Grove 2002, Martin et al. 2004). CWD is used by insects and bryophytes and is also a preferred substrate for the establishment of numerous plant species (Simard et al. 2003, Robert 2010). In addition, highly decomposed CWD plays an important role in soil dynamics (Means et al. 1992, Brais et al. 2005). Thus, CWD do not all have the same value, biologicaly speaking, every stage of decomposition hosting its own biodiversity, and economicaly speaking, only the dead and sound wood (recently dead stems) has a good transformation value (Barette et al. 2012). Patches of unburned trees can act as a seed bank (Zasada 1971) and as an important refuge for a number of insects, microorganisms, birds, mammals, and species with low dispersal rates (Bendell 1974, Neary et al. 1999, Gandhi et al. 2001, Swengel 2001). These patches can also serve as stepping stones for wildlife that must cross perturbed landscapes (Franklin et al. 1997). Therefore, the structure inherited from the previous stand plays an important role in the preservation of biodiversity.
Variable retention cuts have been proposed as a means of emulating the effects of natural fires. In the boreal forest of eastern Canada, one of these cuts typically consists of preserving 5% of the initial forest, which is retained in tree groups scattered over the harvested area. This type of retention cutting aims at (1) maintaining long-term irregular structure, (2) preserving dead wood and allowing its recruitment into the future stand, (3) preserving undisturbed zones to maintain the habitat of species with very low dispersal abilities, (4) creating recoIonization nuclei, (5) promoting the preservation of rare tree species when present, and (6) reducing negative visual impacts (Leblanc and Pouliot 2011). Since tree group retention cutting is still a recent innovation in eastern Canadian boreal forest, very few studies have documented the real impacts of its application.
Small forest aggregates that are left after retention cuts can have high preservation potential for understory plants (Shafer 1995, Nelson and Halpern 2005). However, their benefits can be reduced by edge effects (Murcia 1995, Moen and Jonsson 2003). Wind, light and humidity conditions are often very different at the forest edge compared to those in the forest interior. Since the understory is a good indicator of forest status because it is directly influenced by canopy trees (Macdonald and Fenniak 2007, Roberts 2007), it will inevitably be affected by environmental changes that occur following harvesting operations, even if the understory is located in tree retention groups. However, edge effects on plant populations are not necessarily expected to be exerted immediately, but rather to be manifested progressively over time (Matlack 1994). Plant species exhibiting specific traits, such as shade intolerance, will likely respond faster than other species to canopy removal (Harper et al. 2005).
The general objective of this study was thus to determine if tree group retention cutting can preserve communities of late-successional plants, together with dead wood in varying stages of decomposition. This goal was mainly addressed by comparing the understory communities and structure within retained and harvested areas. We examined the short-term response (one to five years post-harvest) of understory vegetation in short-terms of its diversity and physiological characteristics. We also compared live and dead tree composition, together with their decay status, of the retention groups with that of adjacent
10 clearcut areas. We expected that: 1) the retention groups, having an undisturbed and more closed environment, will retain more late-successional species than would clearcut areas; 2) the tree retention groups will contain a greater volume of dead wood (snags and CWD) than would the adjacent clearcut areas and they will have a greater diversity of decay status.
2. Methods
2.1 Study Area
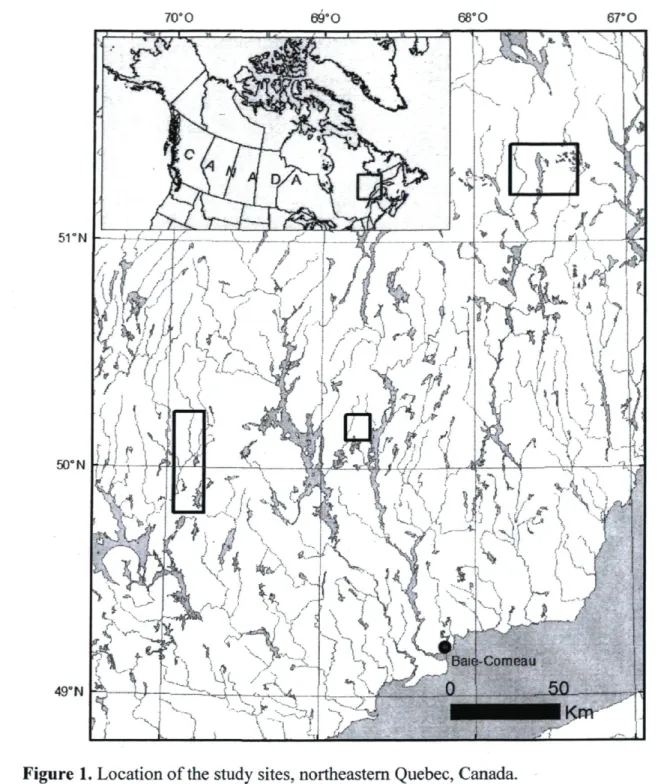
The study was conducted in northeastern Canadian boreal forest, specifically in the North Shore administrative region of Quebec, Canada (Fig. 1). To adequately cover the east-west variability inherent to this large territory, study sites were located in three sectors (50°0'N, 69°51'W, 50°11'N, 68°45'W, and 51°21'N, 67°25'W; Fig. 1) of the eastern black spruce-feather moss bioclimatic sub-domain (Saucier et al. 1998). The study territory generally exhibits rugged relief, with high hills punctuated by deep valleys that are oriented north-south. The area is part of the Canadian Shield, which is mostly composed of Precambrian rocks that are covered by glacial tills of various thicknesses and by fluvio-glacial deposits (Bouchard et al. 2008). The region has a boreal humid climate, with a mean annual temperature between -2.5 °C and 0.0 °C, and mean annual precipitation between 1000 and
12
70° O 69° O 68° O 67° O
51°N
50° N
49° N
Figure 1. Location of the study sites, northeastern Quebec, Canada.
The three principal natural disturbances that occur on the North Shore are fires, windthrows and outbreaks of spruce budworm (Choristoneura fumiferana (Clemens)). Despite the humid climate, which confers a long fire cycle upon the region (270-500 y), fire has remained the most important natural disturbance (Bouchard et al. 2008). There is an
east-13
west fire frequency gradient, with stands on the eastern end of the gradient having a longer cycle (500 y) due to its colder and wetter climate than stands on the western end (270 y). The mean return intervals of the other natural disturbances are much longer. In the case of stand-replacing windthrows (severe mortality over areas of more than 5 ha), the cycle is about 3900 years (Bouchard et al. 2009), while severe spruce budworm outbreaks occur over a cycle of about 9200 years, based on the last century (Bouchard and Pothier 2010). The forest landscape is dominated by black spruce (Picea mariana (Miller) BSP) and, to a lesser extent, balsam fir (Abies balsamea (L.) Miller). White or paper birch (Betula papyrifera Marshall), trembling aspen (Populus tremuloides Michaux), white spruce (Picea glauca (Moench) Voss), and jack pine (Pinus banksiana Lambert) are minor components of the overstory, but these species can dominate recently disturbed environments. Under natural conditions, balsam fir tends to be more abundant in stands that have been spared from fire for more than 100 years (Bouchard et al. 2008).
2.2 Group retention cuts
A group retention cut is a method of harvest with protection of regeneration and soils, where groups of trees in patches about 150 to 300 m2 in area are left intact between the
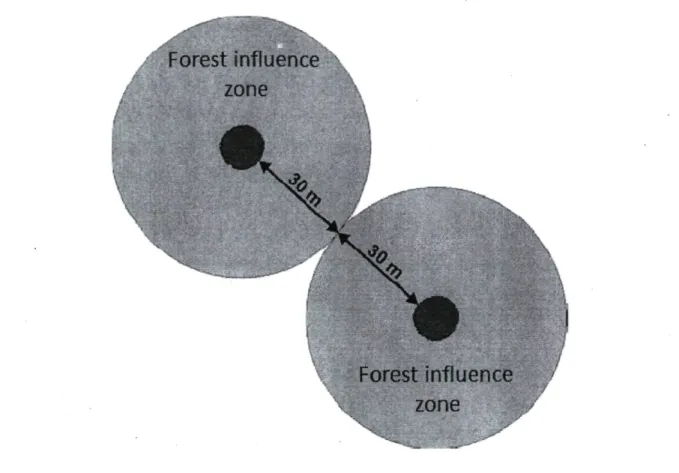
logging trails, which are established every 10 m. The overall cover provided by these groups must be at least 5% of the harvested area and the groups should have a cover type that is representative of the treated stand. Each group must contain a minimum of five trees with a diameter at breast height (DBH, 1.3 m) greater than 9.0 cm and have a multilayered structure with snags, coarse woody debris (CWD), or wildlife trees (Leblanc and Pouliot 2011). The retention groups are evenly distributed over the cut area and are spaced 50 to 60 m from one another. The objective behind this standard is to have at least 70% of the managed area under forest influence (Leblanc and Pouliot 2011). "Forest influence" corresponds to the biophysical effects that the forest stand or individual trees can exert on the surrounding environment (Mitchell and Beese 2002). This influence can be felt at a distance equivalent to twice the average tree height, which corresponds to 30 m in the
boreal forest (Pouliot et al. 2010). Therefore, retention groups should have a maximum spacing of 60 m between them to preserve the forest influence effect (Fig. 2).
14
Forest influence
zone
Forest influence
zone
Figure 2. Optimal distance between two tree retention groups following harvest. (Modified from Pouliot etal. 2010)
2.3 Field sampling
The survey was performed throughout the summer of 2010 in the three sectors of the study area (Fig. 1). Five different group retention cuts were randomly selected in each of the three sectors. These cuts were applied between 2005 and 2009. Six sampling areas were randomly selected in each cut, for a total of 90 sampling areas. Each sampling area was a combination of a tree retention group and an adjacent clearcut zone, which were located 20 m apart. Since 70 to 80% of the harvested area is exempt from machinery traffic, we always established the selected clearcut zones outside the logging trails. While plant communities generally differ between the logging trails and the remainder of the clearcut area (Lorente et
15 al. 2012), we considered that our objectives could only be achieved by comparing tree retention groups with the plant communities found outside the logging trails. In doing so, we verified the capability of tree retention groups to maintain relatively shade tolerant species; consequently we removed the soil perturbation effect from subsequent analyses. Within both the clearcut and tree retention zones of each sampling area, we established a circular 100-m2 plot. The species and the diameter at breast height (DBH, 1.3 m) of all trees
with DBH greater than 1.0 cm were recorded in each plot. The degree of decomposition for dead standing trees with DBH greater than 9.0 cm was assessed using the classification system of Maser et al. (1979), which ranged from 3 (recently dead tree) to 7 (broken dead tree). In addition, all coarse woody debris (CWD) with a small-end diameter greater than 9.0 cm and a length greater than 1 m was measured and classified according to their decay status (Maser et al. 1979). These stages of decomposition ranged from 1 (debris with branches and bark) to 5 (buried debris). The height (m) of three average trees was measured in each plot that had been established in the tree retention groups. The area covered by each tree retention group was determined with a GPS (GPSMAP 60, Garmin). Within each 100 m plot, four 4 m subplots were established in each cardinal direction. In each subplot, floristic composition was determined by assessing the ground cover percentage of each species or group of species when only genera were considered. Genus was used only for
species that had very similar traits (e.g., Vaccinium angustifolium Aiton and V. myrtilloides
Michaux). Percentage cover was estimated using the following classes: 1 (0%); 2 (< 1%); 3 (1-10%); 4(11-20%); 5 (21-30%); 6 (31-40%); 7 (41-50%); 8 (51-60%); 9 (61-70%); 10 (71-80%); 11 (81-90%); and 12 (91-100%). Cover class values were converted to midpoint percentages prior to the calculation of diversity indices. In addition, four 1 -m subplots were established at each cardinal point for regeneration inventory. In each 1 -m subplot, all trees with diameters < 1.1 cm at breast height were identified to species and classified according to the following height classes: A, 0-5 cm; B, 5.1-60 cm; and C, > 60 cm.
16
2.4 Plant traits
A table of functional traits was assembled using the TOPIQ data base (Traits Of Plants In Quebec, see Aubin et al. 2007) for the 59 species or genera that were found in the subplots. The principal traits available from this data bank for our species were: Raunkier life forms, typical maximum height, foliage type, foliage persistence, foliage structure, principal means of reproduction, flowering phenology, seed size, seed dormancy, and light requirement. Except for typical maximum height, all traits were qualitative.
2.5 Diversity indices
Using the mean of the four subplots, diversity of each plot was computed using several indices. First, we computed species richness which corresponds to the number of species found in each plot. Second, we calculated the Shannon diversity index (//'):
//' = -£p,lnpi
[1] where pt is the proportional cover of the r species in the subplot (Whittaker 1972). Third,
we computed the variability in species abundance, or species evenness (Magurran 2003):
/ ' = " ' "max
[2] where / ' is species evenness, H' is the Shannon diversity index and Hm a x is the maximum
value of H'. Last, a functional diversity (FD) index, which is referred to as functional dispersion (FDis), was computed to represent to the mean distance of individual species to the centroid of all species in the plot, where the weights are species relative abundances (Laliberté and Legendre 2010).
17
2.6 Statistical analyses
Analysis of variance (ANOVA) was performed using the lme function of the statistical package Nonlinear and Linear Mixed Effect models (NLME) (Pinheiro and Bates 2000) in R
(R Development Core Team 2011) according to the following model:
yijk = r1 + Si + Cffl + Bk(j(i)) + aijk + eijk
[3] where y..,k is one of the aforementioned diversity indices, u is the overall mean, S; is the
random effect of sector i , C ^ is the random effect of clearcut j within sector i, Bfc(/(n) is the random effect of block k within clearcut j within sector i, ory* is the treatment effect and Sijk is the random error. We used this model for all the preceding diversity indices.
For regeneration that was present in the plots and the content represented by dead wood, snags (m2/ha and stem/ha) and coarse woody debris (CWD, m3/ha), we used the following
model:
Yijk = n+
si +
cm +
Bmo) +
auk + P
ijk+ (aP)u
k+
£nk
[4] where pi j k is the height class for the regeneration or decomposition stage, for the source of
the dead wood, and (aB)ijk is the interaction term between the two factors. We
transformed the data to satisfy normality assumptions; when the variable distributions remained non-normal, we used a non-parametric Wilcoxon signed-rank test (Conover 1999). When the ANOVA detected a significant difference for one of the factors, we compared the means of this factor using post-hoc Tukey tests. In addition, when the ANOVA detected a significant difference for the interaction, we compared the means of each level of the interaction using the same comparison test (i.e., simple-main effects comparisons). Means comparisons were performed using the package multcomp in R (R Development Core Team 2011).
18 A quantitative fourth-corner analysis (Dray and Legendre 2008) was performed to quantify and test whether traits of the species differed between tree retention groups and adjacent clearcut zones. This analysis assesses the relationship between species traits and environment types by linking the trait and environment matrix with the species percent cover in the field. The fourth-comer analysis works by running statistical test of the significance of the links between all combinations of species traits and environmental variables. It is the result of this analysis that forms the fourth-corner, where a statistic is present for each pair of environmental type and species trait. The significance of these relationships was tested by 9999 permutations. Following Aubin et al. (2009), permutation model 1 of Dray and Legendre (2008) was used; this model permutes abundances of each species independently and tests the null hypothesis that the species are randomly distributed with respect to the environmental characteristics. Fourth-corner analysis was conducted using the function f o u r t h c o r n e r of the ade4 package in R 2.14.0 (R Development Core Team 2011).
Using the traits that were significantly different (P < 0.05) between the two environments in the fourth-corner analysis, we performed a permutation-based (5000 permutations), non-parametric multivariate analysis of the variance (PERMANOVA, Anderson 2001) to compare the classes of each trait by type of environment, still following the hierarchical design of the experiment. Following a significant MANOVA, we used a hierarchical analysis of variance (ANOVA) to verify which class of trait was associated with which environment. The non-parametric MANOVA was performed using the SAS software (SAS Institute 2004) and the ANOVA using R 2.14.0 (R Development Core Team 2011).
19
3. Results
3.1 Species abundance and richness
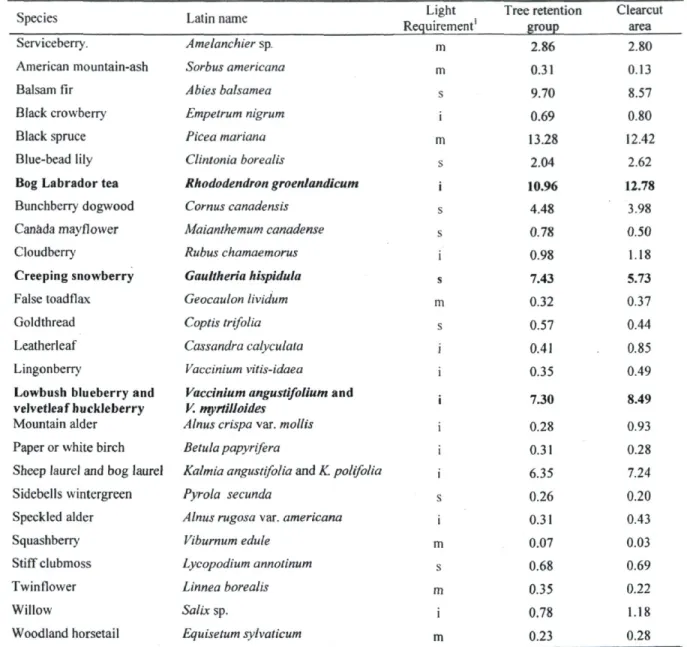
Picea mariana and Abies balsamea were the dominant tree species that were observed in both the canopy (Table 1) and regeneration strata (Table 2). Abundance of merchantable trees (DBH > 9.0 cm) was greater in tree retention groups (Table 1 ). The shrub stratum was mostly represented by ericaceous species, such as Rhododendron groenlandicum (Oeder) Kronn & Judd, Vaccinium spp., Kalmia spp. and Gaultheria hispidula (L.) Muhl. ex Bigelow. The main herbaceous species were Cornus canadensis L., Clintonia borealis Aiton (Rafinesque), Maianthemum canadense Desfontaines, Coptis trifolia Salisbury (= C. groenlantica), and Linnea borealis L. (Table 2). All species that were encountered were native to the study area.
y ; 'è S
1
c s ■ — C3 O 03 J3 ja o cd <u j -o u. _o D. >> -o 3 (U -t—» o < CQ > O 2 "S 1 2 •=1 S o T T3 " ° CU X11
Or v
P *
00 g 41 c t . ■S * 3 'S2 1
S .SP a' 2 aI
6 0 IS" tn iz Û Sa» «s
oo E 3 ca ca o H es •"* r-~ d S £, £ «2. o o r-» r» r i oo d es d d O u S 3 r- -3-o o o r») O o c i O oo d d u c i l -a ; ► > ■6 c oTable 2. Mean percentage cover of species covering 0.25% or more of the plots in tree retention groups and clearcut areas.
Species Latin name Requirement' Light Tree retention group Clearcut area Serviceberry. Amelanchier sp. m 2.86 2.80 American mountain-ash Sorbus americana m 0.31 0.13
Balsam fir Abies balsamea s 9.70 8.57
Black crowberry Empetrum nigrum i 0.69 0.80
Black spruce Picea mariana m 13.28 12.42
Blue-bead lily Clintonia borealis s 2.04 2.62
Bog Labrador tea Rhododendron groenlandicum i 10.96 12.78
Bunchberry dogwood Cornus canadensis s 4.48 3.98
Canada mayflower Maianthemum canadense s 0.78 0.50
Cloudberry Rubus chamaemorus i 0.98 1.18
Creeping snowberry Gauttheria hispidula s 7.43 5.73
False toadflax Geocaulon lividum m 0.32 0.37 Goldthread Coptis trifolia s 0.57 0.44
Leatherleaf Cassandra calyculata i 0.41 0.85 Lingonberry Vaccinium vitis-idaea i 0.35 0.49
Lowbush blueberry and velvetleaf huckleberry
Mountain alder
Vaccinium angustifolium and V. myrtilloides
Alnus crispa var. mollis
i 7.30
0.28
8.49
0.93 Paper or white birch Betula papyrifera 0.31 0.28
Sheep laurel and bog laurel Kalmia angustifolia and K. polifolia 6.35 7.24 Sidebells wintergreen Pyrola secunda S 0.26 0.20 Speckled alder Alnus rugosa var. americana i 0.31 0.43 Squashberry Viburnum edule m 0.07 0.03
Stiff clubmoss Lycopodium annotinum s 0.68 0.69 Twinflower Linnea borealis m 0.35 0.22
Willow Salix sp. i 0.78 1.18
Woodland horsetail Equisetum sylvaticum m 0.23 0.28
Note: Species in bold type are those significantly (P < 0.05, mixed ANOVA) associated with tree retention groups or clearcut areas. ' s: shade tolerant (<2 h of direct sunlight), m: mid tolerant (2-5 h of direct sunlight), i: shade intolerant (needs >6 h of direct sunlight at mid-summer).
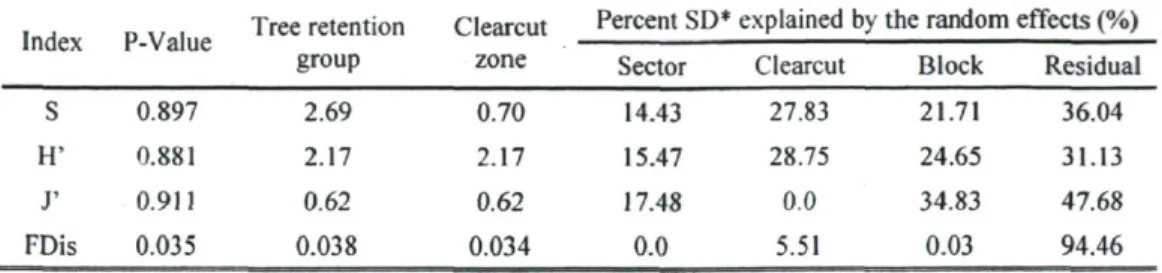
No differences were found between the tree retention groups and clearcut areas in terms of species richness, Shannon diversity, and species evenness (Table 3). However, the two environments were different in the case of functional dispersion (P = 0.0353), with tree retention groups having higher functional diversity (Table 3). The mixed-model ANOVA also indicated that a large portion of the variance was associated with different random effects, especially at the level of clearcut (Table 3).
Table 3. Results of mixed-model ANOVA.
Index P-Value Tree retention group Clearcut zone Percent SD* explained by the random effects (%) Index P-Value Tree retention group Clearcut zone
Sector Clearcut Block Residual S 0.897 2.69 0.70 14.43 27.83 21.71 36.04 H' 0.881 2.17 2.17 15.47 28.75 24.65 31.13 J' 0.9U 0.62 0.62 17.48 0.0 34.83 47.68 FDis 0.035 0.038 0.034 0.0 5.51 0.03 94.46 "SD standard deviation 22
3.2 Species Traits
Fourth-corner analysis indicated that species percent cover differed significantly between the two environments for one trait: light requirement (x2 = 74.9, P = 0.006). This meant that
at least one of the three light requirement levels differed between tree retention groups and clearcut areas (non-parametric MANOVA, F3jg7= 5.96, P = 0.001). When compared with
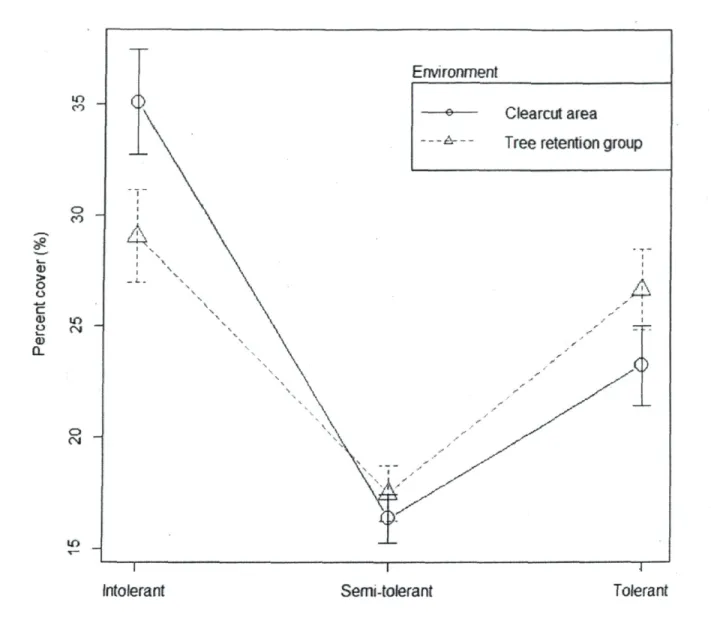
tree retention groups, clearcut areas exhibited a significantly higher percentage cover for shade-intolerant species (P = 0.0003), equal percentage cover for mid-tolerant species (P = 0.3691), and a significantly lower percentage cover for shade-tolerant species (P - 0.0175) (Fig. 3). According to ANOVA on each species, only a few species (all ericaceous) were associated with one of the environments (Table 2). Percentage cover of G. hispidula, a shade-tolerant species that reproduces mostly by seed, was significantly (P < 0.05) greater in tree retention groups, while those of R. groenlandicum, V. angustifolium and V. myrtilloides, all shade intolerant species reproducing by vegetative propagation, were significantly higher in clearcut areas.
23 OT CO O co cu c <t> i n ÇJ CM CD a o CM i n Environment — Clearcut area
■&— - Tree retenti on group
Intolerant Semi-tolerant
Species shade tolerance
1
Tolerant
Figure 3. Mean values of each level of species light requirement for both environments. The error-bars correspond to standard errors (SE).
3.3 Dead wood
A total of 358 snags were measured from 180 100-m2 plots (90 sampling areas) that had
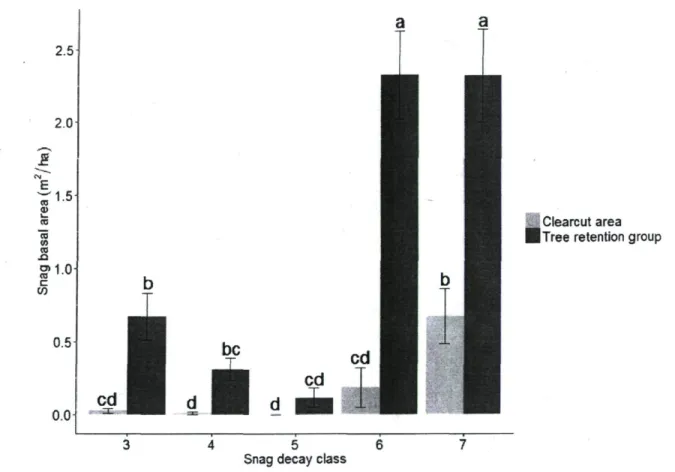
been established in the three sectors. Snag basal area differed significantly between decay classes, but this depended upon environment; mean basal area increased progressively with decay class in the clearcuts, while it decreased, then increased strongly with decay class in the retention groups (Fig. 4). This significant interaction is not apparent in figure 4 that
24
presents untransformed data, whereas the statistical test used transformed data. The basal area of highly decomposed snags (classes 6 and 7) and, to a lesser extent, that of classes 3 and 4 was significantly greater in the tree retention groups than in the clearcuts (Fig. 4). When all snag decomposition classes were considered together, tree retention groups had higher basal areas for snags of all diameters (Table 1), and especially for those with a DBH > 19 cm ( P < 0.001) (Table 4). 2.5 2.0 & 1.5-TO CD L_ ro "TO w CO .o g>1.0 c W 0.5 0.0 be
■
cd I Clearcut area I Tree retention group3 4 5 6 7 Snag decay class
Figure 4. Snag basal area in each decay class for each environment. Significant differences (P < 0.05) for means (± SE; n = 90 per environment) among classes are indicated by different letters.
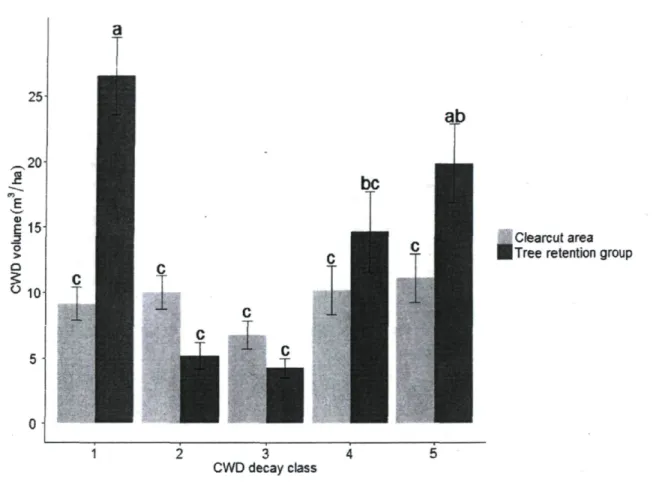
We measured 1842 pieces of CWD, which corresponded to a total volume of 106 m3. As
for figure 4, figure 5 presents the untransformed data while the statistical tests used transformed and normalized data. No significant interaction was found between environment and decay class, but a greater quantity of CWD in classes 1 and 5 was found in the tree retention groups (Fig. 5). For all other classes, no significant differences were found for the volume of CWD between the two environments. When considering all decay
25
classes together, a significantly greater volume of CWD was found in the tree retention groups (Table 1). 25 .20 S 1 1 5 3 O >
5
" 1 0c
I
E
C ^Clearcut area ITree retention groupCWD decay class
Figure 5. Volume of CWD in each decay class for each environment. Significant differences (P < 0.05) for means (± SE; n = 90 per environment) among classes are indicated by different letters.
Using the preceding results, we were able to calculate the amount of total deadwood (snags and CWD) that were left after a group retention cut (with groups corresponding to 5% of the harvested area) and after "careful logging" using a cutting with protection of regeneration and soils (CPRS). According to these calculations, the group retention cut left significantly greater quantities of both snags and CWD than did CPRS (Table 4).
26
Table 4. Dead wood abundance in clearcuts. For each category (column) a different letter indicates a significant difference at P < 0.05 (mixed-model ANOVA).
Snags (no./ha) CWD DBH > 19 cm DBH > 9 cm (nvVha) CPRS* 5/7* 1 1 9E 47.3"
Tree group retention 8.2a 51.3a 48.5"
♦Cutting with protection of regeneration and soils.
3.4 Regeneration
A total of 4962 seedlings were observed from the 180 regeneration plots (90 sampling areas) that had been established within the 15 clearcuts covering the three sectors. No significant interaction was found between environment and seedling height class. However, ANOVA detected significant differences among height classes (Fig. 6) and between the two environments, when all classes are combined (Table 1). A mean of 32 858 black spruce seedlings and 25 351 balsam fir seedlings per hectare were found in the study area. Hence, the regeneration is composed of 56% black spruce and 43% balsam fir, whereas the merchantable trees found in the retention groups constituted 83% black spruce and 13% balsam fir (Table 1 ).
27 / S a>
I £
co CT coÈ
<# / O ■I
Clearcut area Tree retention groupb
.JL
0 - 5 5.1 -60
Height class (cm) >60
Figure 6. Seedling number per height class for each environment. Significant differences (P < 0.05) for means (± S.E; n = 90 per environment) among classes are indicated by different letters.
28
4. Discussion
4.1 Community response
Although no difference was found between the two environments for the traditional diversity indices, the communities are not entirely the same. As Azeria et al. (2011) have noted, aggregated attributes of an ecosystem such as species richness can mask important changes in plant communities because traditional diversity indices treat all species as being equivalent (Vane-Wright et al. 1991). For example, the number of species can be similar between two environments while the attributes of these species are markedly different. Differences in gain or loss of plant species, as depicted by traditional diversity indices, can produce large or small effects on a specific ecosystem process, with every process likely to be affected by different species and functional groups (Vitousek 1990). The diversity index that was based on functional dispersion should produce a better overview of ecosystem processes, since it weights species according to their traits. Even though the difference we observed in FDis between the two communities was quite small (Table 3), it emphasizes the advantage of using this type of index, which gives a better perspective of the plant community and of the key driver of ecosystem processes (Hooper et al. 2005). This small difference can indicate a change in species functional composition and/or the abundance of species that are present in both environments.
If the species are the same in both environments, this would likely mean that the size of the tree retention groups is not sufficiently large to prevent edge effects (Murcia 1995, Nelson and Halpern 2005). Since a vegetation survey was not performed prior to cutting, it is not possible to determine whether or not the species observed in both environments corresponded to those present before the harvest. On one hand, the presence of several shade-intolerant species in both environments suggests that many species that were observed in this study were already established before cutting. On the other hand, most changes in species composition normally occur during the first two years following a stand-replacing disturbance in the boreal forest (Matlack 1994, Rydgren et al. 2004, De Grandpré et al. 2011). It is probable that the plant community present in the logging trails contained
29
more pioneer species, given that these species take advantage of a disturbed soil surface. Since the sampling areas were outside the highly soil disturbed zones, it is expected that pioneers will be less advantaged there because the vegetation in place will remain and expand. The advantage of tree retention groups over clearcuts thus could be related to the retention of a number of shade-intolerant species and promotion of a greater abundance of late-successional, tolerant species. Indeed, the greater percentage cover of shade-tolerant species observed in the tree retention groups suggested that their more shaded and less disturbed environment helped preserve a greater cover of late-successional species. If populations of late-successional species are preserved in the tree retention groups, they may facilitate the recolonization of adjacent harvested areas when the environmental conditions become more favorable as the canopy develops. However, it is likely that the ability of these retention groups to preserve late-successional species is reduced due to edge effects. Finally, the lower FDis in the clearcut areas indicated that they are composed of species that are more similar to one another, which could lead to a loss of resilience.
4.2 Dead wood
The large snag basal area present in an advanced decomposition state (decay classes 6 and 7) in both clearcut areas and tree retention groups (Fig. 4) was likely related to the long residence time of standing dead trees (Aakala et al. 2008). Since the later decomposition stages are the final ones before tree-fall, their abundance might be due to the normal accumulation of dead trees in those classes. The greater quantity of snags in decay classes 6 and 7 that were present in tree retention groups versus the clearcut might be explained by the uprooting of fragile trees during harvest operations while retention groups were spared. In the short-term, tree retention groups would better be able to preserve large decomposed snags that contribute to many ecological functions and provide valuable habitat for wildlife (Grove 2002, Martin et al. 2004, Lowe et al. 2011).
The volume of coarse woody debris was greatest in the tree retention groups for decay class 1 (Fig. 5). Decay class 1 included recently dead trees that still bore branches and bark. Inside tree retention groups, most of the trees in the decay class 1 were trees that had fallen
30
after harvest (having been windthrown), which explains their greater number in the retention groups. Their lower abundance on the clearcuts might be attributed to harvesting of these trees, since they have good transformation value according to Barette et al. (2012). Over a longer period of time, it is expected that the large CWD present in the harvested area will gradually decompose and disappear, a process which would be accelerated by the harvesting of newly dead trees. In this context, it is likely that tree retention groups will facilitate a recruitment of dead tree of all decomposition classes in the future. The retention groups with their higher CWD content could serve as life boats for saproxylic and non-vascular species (Sôderstrôm 1988, Rambo and Muir 1998), which prefer CWD as a substrate, and for small mammals (Loeb 1999, Ucitel et al. 2003, LeMaître et al. 2010), which use CWD as cover, nesting sites, and travel routes. Consequently, the possibility of having CWD over the short- and mid-term within in the tree retention groups, with live or dead tree recruitment will have an important effect on species that depend upon dead wood.
4.3 Regeneration
When all heights are grouped together, a greater number of seedlings were found in the tree retention groups than in the adjacent clearcut areas (Table 1). This difference cannot be explained by the presence of logging trails in the clearcuts since sampling excluded areas where machinery traffic was evident. However, this difference could be due to the damage incurred by seedlings during the felling of overstory trees, which would more strongly affect tall regeneration (Pothier 1996). In addition, mortality of small seedlings in the clearcut areas could be expected since their root systems are not deeply or extensively rooted, and which cannot draw upon deeper moisture reserves (Ôrlander and Karlsson 2000, Nilsson et al. 2002). Moreover, evaporative demand is higher in open clearcuts than under the cover of the tree retention group, thereby increasing seedling drought stress (Ruel et al. 1995). The composition of the regeneration strata is different from that of the initial stand, with balsam fir accounting for 43% of post-cut seedlings, compared to a basal area of 13% in the tree retention groups (representing the initial stand). Hence, the future stand will probably contain more balsam fir than was observed previously and this compositional difference may alter canopy structure and susceptibility to insects and pathogens (Freedman
31
et al. 1994) For example, balsam fir is more vulnerable to decay (Basham 1991) and to spruce budworm attack relative to black spruce (Pothier et al. 2012).
32
5. Management Implications
Compared to CPRS, the tree group retention cut preserves more snags and CWD, but is it sufficient to maintain the involved ecological processes? The Ontario Ministry of Natural Resources (OMNR 2001) proposed that six large living trees and 19 others (preferably snags) be left per hectare on all post-harvest sites. In contrast, Aakala et al. (2008) found 132 snags per hectare, of which 40 were considered as large snags, in old-growth forests of the northeastern Canadian boreal forest; Pham et al. (2004) recorded 46 m3 of CWD per
hectare in the same territory. Those results could be used to set reference levels regarding the numbers of snags and quantities of CWD that should be retained or generated at the time of variable retention harvest to maintain biodiversity. Since ecosystem-based management is an adaptive approach, it is important to continue research while adjusting the cutting methods according to the available results. Although our results are only valid over the short-term, they indicate that using group retention cutting can produce more snags and CWD than traditional harvesting, with potential positive effects for the conservation of many plant and animal species. Tree retention groups are probably more helpful for non-vascular and saproxylic species, which depend from dead wood; our study suggests that dead wood will not last long on the harvested areas and the harvesting of newly dead trees will likely prevent further recruitment, so the dead wood will predominantly be found in the tree retention groups after a while.
Our results show that on the short term, tree retention groups do not seem to have a great impact on the vascular plant communities as it is a set of resilient boreal species. None the less, the retention groups could play a significant role on the late-successional species on the longer term, thereby promoting a more rapid return to old-growth conditions. However, this positive influence could be mitigated by the size of the retention groups through the importance of edge effects and by an early windthrow. Increasing the size of the retention groups should reduce the edge effect and, thus, could be beneficial for many species. Our results also indicate that several late-successional species can remain present during the first five years after clearcutting, but it will be important to determine if they persist over a longer period of time.
33
6. Acknowledgements
This research project was supported by the Natural Sciences and Engineering Research Council of Canada (NSERC) - Université Laval Industrial Research Chair in Silviculture and Wildlife. We thank Fabien Lanteigne and Gabriel Emond, for their help in the field. Gaetean Daigle and Julien Béguin provided valuable help with statistical analyses. Thank you to William F.J. Parsons for editing the text. Thanks are also due to our industrial partners, who facilitated the fieldwork and provided access to the different forest management areas: Resolute Forest Products, Boisaco, and Arbec.
34
7. References
Aakala, T., Kuuluvainen, T., Gauthier, S., and De Grandpré, L. 2008. Standing dead trees and their decay-class dynamics in the northeastern boreal old-growth forests of Quebec. Forest Ecology and Management 255: 410-420.
Angers, V.-A., Gauthier, S., Drapeau, P., Jayen, K., and Bergeron, Y. 2011. Tree mortality and snag dynamics in North American boreal tree species after a wildfire: a long-term study. International Journal of Wildland Fire 20: 751-763.
Anderson, M.J. 2001. A new method for non-parametric multivariate analysis if variance. Austral Ecology 26: 32-46.
Aubin, I., Gachet, S., Messier, C , and Bouchard, A. 2007. How resilient are northern hardwood forests to human disturbance? An evaluation using a plant functional group approach. Ecoscience 14: 259-271.
Aubin, I., Ouellette, M.H., Legendre, P., Messier, C, and Bouchard, A. 2009. Comparison of two plant functional approaches to evaluate natural restoration along an old-field-deciduous forest chronosequence. Journal of Vegetation Science 20: 185-198.
Azeria E.T., Bouchard M., Pothier D., Fortin D., and Hébert C. 2011. Using biodiversity deconstruction to disentangle assembly and diversity dynamics of understorey plants along post fire succession in boreal forest. Global Ecology and Biogeography 20:119-133.
Barette, J., Pothier, D., Auty, D., Achim, A., Duschesne, I., and Gélinas, N. 2012. Lumber recovery and value of dead and sound black spruce trees grown in the North Shore region of Québec. Annals of Forest Science 69: 603-615.
Basham, J.T. 1991. Stem decay in living trees in Ontario's forests. Information report O-X-408. Sault Ste. Marie, Ontario: Forestry Canada, 64 pp.
Bendell, J.F. 1974. Effects of fire on birds and mammals (Chap. 4). pp. 73-138. In Fire and ecosystems. Edited by T.T. Kozlowski and C.E. Ahlgren. Academic Press, New York. Bergeron, Y., Leduc, A., Harvey, B.D., and Gauthier, S. 2002. Natural fire regime: a guide for sustainable management of the Canadian boreal forest. Silva Fennica 36: 81-95.
Bouchard, M., Pothier D., and Gauthier S. 2008. Fire return intervals and tree species succession in the North Shore region of eastern Quebec. Canadian Journal of Forest Research 38: 1621-1633.
Bouchard, M., and Pothier, D. 2010. Spruce budworm outbreak effects over a large spatio-temporal gradient in boreal forests of eastern Québec. Canadian Journal of Forest Research 40: 86-94.
35
Bouchard, M., Pothier, D., and Ruel, J.-C. 2009. Stand-replacing windthrow in the boreal forests of eastern Quebec. Canadian Journal of Forest Research 39: 481—487.
Brais, S., Sadi, F., Bergeron, Y., and Grenier, Y. 2005. Coarse woody debris dynamics in a post-fire jack pine chronosequence and its relation with site productivity. Forest Ecology and Management 220: 216-226.
Conover, WJ. 1999. Practical Nonparametric Statistics, 3rd ed. John Wiley and Sons, New
York.
De Grandpré, L., Boucher, D., Bergeron, Y., and Gagnon, D. 2011. Effects of small canopy gaps on boreal mixedwood understory vegetation dynamics. Community Ecology 12: 67-77.
Dray, S., and Legendre, P. 2008. Testing the species traits to environmental relationships: the fourth-corner problem revisited. Ecology 89: 3400-3412.
Eberhart, K.E., and Woodard, P.M. 1987. Distribution of residual vegetation associated with large fires in Alberta. Canadian Journal of Forest Research 17: 1207-1212.
Franklin, J.F., Berg, D.R., Thomburgh, D.A., and Tappeiner, J.C. 1997. Alternative silviculture approaches to timber harvesting: variable retention systems, pp. 111-139. In Creating a forestry for the 21st century: the science of ecosystem management. Edited by K.A. Kohm and J.F. Franklin. Island Press, Washington, DC.
Franklin, J.F., Spies, T.A., Van Pelt, R., Carey, A.B., Thomburgh, D.A., Berg, D.R., Lindenmayer, D.B.,. Harmon, M.E, Keeton, W.S., Shaw, D.C, Bible, K., and Chen, J. 2002. Disturbances and structural development of natural forest ecosystems with silvicultural implications, using Douglas-fir forests as an example. Forest Ecology and Management 155:3 99-423.
Freedman, B., Woodley, S., and Loo, J. 1994. Forestry practices and biodiversity, with particular reference to the Maritime Provinces of eastern Canada. Environmental Reviews 2: 33-77.
Gandhi, K.J.K., Spence, J.R., Langor, D.W., and Morgantini, L.E. 2001. Fire residuals as habitat reserves for epigaeic beetles (Coleoptera: Carabidae and Staphylinidae). Biological Conservation 102: 131-141.
Gauthier, S., Leduc, A., Harvey, B., Bergeron, Y., and Drapeau, P. 2001. Les perturbations naturelles et la diversité écosystémique. Naturaliste Canadien 125: 10-17.
Gauthier, S., Vaillancourt, M.-A., Leduc, A., De Grandpré, L., Kneeshaw, D., Morin, H., Drapeau, P., and Bergeron, Y. 2008. Aménagement écosystémique en forêt boréale. Québec University Press, Québec, QC.
36 Grondin, P., Anseau, C , Bélanger, L., Bergeron, J.-F., Bergeron, Y., Bouchard, A., Brisson, J., De Granpré, L., Gagnon, G., Lavoie, C , Lessard, G., Payette, S., Richard, P.J.H., Saucier, J.P., Sirois, L., and Vasseur, L. 1996. Écologie Forestière. In Manuel de Foresterie. Edited by J. Bérard, and M. Côté. Laval University Press, Sainte-Foy, QC. Grove, S. 2002. Saproxylic insect ecology and the sustainable management of forests. Annual Review of Ecology and Systematics 33: 1-23.
Harper, K.A., Macdonald, S.E., Burton, P.J., Chen, J.Q., Brosofske, K.D., Saunders, S.C., Euskirchen, E.S., Roberts, D., Jaiteh, M.S., and Essen, P.A. 2005. Edge influence on forest structure and composition in fragmented landscapes. Conservation Biology, 19: 768-782. Hooper, D.U., Chapin, F.S., Ewel, J.J., Hector, A., Inchausti, P., Lavorel, S., Lawton, J.H., Lodge, D.M., Loreau, M., Naeem, S., Schmid, B., Setala, H., Symstad, A.J., Vandermeer, J., and Wardle, D.A. 2005. Effects of biodiversity on ecosystem functioning: a consensus of current knowledge. Ecological Monographs 75: 3-35.
Hunter, M.L. Jr. 1993. Natural fire regimes as spatial models for managing boreal forests. Biological Conservation 65: 115-120.
Kafka, V., Gauthier, S., and Bergeron, Y. 2001. Fire impacts and crowning in the boreal forest: study of a large wildfire in western Quebec. International Journal of Wildland Fire 10: 119-127.
Laliberté E., and Legendre P. 2010. A distance-based framework for measuring functional diversity from multiple traits. Ecology 91: 299-305.
Leblanc, M., and Pouliot B. 2011. La coupe avec protection de la régénération et des sols avec rétention de bouquets - Fondements et exécution opérationnelle, Québec, gouvernement du Québec, ministère des Ressources naturelles et de la Faune, 9 p.
LeMaître, J., Fortin, D., Douglas, W.M., and Darveau, M. 2010. Deer mice mediate red-backed vole behaviour and abundance along a gradient of habitat alteration. Evolutionary Ecology Research 12:203-216.
Loeb, S.C. 1999. Responses of small mammals to coarse woody debris in a southeastern pine forest. Journal of Mammalogy 80: 460-471.
Lorente, M., Parsons, W.F.J., Bradley, R.L., and Munson, A.D. 2012. Soil and plant legacies associated with harvest trails in boreal black spruce forest. Forest Ecology and Management 269: 168-176.
Lowe, J., Pothier, D., Savard, J.-P.L., Rompre, G., and Bouchard, M. 2011. Snag characteristics and cavity nesting birds in the unmanaged post-fire northeastern Canadian boreal forests. Silva Fennica 45: 55-67.
37
Macdonald, S.E., and Fenniak, T.E. 2007. Understory plant communities of boreal mixedwood forests in western Canada: natural patterns and response to variable retention harvesting. Forest Ecology and Management 242: 34-48.
Magurran, A.E. 2004. Measuring Biological Diversity. Blackwell, Oxford, UK.
Martin, K, Aitken, K. E H., and Wiebe, K. L. 2004. Nest sites and nest webs for cavity-nesting communities in interior British Columbia, Canada: nest characteristics and niche partitioning. Condor 106: 5-19.
Maser, C, Anderson, R.G., Cromack Jr., K., Williams, J.T., and Martin, RE. 1979. Dead and down woody material, pp.78-95. In Wildlife habitats in managed forests: the Blue Mountains of Oregon and Washington. J.W. Thomas (technical editor). USDA Forest Service Agricultural Handbook No. 553.
Matlack, G.R. 1994. Vegetation dynamics of the edge-trends in space and successional time. Journal of Ecology 82: 113-123.
Means, J.E., MacMillan, P.C., and Cromack Jr., K. 1992. Biomass and nutrient content of Douglas-fir logs and other detrital pools in an old-growth forest, Oregon, U.S.A. Canadian Journal of Forest Research 22: 1536-1546.
Mitchell, S.J., and Beese, W.J. 2002. The retention system: reconciling variable retention with principles of silvicultural systems. Forestry Chronicle 78: 397-403.
Moen, J., and Jonsson, B.G. 2003. Edge effects on liverworts and lichens in forest patches in a mosaic of boreal forest and wetland. Conservation Biology 17: 380-388.
Murcia C. 1995. Edge effects in fragmented forests: implications for conservation. Trends in Ecology and Evolution 10: 58-62.
Neary, D.G., Klopatek, C C , DeBano, L.F., and Ffolliott, P.F. 1999. Fire effects on belowground sustainability: a review and synthesis. Forest Ecology and Management 122: 51-71.
Nelson, C.R., and Halpern, C.B. 2005. Edge-related responses of understory plants to aggregated retention harvest in the Pacific Northwest. Ecological Applications 15: 196— 209.
Nilsson, U., Gemmel, P., Johansson, U., Karlsson, M., and Welander, T. 2002. Natural regeneration of Norway spruce, Scots pine and birch under Norway Spruce shelterwoods of varying densities on a mesic-dry site in southern Sweden. Forest Ecology and Management
161: 133-145.
OMNR. 2001. Forest management guide for natural disturbance pattern emulation, Version 3.1. Ontario Ministry of Natural Resources. Queen's Printer for Ontario, Toronto. 40 pp.