HAL Id: hal-01611616
https://hal.archives-ouvertes.fr/hal-01611616
Submitted on 12 Mar 2018
HAL is a multi-disciplinary open access
archive for the deposit and dissemination of
sci-entific research documents, whether they are
pub-lished or not. The documents may come from
teaching and research institutions in France or
abroad, or from public or private research centers.
L’archive ouverte pluridisciplinaire HAL, est
destinée au dépôt et à la diffusion de documents
scientifiques de niveau recherche, publiés ou non,
émanant des établissements d’enseignement et de
recherche français ou étrangers, des laboratoires
publics ou privés.
Characterization of char and soot from millimetric wood
particles pyrolysis in a drop tube reactor between 800
degrees C and 1400 degrees C
S. Septien, S. Valin, M. Peyrot, Celine Dupont, Sylvain Salvador
To cite this version:
S. Septien, S. Valin, M. Peyrot, Celine Dupont, Sylvain Salvador. Characterization of char and soot
from millimetric wood particles pyrolysis in a drop tube reactor between 800 degrees C and 1400
degrees C. Fuel, Elsevier, 2014, 121, pp.216-224. �10.1016/j.fuel.2013.12.026�. �hal-01611616�
Characterization of char and soot from millimetric wood particles
pyrolysis in a drop tube reactor between 800
!C and 1400 !C
S. Septien
a, S. Valin
a,⇑, M. Peyrot
a, C. Dupont
a, S. Salvador
baCEA, 17 rue des Martyrs, 38054 Grenoble cedex 09, France
bRAPSODEE, Mines-Albi, CNRS UMR 5302, 81013 Albi CT cedex 9, France
Keywords: Biomass pyrolysis Char Soot Steam gasification Thermal annealing a b s t r a c t
Char and soot characterization was performed for samples obtained from beech particles pyrolysis in a drop tube reactor at various temperatures and residence times. Firstly, an experimental study was per formed and highlights the variation of char and soot composition and reactivity with operating condi tions. A structure ordering with temperature for soot samples was also experimentally put into evidence. These variations are believed to be consequence of structural changes during char thermal annealing and soot formation process, affecting both carbonaceous matrix and mineral matter. Secondly, a semi empirical model was developed and validated with thermogravimetry experiments. This model was then used for conversion time estimation in conditions representative of an entrained flow reactor, and shows that a complete conversion of char and soot is possible in a few seconds under severe oper ating conditions.
1. Introduction
Biomass gasification is one of the most promising low carbon emission technologies. It enables to convert lignocellulosic matter, such as wood or agricultural residues, into syngas. This gas mixture has a great potential since it can be directly used for the production of heat and electricity or for the synthesis of liquid or gaseous bio fuels. The entrained flow reactor is one of the main gasification technologies at a large scale. The typical process conditions are as follows: high temperature (>1300!C), short particle residence time (<5 s) and very high heat flux at particle surface (>106W m 2). The main advantage of this technology is the high
conversion of biomass into a syngas almost free of tar and gaseous hydrocarbons.
Different types of carbonaceous solids are produced in biomass gasification process, namely char and soot. These compounds can
subsequently react with the O2, H2O and CO2present in the atmo
sphere in gasification reactions which produces syngas. The con version of carbonaceous solids is of high interest in the industrial process as it increases the syngas yields. Besides, soot particles are pollutant and fouling compounds. The gasification reaction rate is related to the solid characteristics, which depend on the condi tions of their formation.
Char is issued from biomass particles pyrolysis, which is the first stage of the process. In an entrained flow reactor, the high heating rate leads to a very porous and reactive char, with a highly damaged structure due to the brutal release of volatiles during fast pyrolysis[1 3].
However, the high temperatures in the entrained flow reactor could induce thermal annealing which includes various transfor mations: loss of hydrogen and aliphatic groups, loss and changes in mineral matter and graphitization. Thermal annealing can have a negative effect on char reactivity. Several authors observed that char from coal prepared at temperatures higher than 1000!C suffers from thermal deactivation, i.e. a loss of reactivity, with
⇑Corresponding author. Tel.: +33 438784358. E-mail address:sylvie.valin@cea.fr(S. Valin).
the increase of temperature[4 6]. Based on HRTEM observation or Raman spectroscopy analysis, they concluded that thermal deacti vation is due to structure ordering (graphitization), which gives a more chemically resistant solid. Other authors demonstrated the influence of mineral matter on thermal deactivation: Liu et al.[4]
put into evidence mineral reactions occuring at high temperatures by XRD detection of SiC which is a reactive chemical complex with very low reactivity. Tremel et al.[7]observed a char surface de crease above 1200!C, which was attributed to the blockage of pores by ash melting. Senneca et al.[8]proposed an investigation to better understand thermal annealing mechanistics, with the analysis of char microstructural changes during severe heat treatments.
In the case of biomass, only two studies about thermal anneal ing have been found in literature[6,9]; they highlight that biomass char also suffers from thermal deactivation, but moderately com pared to char from coal.
Soot is a carbonaceous solid mainly composed of graphite layers and synthesized from a complex series of phenomena, which in volve gaseous hydrocarbon precursors and lead to the formation of carbonaceous solid particles. An extensive bibliographic review about soot formation process is given by Roth[10]. The influence of the pyrolysis conditions on soot reactivity has been mostly ex plored in the context of oxidation with O2. Indeed, Ruiz et al. [11]studied the oxidation of soot obtained from gaseous hydrocar bons pyrolysis between 1000!C and 1200 !C. In this study, a reac tivity decrease with temperature was observed and corroborated with a structure ordering increase. Vander Wal and Tomasek
[12,13]obtained a similar result for soot coming from the pyrolysis of different gaseous and liquid fuels. They assumed that structure ordering is related to different soot formation pathways dependant on temperature, and not to thermal annealing. Besides, no appre ciable changes in soot structure can be observed below 1800!C after its formation, according to some experiments in very high temperature devices[14,15].
As soot formation process is considerably influenced by the ini tial fuel, the results obtained in literature have to be taken with a lot of caution in the case of biomass. Until now, soot characteristics were mostly studied for samples obtained from the pyrolysis of li quid or gaseous hydrocarbons.
Steam gasification kinetic parameters for char obtained from biomass fast pyrolysis and for soot are very rare in literature. Only one work has been found for char[16]and one for soot[17]. Nev ertheless, in the former work, char samples were prepared in an atmosphere containing a low O2content which could partially oxi
dise the carbonaceous solids and then affect its reactivity; in the
latter, soot samples were obtained from the pyrolysis of hydrocar bons and thus the gasification kinetic parameters could be differ ent from those for soot coming from biomass pyrolysis.
The present study is an attempt to fill in the lack of information about char and soot in the context of biomass gasification in an en trained flow reactor. Only one recent work has been found in liter ature about this subject[18]. Characterization experiments were then performed on char and soot coming from wood particles pyrolysis in a drop tube reactor (DTR), a well adapted reactor to study biomass conversion in the conditions of an entrained flow reactor at lab scale. This study aims at studying the influence of temperature and residence time on carbonaceous solids composi tion and reactivity to steam gasification. A kinetic model for char and soot steam gasification is derived from the reactivity measurements.
2. Materials and methods
This section is dedicated to the description of the experimental procedures and of the modeling methodology. Firstly, the condi tions of char and soot formation are described, followed by the characterizations and thermogravimetry experiments. Secondly, the approach chosen for char and soot gasification modeling is described.
2.1. Experimental procedures
2.1.1. Beech particles pyrolysis in a drop tube reactor
Carbonaceous solids in the present study were obtained from beech particles pyrolysis experiments. The beech particle size was between 0.313 and 0.400 mm after a sieving classification. Nomenclature
Ea activation energy, kJ mol 1
F(X) surface function,
k0 pre exponential factor, s 1bar n
m mass of the solid, g n order of the reaction, PH2O partial pressure of H2O, bar
R(t) or R(X) reactivity, s 1
R constant of ideal gas, kJ mol 1K 1
t time, s T temperature, K X conversion, Acronyms
DTR drop tube reactor EDX Energy Dispersive X ray
HRTEM High Resolution Transmission Electron Microscopy SEM Scanning Electron Microscopy
TGA ThermoGravimetric Analyzer XRD X ray Diffraction
Chemical nomenclature Ca(CO3) calcium carbonate
CO2 carbon dioxide
H2O water/steam
MnSiO3 manganese silicate
O2 di oxygen
SiC silicon carbide
Table 1
Biomass, char and soot composition (weight content on dry basis).
C H Oa Ash Wood 50.8 5.9 42.9 0.4 Char 1000!C – 4 s 76.7 1.7 10.2 11.4 Char 1200!C – 2 s 76.8 1.6 9.6 12.0 Char 1200!C – 4 s 81.0 1.6 5.6 11.8 Char 1400!C – 4 s 79.8 1.4 0.4 18.3 Soot 1200!C – 2 s 95.6 1.3 0 3.0 Soot 1200!C – 4 s 98.9 0.7 0 0.7 Soot 1400!C – 4 s 97.6 0.4 0 2.5 aBy difference.
This particle size range is representative of what could be intro duced into an industrial entrained flow reactor.
According to a proximate analysis, the beech sample is com posed of 85.3 wt% of volatile matter and 14.3 wt% of fixed carbon on dry basis. The moisture of the sample is about 7 wt%. The chem ical composition of the biomass C, H, O and ash is shown in
Table 1. Ash is mainly composed of Ca (#30 wt%), K (#20 wt%), Mg (#10 wt%) and Si (#10 wt%).
The beech particles pyrolysis experiments were conducted in a drop tube reactor (DTR) at several temperatures: 800!C, 1000 !C, 1200!C and 1400 !C[19]. Sampling was performed at the middle and at the bottom of the reactor, which respectively corresponds to 2 s and 4 s of residence time for gas. Note that sampling at the middle of the reactor at 1400!C could not be performed. According to a shrinking core model developed to describe wood pyrolysis in a DTR[20], the slip velocity of char particles (#0.03 m/s) is much lower than gas velocity (#0.3 m/s), and can then be neglected. Soot is considered to behave like an aerosol in the gas stream, and thus the particles are not subjected to slipping. Therefore, the gas and carbonaceous solids have approximately the same residence time during DTR experiments.
2.1.2. Char and soot characterization
Char and soot particles were separately collected in the exper imental device during DTR experiments. Indeed, a segregation be tween the two solids, due to difference of size, was observed within the sampling line[19,21]. This was also observed by other authors[22]. The segregation between char and soot was also ver ified by thermogravimetry experiments, as char and soot have very different reactivities, and by SEM observations, which showed that only few soot particles were mixed with char samples.
Different types of analyses were conducted on the collected samples:
! composition analysis (C, H, O and ash);
! observation of morphology by Scanning Electron Microscopy (SEM) coupled to EDX (Energy Dispersive X ray) analysis; ! observation of structure by High Resolution Transmission Elec
tron Microscopy (HRTEM); ! XRD (X ray Diffraction) analysis;
! reactivity measurement with thermogravimetry experiments. Note that enough amounts of soot for composition analysis and thermogravimetry experiments could only be collected in experi ments at 1200!C and 1400 !C.
The SEM observations of char and soot samples were already analysed and discussed in[19].
2.1.3. Thermogravimetry experiments
Steam gasification of char and soot was studied in an atmo spheric ThermoGravimetric Analyzer (TGA) coupled to a wet gas generator, which can produce a gas with a maximum steam con tent of about 27 mol%.Fig. 1provides a scheme of the TGA facility.
The experimental procedure is defined so that gasification takes place at constant temperature. The reactor is firstly heated at 24!C/min under a nitrogen atmosphere until reaching a tempera ture plateau where gasification takes place. Once reaching the gas ification plateau, the N2 carrier gas flow is stopped and is
substituted by the wet gas. The gasification experiment is consid ered to begin at this instant. The flow rate of the carrier gas is fixed at 50 ml/min for all experiments. Note that in the case of char sam ples, the reactor is firstly heated up to 950!C and then cooled to the gasification temperature, in order to release volatile matter from the solid. Indeed, char obtained from biomass pyrolysis some how behaves like an activated carbon and can adsorb components
from the atmosphere, such as moisture and hydrocarbons. This is not the case for soot.
The gasification temperatures were 750, 800 and 850!C for char and 910, 950 and 980!C for soot. These temperatures were se lected so that the duration of gasification is between several min utes and several hundred of minutes, at a steam concentration of 20 mol% or 5 mol%.
Gasification experiments in TGA can be subject to mass transfer limitations into the bed of particles placed on the crucible[23]. The absence of interparticle mass transfer limitation in gasification experiments was experimentally verified by varying the sample mass, and therefore bed thickness. No influence of the mass was observed below 5 mg. Accordingly, char or soot mass used for TGA experiments was about 3 4 mg. Nonetheless, the absence of intra particle mass transfer limitations was not verified and then cannot be discarded. No grinding of samples was applied because this could reduce the representativeness of samples from DTR experiments.
The reactivity R was calculated from the mass loss measured in the TGA (Eq.(1)), and can also be expressed as a function of the conversion rate, dX/dt (Eq.(2)).
RðtÞ mðtÞ1 dmðtÞdt ð1Þ
RðtÞ 1 XðtÞ1 dXðtÞdt ð2Þ
Repeatability experiments showed that the results for some samples were highly scattered, surely due to their heterogeneity. Thereby, the dispersion is represented by an error bar of 15% of each reactivity value.
In this study, the reference reactivity is the mean value calcu lated in a conversion range between 10% and 70% of conversion, re ferred to as R(X 10 70%).
2.2. Char and soot gasification modeling methodology
Char and soot gasification was modelled by simple nth order model (Eq.(3)). This model associates the kinetic parameters to a function f(X) which implicitly describes the evolution of the solid surface as a function of conversion.
dX dt k0 P n H2O exp Ea R T ! " f ðXÞ ð3Þ
The steam gasification kinetic parameters were derived from ther mogravimetry experiments, which were performed on different samples, collected after 4 s of residence time:
! char sample obtained at 1000 !C (‘Char 1000 !C’); ! char sample obtained at 1400 !C (‘Char 1400 !C’); ! soot sample obtained at 1200 !C (‘Soot’).
After plotting ln(R(X 10 70%)) versus (1/T) and (1/PH2O), the
values of the activation energy Ea, pre exponential factor k0and
of the order of the reaction n could be determined from the slopes of the graphs, by using the expression of the following equation: lnðRðX 10 70%ÞÞ EaR 1T þnlnðPH2OÞ þ lnðk0Þ ð4Þ
The surface function was calculated as the ratio of the reactivity at a given conversion and of the reference reactivity (Eq.(5)) and then fitted by a polynomial (Eq.(6)). This simple approach was used by several authors[24,25], as the classical models, based on physical assumptions, are usually not well adapted to describe gas ification of char from biomass pyrolysis, as later demonstrated in Section 3.3.1.
f ðXÞ RðX 10 70%ÞRðXÞ ð5Þ f ðXÞ a X6
þ b X5þ c X4þ d X3þ e X2þ f X þ g ð6Þ
3. Results and discussion
In this section, the experimental and modeling results are shown and discussed. Firstly, the evolutions of char and soot char acteristics as a function of temperature and residence time in the reactor are discussed. Secondly, the gasification model is validated and used for the estimation of conversion time in industrial conditions.
In order to better understand the results described below, it is very important to precise that char formation is very rapidly achieved, before 2 s of residence time, whereas soot formation ad vances all along the reactor[21].
3.1. Characterization of char samples 3.1.1. Char composition
The char composition (on dry basis) is given inTable 1. At every temperature, char is mainly composed of carbon with a content higher than 75 wt%. The hydrogen represents about 1 2 wt%, while the oxygen content is under 10 wt%. The ash content at 1000!C and 1200!C is similar (#12 wt%), whereas it is higher (#18 wt%) at 1400!C. This result could be attributed to the gasification of char at 1400!C with the H2O and CO2 released by wood particles
decomposition[21,26].
The molar compositions (on dry ash free basis) of char samples are represented in a ternary plot inFig. 2. This graph also includes the beech composition and that of char prepared by Chen[20,27]. These results can be compared to ours as experiments in both works were conducted with the same feedstock and same experi mental facility. Chen[20]observed that, during wood pyrolysis at 800!C and 950 !C, the solid composition varies linearly in this dia gram (dotted line in Fig. 2), from wood composition towards 67 mol% of carbon, 21 mol% of hydrogen and 12 mol% of oxygen at the end of pyrolysis. This transformation is achieved within
the first half of the reactor for 0.35 mm wood particles, i.e. after a residence time under 2 s.
Our results show that, above 1000!C, the char carbon content still increases with temperature and residence time. This increase cannot be linked to wood pyrolysis which is achieved in a shorter time, but rather to secondary transformations occurring after char formation.
3.1.2. Char reactivity
Fig. 3a compares the gasification reactivity calculated in a con version range of 10 70% for char samples obtained at 800!C, 1000!C, 1200 !C and 1400 !C after 2 s and 4 s of residence time. Char samples from 800!C and 1000 !C experiments have a consid erably higher reactivity than the samples obtained at 1200!C and 1400!C after 4 s residence time, which have a similar reactivity. The 800!C char seems to have a slightly lower reactivity than the 1000!C one. However, this trend has to be taken with a lot of caution because the difference of reactivity is within the limits of the error bars. As for char obtained at 1200!C, the sample recov ered after 2 s of residence time has a higher reactivity than the one recovered after 4 s.
So, the char reactivity significantly decreases as pyrolysis tem perature increases from 1000 to 1200!C, and as residence time in creases from 2 s and 4 s at 1200!C. Similarly to the composition evolution (previous section), this reactivity decrease with resi dence time is not related to the characteristics of char during its formation, which is achieved in less than 2 s, but rather to its pos terior evolution.
3.1.3. Analysis of crystalline structures
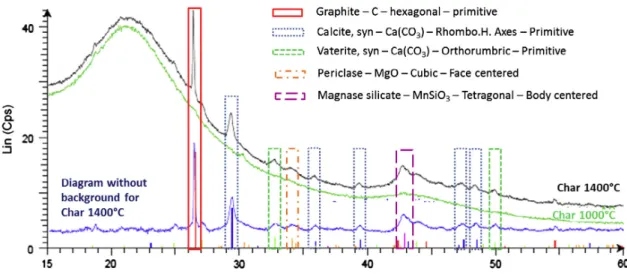
Fig. 4 presents the XRD spectra obtained with char samples from pyrolysis at 1000!C and 1400 !C. No crystalline structures were found for 1000!C char. On the contrary, the XRD analysis of char from pyrolysis at 1400!C clearly shows peaks related to inor ganic salts Ca(CO3), MgO and MnSiO3 and to graphite. The latter
is attributed to soot impurities on char sample, in agreement with HRTEM observations (refer to Section 3.2.3), and not to char with remains amorphous.
This result suggests that the higher temperature in DTR exper iments induces ash crystallization. In counterpart, no carbonaceous crystalline structure formation was detected.
N2 N2 N2 + H2O He Ar Water 20°C Water 75°C Gas outlet 1 2 Purge 4 3 5 6 7
1.Wet gas generator 2.Sample crucible 3.Heating zone 4.Balance chamber 5.Reference mass
crucible 6.Load cell (weighing
system) 7.Hot water bath
3.1.4. Discussion
SEM observations of chars formed between 800!C and 1400 !C show the typical morphology of a porous fast pyrolysis char[19]. However, our results show some evolutions concerning composi tion and mineral matter with the increase of temperature and res idence time. We suppose these could be a consequence of thermal annealing, whose influence increases with temperature.
Thermal annealing is known to lead to an ordering of the char carbonaceous structure. In our experiments, the evolution of char
towards pure carbon with the increase of temperature and resi dence time (Section 3.1.1) may be a consequence of this phenom enon. However, this ordering would remain weak as no graphitized structures were detected in char itself (Section 3.1.3).
Thermal annealing is also known to induce ash modifications in char. In our case, inorganic depositions on char surface, observed by SEM for chars prepared at 1400!C[19], may reflect mineral changes in char. Besides, XRD analyses show inorganic crystalline structures on char from pyrolysis at 1400!C but not on that from 1000!C pyrolysis (Section 3.1.3). According to the study of Misra et al.[28], inorganic compounds can be easily volatilized from char structure above 1100!C. In our study, this is at least the case of potassium which was detected in soot samples, as later explained in Section 3.2.1.
Thermal annealing usually leads to char thermal deactivation, i.e. to a reactivity decrease with temperature and residence time. In our experiments, this was observed above 1000!C (Sec tion 3.1.2). We propose some possible explanations for this observation:
The carbonaceous matrix ordering could lead to a more stable structure and to a less reactive solid;
The loss of potassium, which is known to be an efficient catalyst for gasification, and mineral crystallization could lower ash cat alytic activity; note that the total ash content cannot be directly linked with char reactivity as it is the highest in 1400!C char (Table 1) whereas reactivity is the lowest;
Ash depositions on char surface could decrease the access for steam within the particle.
Further studies should be performed in order to clarify the con tribution of each of the phenomenon on char thermal deactivation.
Char reactivity can be influenced by other factors, such as the heating rate and the gasification conversion. In fact, char reactivity generally increases with the heating rate during its formation
[1 3] and with the gasification advancement, as shown later in Section 3.3.1. In our study, the solid heating rate which increases with reactor temperature seems to play a minor role and could only explain the slight reactivity difference between chars
Fig. 2. Triangular diagram with the molar composition (daf basis) of wood particles and char samples prepared at different temperatures and residence times.
Fig. 3. Reactivity R(X = 10–70%) determined by TGA experiments at 750!C and 950!C, under a steam partial pressure of 0.20 bar, for respectively char (a) and soot (b) samples obtained at different temperatures and residence times.
obtained at 800!C and 1000 !C. On the contrary, gasification could have a relevant influence on reactivity for char obtained at 1400!C. Indeed, as said before (Section 3.1.1), char was then already par tially gasified. So the supposed char thermal deactivation at 1400!C may be then attenuated; this could explain the same reac tivity measured between the chars from pyrolysis at 1200!C and 1400!C, whereas the latter would be expected to have a lower reactivity with thermal deactivation only.
3.2. Characterization of soot samples 3.2.1. Soot composition
Table 1shows the composition (on dry basis) of soot recovered from experiments at 1200!C and 1400 !C after 2 s and 4 s of resi dence time. Soot samples are mostly composed of carbon, with also some hydrogen. A small fraction of ash was also measured, and was mainly attributed to potassium, according to EDX analyses (Fig. 5). As soot is able to fix inorganic elements on its structure during its formation, this potassium should be volatilized from char at high temperatures (Section 3.1.4). No oxygen is present in the organic matrix, as the sum of carbon, hydrogen and ash is around 100%.
Soot composition depends on the experimental conditions in the DTR. Soot sampled at 1200!C after 2 s of residence time, has
a chemical formula of (C6H)n, which is very close to the formula
of ‘young’ soot proposed by Palmer & Cullis (1965). On the con trary, the mean formula for soot after 4 s of residence time is (C12H)nat 1200!C and (C22H)nat 1400!C. Carbon content tends
then to increase with temperature and residence time, whereas hydrogen content decreases.
Soot ash content also changes with the experimental condi tions. Soot sampled at 1200!C after 4 s of residence time has lower ash content than soot samples obtained after a lower residence time 2 s or at a higher temperature 1400!C. However, these results are quite difficult to explain as they both depend on inor ganic release by char, and on inorganic fixation on soot particles, whose yield was shown to depend on residence time and temper ature in the DTR[21,26].
3.2.2. Soot reactivity
Fig. 3b compares the reactivity calculated between 10% and 70% conversion for soot samples obtained at 1200!C after 2 s and 4 s of residence time, and for samples obtained at 1400!C after 4 s of res idence time.
Reactivity of soot sampled at 1200!C after 4 s of residence time is significantly lower than the reactivity of soot samples obtained at 1200!C and 1400 !C, sampled after 2 s and 4 s of residence time respectively.
Fig. 4. XRD spectra of char samples from experiments at 1000!C and 1400 !C.
3.2.3. HRTEM soot structure observation
Crystalline structures were observed by HRTEM in soot particles which were present in chars sampled at 1000!C and 1400 !C (Fig. 6). These should correspond to the graphite layers, put into evidence by XRD analysis (Fig. 4), which compose soot structure. The carbon particles in soot formed at 1000!C are not well ar ranged (Fig. 6a). On the contrary, the carbon particles in soot formed at1400!C show a quite good alignment (Fig. 6b). Thus, it can be said that soot at 1400!C has a more ordered structure than soot at 1000!C. This suggests that a higher temperature during soot formation leads to a higher structure ordering of soot particles.
3.2.4. Discussion
Soot composition and reactivity were shown to change with temperature and residence time in the DTR. These variations are possibly due to structural changes related to soot formation pro cess, which vary as a function of temperature and the transforma tion progress [13,26]. Thermal annealing is a less probable explanation, as it has never been observed below 1800!C for soot (Section 1).
According to our results, an increase of temperature or resi dence time leads to a higher carbon content and to different reac tivity to steam gasification. A structure ordering with temperature has also been put into evidence.
Surprisingly, on the contrary to what could be expected, a more ordered structure does not necessarily imply here a decrease of soot reactivity. Nevertheless, under the explored conditions, soot reactivity may be corroborated with its mineral content mainly composed of potassium, which is known to have a high catalytic influence on gasification. Indeed, the soot samples with the highest mineral content are the more reactive to steam gasification. This can explain the higher reactivity of char from 1400!C experiments compared to that from 1200!C, and also the higher reactivity of soot sample collected after 2 s of residence time compared to that of sample collected after 4 s of residence time for experiments at 1200!C. The same correlation between the increase of reactivity and mineral content with temperature, for soot from biomass pyrolysis, was also observed by Qin et al.[18].
3.3. Char and soot gasification modeling 3.3.1. Determination of kinetic parameters
The steam gasification kinetic parameters of char and soot sam ples are presented inTable 2. It can be noticed that the activation energy and the order of the reaction of the three samples are con sistent with those usually reported in literature for char prepared under a wide variety of conditions, i.e. Ea 88 250 kJ mol 1and
n 0.4 1[29].
a
b
Fig. 6. HRTEM observations of soot from experiments at 1000!C (a) and 1400 !C (b).
Table 2
Steam gasification kinetic parameters of char and soot.
Samples Ea(kJ mol1) k
0(s1barn) n [a; b; c; d; e; f; g]
Char 1000!C 149 217893 0.7 ["142.6010; 409.4666; "425.8725; 208.9970; "44.9996; 4.8158; 0.2031] Char 1400!C 113 1763 0.9 [366.2818; "993.8326; 988.4238; "442.2056; 90.5639; "5.9203; 0.4409] Soot 178 345915 0.7 [15.2916; 1.4528; "38.7355; 40.9488; "16.9383; 3.7950; 0.4168]
Fig. 7 compares the surface function of the samples Char 1000!C, Char 1400 !C and Soot. Note that for each sample the same surface function globally applies whatever the gasification experi mental conditions (result not shown here). At the end of transfor mation, some differences were observed, which may be in major part due to the high uncertainty at this stage. Surface functions globally increase with conversion (Fig. 7) which reflects a reactivity increase as the reaction proceeds. This may be explained by a reac tive surface growth during the transformation and by the increase of inorganic matter concentration, which leads to a higher catalytic activity. The surface functions are quite close for the three samples until 50% conversion, and then increase differently. So the sample type may have an influence on the surface function evolution on the final stage of the transformation.
The surface functions experimentally obtained are very differ ent from those predicted by classical models: the volume reaction model and the shrinking core model where the surface function constantly decreases as the volume or external surface of the par ticle decreases along the transformation; the random pore model where the surface function firstly increases due to surface pore growth and then decreases after pore coalescence.
3.3.2. Validation of the model
The results from the model developed in this work were com pared to the results of the TGA experiments.Fig. 8gives an exam ple corresponding to the char and soot gasification at 850!C and 980!C respectively, with 5 mol% and 20 mol% of steam.
Fig. 8globally shows a good agreement between the modeling and experimental results. For almost all cases, the difference be tween R(X 10 70%) from the model and the experiments is lower than the error bar. The only exception is for the gasification of Char 1000!C, under 5 mol% of steam. In this case, the difference be tween the calculated and experimental reactivities R10–70%is about
30%. The same accuracy of the model was observed for the other experimental cases, which are not shown in the present article. 3.3.3. Estimation of conversion times in industrial conditions
The model described in this work was used for the estimation of char and soot gasification conversion time in representative condi tions of an entrained flow reactor, namely high temperatures and steam partial pressures. The extrapolation of the model under such conditions is based on the assumption of the validity of the model kinetic parameters at high pressures.
Table 3displays the char and soot gasification characteristic times, which correspond to the time needed for 95% conversion, at 1200!C and 1400 !C, under steam partial pressures of 0.2 bar, 2 bars and 20 bars. According toTable 3, the characteristic times
at high temperatures and steam partial pressures are globally in the scale of the second. Char 1000!C sample is gasified the fastest, with characteristic times of a few seconds or inferior to the second
Fig. 7. Surface function versus conversion for char and soot samples gasification in TGA.
Fig. 8. Experimental and modeling conversion profile during the gasification of Char 1000!C (a) and Char 1400 !C (b) at 850 !C, and of soot (c) at 980 !C, with 5 mol% and 20 mol% of steam.
Table 3
Gasification characteristic time (time needed for 95% of conversion) for char and soot samples, at 1200!C and 1400 !C, under a steam pressure of 0.2 bar, 2 bar and 20 bar.
Sample 1200!C 1400!C
0.2 bar 2 bar 20 bar 0.2 bar 2 bar 20 bar Char 1000!C 5 s 1 s 0.2 s 1 s 0.2 s 0.05 s
Char 1400!C 50 s 7 s 1 s 16 s 2 s 0.3 s
for all the experimental conditions. In contrast, Char 1400!C and Soot samples, which present close characteristic times, require the highest temperature (1400!C) and/or the highest steam partial pressure (20 bar) investigated here, to expect a complete conver sion within a few seconds.
In summary, a complete conversion could be expected for a non annealed char corresponding here to Char 1000!C , under the operating conditions of an entrained flow reactor, in which the residence time equals a few seconds. Nevertheless, if char is annealed, the probability of complete conversion is drastically reduced. Indeed, char gasification in an entrained flow reactor will depend on the competition between the reaction rate and thermal annealing. In the case of soot which has a relatively low reactivity, a complete conversion is uncertain.
In all cases, under very severe temperature and steam partial pressure conditions, a complete conversion can be expected for soot and char, annealed or not.
4. Conclusions
This paper focuses on the characterization of char and soot recovered from biomass fast pyrolysis experiments in a drop tube reactor. According to the experimental study, the char and soot characteristics vary with the operating conditions. Indeed, high temperatures (>1000!C) induce changes in the carbonaceous and mineral matrix of char and soot. Carbon content increases with temperature and residence time for both types of solids. Evolutions in char mineral matter were observed, with crystallization of inor ganics and volatilization of some elements, mainly potassium, which are subsequently fixed on soot structure. All these changes are assumed to be due to char thermal annealing and soot forma tion process, which probably influences the reactivity to steam gasification of carbonaceous solids. In the case of char, a decrease of reactivity with temperature was observed, whereas the opposite occurred for soot.
In a second step, the kinetics of char and soot gasification were determined on the basis of thermogravimetry experiments and led to the development of a semi empirical model. This model was then used for conversion time estimation in industrial conditions. This study concludes that severe conditions in an entrained flow reactor high temperatures and high steam partial pressures are required for the complete conversion of annealed char and soot.
Acknowledgments
The authors would like to acknowledge the invaluable support of the technical staff at the ‘Ecole des Mines d’Albi Carmaux’ (DTR experiments) and at the CEA (TGA experiments), and especially Mrs. Christèle VERNE TOURNON (CEA) and Mr. Bernard AUDUC (Mines Albi). We also thank Cyril CAYRON (CEA) for HRTEM observations, and Olivier SICARDY (CEA) for XRD analyses. References
[1]Mermoud F, Salvador S, Van De Steene L, Golfier F. Influence of the pyrolysis heating rate on the steam gasification rate of large wood char particles. Fuel 2006;85:1473–82.
[2]Cetin E, Gupta R, Moghtaderi B. Effect of pyrolysis pressure and heating rate on radiata pine char structure and apparent gasification reactivity. Fuel 2005;84:1328–34.
[3]Cetin E, Moghtaderi B, Gupta R, Wall TF. Influence of pyrolysis conditions on the structure and gasification reactivity of biomass chars. Fuel 2004;83: 2139–50.
[4]Liu H, Luo C, Toyota M, Kato S, Uemiya S, Kojima T, et al. Mineral reaction and morphology change during gasification of coal in CO2 at elevated
temperatures. Fuel 2003;82:523–30.
[5]Russell NV, Gibbins JR, Williamson J. Structural ordering in high temperature coal chars and the effect on reactivity. Fuel 1999;78:803–7.
[6]Shim H-S, Hurt RH. Thermal annealing of chars from diverse organic precursors under combustion-like conditions. Energy Fuels 2000;14:340–8.
[7]Tremel A, Haselsteiner T, Nakonz M, Spliethoff H. Coal and char properties in high temperature entrained flow gasification. Energy 2012;45:176–82. [8]Senneca O, Salatino P, Masi S. Microstructural changes and loss of gasification
reactivity of chars upon heat treatment. Fuel 1998;77:1483–93.
[9]Kumar M, Gupta RC. Influence of carbonization conditions on the gasification of acacia and eucalyptus wood chars by carbon dioxide. Fuel 1994;73: 1922–5.
[10] Roth K. Soot formation during the production of syngas from the partial oxidation of diesel fuel. Ph.D. thesis, Ruhr-Universität Bochum; 2006. [11]Ruiz MP, De Villoria RG, Millera A, Alzueta MU, Bilbao R. Influence of the
temperature on the properties of the soot formed from C2H2pyrolysis. Chem
Eng J 2007;127:1–9.
[12]Vander Wal RL, Tomasek AJ. Soot oxidation: dependence upon initial nanostructure. Combust Flame 2003;134:1–9.
[13]Vander Wal RL, Tomasek AJ. Soot nanostructure: dependence upon synthesis conditions. Combust Flame 2004;136:129–40.
[14]Leung KM, Lindstedt RP, Jones WP. A simplified reaction mechanism for soot formation in nonpremixed flames. Combust Flame 1991;87:289–305. [15]Marsh PA, Voet A, Mullens TJ, Price LD. Quantitative micrography of carbon
black microstructure. Carbon 1971;9:797–805.
[16]Matsumoto K, Takeno K, Ichinose T, Ogi T, Nakanishi M. Gasification reaction kinetics on biomass char obtained as a by-product of gasification in an entrained-flow gasifier with steam and oxygen at 900–1000!C. Fuel 2009;88:519–27.
[17] De Soete G. Catalysis of soot combustion by metal oxides. IFP report; 1988. [18]Qin K, Lin W, Fæster S, Jensen PA, Wu H, Jensen AD. Characterization of
residual particulates from biomass entrained flow gasification. Energy Fuels 2013;27:262–70.
[19]Septien S, Valin S, Dupont C, Peyrot M, Salvador S. Effect of particle size and temperature on woody biomass fast pyrolysis at high temperature (1000– 1400!C). Fuel 2012;97:202–10.
[20] Chen L. Fast pyrolysis of millimetric particles between 800!C and 1000 !C. Ph.D. thesis, Université de Lyon; 2009.
[21] Septien S. High temperature gasification of millimetric wood particles between 800!C and 1400 !C. Ph.D. thesis, Université de Toulouse; 2011. [22]Zhang Y, Kajitani S, Ashizawa M, Miura K. Peculiarities of rapid pyrolysis of
biomass covering medium- and high-temperature ranges. Energy Fuels 2006;20:2705–12.
[23]Ollero P, Serrera A, Arjona R, Alcantarilla S. Diffusional effects in TGA gasification experiments for kinetic determination. Fuel 2002;81:1989–2000. [24]Gómez-Barea A, Ollero P, Villanueva A. Diffusional effects in CO2gasification
experiments with single biomass char particles. 2. Theoretical predictions. Energy Fuels 2006;20:2211–22.
[25]Van de steene L, Tagutchou JP, Escudero Sanz FJ, Salvador S. Gasification of woodchip particles: experimental and numerical study of char-H2O, char-CO2,
and char-O2reactions. Chem Eng Sci 2011;66:4499–509.
[26]Septien S, Valin S, Peyrot M, Spindler B, Salvador S. Influence of steam on gasification of millimetric wood particles in a drop tube reactor: experiments and modelling. Fuel 2013;103:1080–9.
[27]Chen L, Dupont C, Salvador S, Grateau M, Boissonnet G, Schweich D. Experimental study on fast pyrolysis of free-falling millimetric biomass particles between 800!C and 1000 !C. Fuel 2013;106:61–6.
[28]Misra MK, Ragland KW, Baker AJ. Wood ash composition as a function of furnace temperature. Biomass Bioenergy 1993;4:103–16.
[29]Di Blasi C. Combustion and gasification rates of lignocellulosic chars. Prog Energy Combust Sci 2009;35:121–40.