HAL Id: hal-01853486
https://hal-mines-albi.archives-ouvertes.fr/hal-01853486
Submitted on 6 Nov 2018
HAL is a multi-disciplinary open access
archive for the deposit and dissemination of
sci-entific research documents, whether they are
pub-lished or not. The documents may come from
teaching and research institutions in France or
abroad, or from public or private research centers.
L’archive ouverte pluridisciplinaire HAL, est
destinée au dépôt et à la diffusion de documents
scientifiques de niveau recherche, publiés ou non,
émanant des établissements d’enseignement et de
recherche français ou étrangers, des laboratoires
publics ou privés.
Experimental study of torrefied wood fixed bed: thermal
analysis and source term identification
Amina Bouzarour, Victor Pozzobon, Patrick Perre, Sylvain Salvador
To cite this version:
Amina Bouzarour, Victor Pozzobon, Patrick Perre, Sylvain Salvador. Experimental study of torrefied
wood fixed bed: thermal analysis and source term identification. Fuel, Elsevier, 2018, 234, p.247-255.
�10.1016/j.fuel.2018.06.115�. �hal-01853486�
Experimental study of torrefied wood fixed bed: Thermal analysis and
source term identification
Amina Bouzarour
a,c,⁎, Victor Pozzobon
a, Patrick Perré
a,b, Sylvain Salvador
caLGPM, CentraleSupélec, SFR Condorcet FR CNRS 3417, Université Paris-Saclay, Centre Européen de Biotechnologie et de Bioéconomie (CEBB), 3 rue des Rouges Terres,
51110 Pomacle, France
bLGPM, CentraleSupélec, Université Paris-Saclay, 8-10 rue Joliot-Curie, 91190 Gif-sur-Yvette, France cUniversité de Toulouse, Mines Albi, centre RAPSODEE, Campus Jarlard, Albi, France
Keywords: Self-heating Self-ignition Torrefied wood Theoretical analysis Source term Reactor scale A B S T R A C T
In this paper, self-heating scenarii were experimented on torrefied wood chips under atmospheres containing oxygen. These tests were carried out in a packed bed reactor. The experimental device was equipped with numerous thermocouples at different levels in the wood bed reactor ensuring temperature monitoring. The impact of oxygen supply was investigated at low-temperature (150 °C) both regarding oxygen content and at-mosphere gas flow rate. The related results pointed out the propensity of the wood bed to self-heating parti-cularly under a growing oxygen content or a low flow rate of oxidizing gas causing thus a spontaneous com-bustion. Furthermore, during self-heating, the source term was assessed relying on the local energy balance equation based on the experimental temperature fields. To summarize all results, source term values were fitted to a basic heat generation term of an oxidation reaction expressed as follows:Π ∆= H× ∊ ×Aexp
( )
−Ea ×ρRT On2.
The optimized parameter values are: Ea = 99.8 kJ/mol, A = 2.50 × 10⁹s−1
( )
kg −m n 3 (1 ) , n = 0.734, = ∆ H 14.062 MJ/kgO2. 1. Introduction
Today’s world is becoming more conscious about environmental and social issues related to the overuse of fossil fuels. Currently, many efforts are focusing on improving the efficiency of alternative energies. Biomass is one of the most relevant renewable resources appearing as a good candidate to replace fossil fuels. Lignocellulosic biomass is in-tended to a thermo-chemical upgrading, through pyrolysis or gasifica-tion. These processes aim at producing solids and gases for a co-gen-eration application and oils later upgraded to biofuels. However, some characteristics of raw biomass including its high oxygen and moisture contents besides a low calorific value weaken its energy content. These limitations, encountered even for other types of biomass, such as sewage sludge [1], can be reduced through pretreatment processes. Several pathways are followed depending on the nature of biomass and its future application. Typically, thermo-chemical conversion processes such as gasification and co-firing of lignocellulosic biomass can be preceded by a thermal pretreatment known as dry torrefaction[2,3].
Torrefaction contributes mainly in enhancing the aforementioned characteristics of raw biomass[4,5]. Torrefied biomass has then a lower
moisture content, a hydrophobic nature and higher bulk density which ease its storage and transportation[2]. Furthermore, this pretreatment produces a biomass of a higher energy density. In revenge, as a result of its higher reactivity, torrefied biomass is more subjected to self-heating issues both during treatment, transportation or storage[6–8].
Self-heating is defined as a spontaneous phenomenon deriving from an unintended accumulation of heat within a reactive material. Several carbonaceous materials are affected by this situation involving mainly coal [9–11], lignocellulosic biomass [12,13] (hazelnut shells, olive pomace, wood [14–17]) and wastes (compost [18], sewage sludge
[19]). Self-heating may occur as a consequence of chemical, physical or microbiological exothermic processes at low temperature. The major heat release mechanism responsible for the self-heating of the com-bustible material is the oxidation under oxygen exposure
[11,20,8,21,22]. In some cases, thermo-chemical decomposition of biomass can cause self-heating notably during severe conditions of torrefaction[23–25]. Even at lower temperatures bacterial and fungal activity can generate heat. Several investigations of coal self-heating at low temperatures have recognized gas adsorption at the porous surface of solids as an exothermic process contributing to self-heating[10]. All
⁎Corresponding author.
E-mail address:[email protected](A. Bouzarour).
those mechanisms combined may set a path to ignition and fire hazard. Self-heating assessment is generally linked to heat production, mass variation, oxygen consumption and gas emission. Several experimental tests have been carried out in order to measure the above self-heating indicators. The classical investigation techniques are: 1) TGA/DSC to examine the mass change and the heat flow released during the oxi-dation of the reactive material[21,26]. 2) Calorimetry (isothermal or adiabatic)[20]to measure more accurately the heat release rate. This approach is usually used for ranking materials according to their re-activity[11]. 3) Isothermal flow reactor to allow the measurement and the prediction of the kinetics of oxygen consumption and gas produc-tion[27,28,11,29,30]. 4) Analytical methods including FTIR, ESR/EPR to identify accurately the functional groups originating from the che-misorption of oxygen that leads to the formation of oxygenated com-plexes on the material surface. 5) Basket methods to predict, based on a simplified model, a critical temperature of different materials and ac-ceptable kinetic parameters for industrial applications (Frank-Kame-netskii theory, crossing point temperature and heat release method)
[16]. Furthermore, on the basis of the experimental findings, kinetic models were investigated for coal oxidation at low temperatures. The complexity of heat release processes makes their understanding limited. Hence, divergent reaction schemes were suggested to describe self-heating of coal[31,32,10,33,34].
Among the latest works concerning self-heating of wood, Evangelista et al.[35]studied this phenomenon on a packed bed re-actor of torrefied wood chips submitted to oxidizing gas. Gas analysis and thermal readings reveal the exothermic tendency of torrefied wood, notably after a severe torrefaction. A qualitative approach based on gas analysis (CO, CO2, O2) was followed in order to detect the adsorption
mechanism through oxygen balance. Neither kinetics, nor heat release related to self-heating were estimated in this study. Elsewhere, Can-delier et al.[36], provided a more comprehensive pathway focused on a chemical oxidation study of thermally modified wood under oxidizing atmosphere supply. A combination of STA-DSC-FTIR analysis allowed to highlight that kinetics of degradation and oxidation of hardwood (beech) are more pronounced than for softwood (silver fir). Related heat flows were measured during oxidation and FTIR gas analysis confirmed the previous trend especially for severely heat treated hardwood. Measured heat flows were correlated with temperature, oxidation duration, mass loss and elemental compositions. However, this study didn’t provide more information about wood self-heating mechanisms.
The current work aims at investigating the influence of the oxygen presence on the self-heating tendency of pretreated biomass. To this
purpose, experiments were conducted in a packed bed of torrefied beech wood chips. At this scale, both physical and chemical phenomena are observed, in contrary to the particle scale experiments where only chemical reactions are meant to occur. During self-heating stage, tem-perature histories were analyzed and related source terms were de-duced from the local energy balance at several locations inside the bed. Then, the heat source term was correlated to measured temperature and oxygen content to yield a readily usable correlation.
2. Materials and methods 2.1. Materials
2.1.1. Biomass
The beech chips used in this study were supplied by the company Sowood (Argenteuil, France). The selected chips have a regular paral-lelepiped shape and a relatively small size. Their equivalent diameter was measured using a caliper for 356 wood beech chips in 3D. The latter equals 3.04 mm± 0.92 mm. The proximate and ultimate analysis of raw beech chips are given inTable 1
2.1.2. Experimental apparatus
The experiments conducted here consist of studying the propensity of self-heating at a reactor scale in a packed bed reactor of 12 L. At this scale, both physical heat/mass transfers and chemical reactions op-erate, in contrast with particle scale tests characterized only by che-mical reactions phenomena, which is not compatible with the industrial reality. In this context, several self-heating scenarii were tested by varying some critical operating conditions.
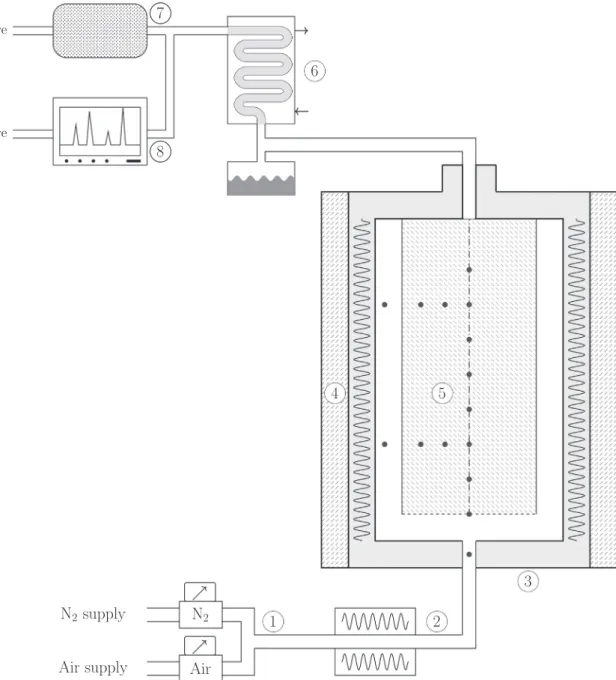
The experimental setup drawn on Fig. 1 is composed of the fol-lowing devices: 1) furnace: equipped with lateral resistances that heat the wood chips bed by radiation. 2) reactor: the reactor containing chips bed has a cylindrical shape with internal diameter of 19.6 cm and a height of 40 cm. The latter is sealed inside the furnace with a high temperature gasket. In order to monitor the temperature evolution in Nomenclature
Latin symbols
A pre-exponential factor, 1/s cp specific heat capacity, J/kg/K d average sphere diameter, m Ea activation energy, J/mol
k thermal conductivity, W/m/K
M molar mass, kg/mol
P pressure, Pa
Q gas flow rate, NL/min
r oxygen consumption rate, kg/m3/s
R ideal gas constant, J/mol/K
T temperature, K Greek symbols H ∆ heat of reaction, J/kg ∊ bed porosity, – Π source term, W/m3
ρ solid phase apparent density, kg/m3
σ Stefan-Boltzmann constant, W/m2/K4 Subscripts a alumina eff effective g gas p pore s solid Superscripts i position index n time index Table 1
Proximate and ultimate analysis of raw beech chips.
Proximate analysis (dry basis wt.%) Ultimate analysis (dry basis wt.%) Volatile matter Fixed carbon Ash content C H O N S 15.2 84.3 0.5 48.76 5.98 43.93 0.35 0.96
the wood chips bed, a number of thermocouples are positioned at dif-ferent levels in the bed. 3) mass flow-meters (Brooks SLA 5158S): Gas flow rate is controlled by means of mass flow-meters of air and nitrogen 4) preheater: atmosphere gas is preheated before being injected in the medium 5) condenser and activated carbon filter: volatile matters generated from treatment are flown towards a condenser where a fraction of gases are condensed into tars. A part of the gases leaving the condenser is then analyzed and purified on an activated carbon filter before being released. 6) gas analyzer: self-heating reactions produce typically CO2and CO. Gas measurement are then ensured by
aNon-Dispersive Infra-Red analyzer (NDIR-analyzer, SERVOMEX 4900) that allows to measure the amount of CO and CO2produced. Meanwhile, a
paramagnetic oxygen analyzer quantifies oxygen at the outlet of the reactor.
2.1.3. Experimental procedure
The experimental procedure is divided into two key steps. The first step aims at preparing the medium for self-heating tests. This includes a
torrefaction period and some additional time to cool it down to a controlled temperature of 150 °C. The second step consists of creating a self-heating phenomenon by introducing oxidizing gas flow. It is im-portant to notice that self-heating phenomena are induced on freshly torrefied wood that has not been in contact with oxygen before. In practical applications it is the case just after production, and not after a storage period.
Preparation of the medium
1. Drying: first, 3.5 kg of beech chips are dried overnight in an oven at 103.5 °C. Around 3.1 kg of dried chips were introduced in the re-actor.
2. Torrefaction: once the fixed reactor is packed with beech chips, the furnace is heated at 5 °C/min to a torrefaction temperature of 250 °C which is maintained for 2 h under inert atmosphere (N2). For each
experiment, the chips bed is crossed by 30 NL/min of preheated nitrogen flow rate. Torrefied bed of biomass showed a weight loss rate of 8.14%. It is therefore a mildly torrefied wood.
Fig. 1. Schematic of experimental apparatus equipped with: black dots: thermocouples, 1) mass flow-meters, 2) preheater, 3) furnace, 4) Insulating material, 5) packed bed reactor, 6) condenser, 7) activated carbon filter, 8) gas analyzer.
3. Cooling: thereafter, the furnace temperature is set at the expected temperature for self-heating test around 150 °C for 3h40 which is the time required to the chips bed to reach a rather homogeneous temperature on different positions.
Injection of oxidizing gas After temperature stabilization in the bed, oxidizing gas is flown into the packed bed reactor. This gas is composed either of air or a mixture of air and nitrogen. Both of the oxidizing gas and the emitted volatiles are analyzed at the reactor outlet via NDIR-analyzer. During this phase, particular attention is paid to the mon-itoring of the bed temperature and gas analysis. The reason for this is that oxygen presence may lead to two potential situations: either a slow self-heating occurs or this phenomenon intensifies and leads to auto-ignition. Only thermal results are presented in this work.
2.1.4. Experimental conditions
Self-heating tests were carried out on torrefied wood bed at 150 °C. This temperature represents the initial thermal condition in self-heating stage. The present study focuses on the investigation of the influence of oxidizing gas flow rate and the oxygen content on self-heating pro-pensity of torrefied wood. Other parameters were already examined in the literature as particle size[30], torrefaction temperature[21], type of biomass[36,26], residence time[36]. For the reference test, those parameters are chosen so that a slight self-heating occurs at first and grows thereafter to self-ignition. For the rest of the experiments, the effect of each parameter is investigated separately, one parameter is varied each time. Experimental conditions are presented inTable 2. 2.1.5. Theoretical analysis
In order to determine the source term from the experimental tem-perature fields, a theoretical analysis of the system was undergone. The strategy adopted here was to use the local energy balance and de-termine all terms but the source term from the temperature fields. To do so, the experimental temperature fields were smoothed using a relevant mathematical expression. This step is important as the temperature fields have then to be derived in space and time. This method has the great advantage of using only the local energy balance: the source term is evaluated without a classical computational solution over a defined domain. As the local energy balance relies on quantities evaluated in-side of the reactor, it is not necessary to provide any boundary condi-tions to the system. This is a major advantage in complex situacondi-tions like this one, as boundary conditions are hardly known with the required accuracy. Once done, those values were implemented in a Particle Swarm Optimization algorithm (PSO) in order to yield an expression for the source term dependency on temperature and oxygen fraction. Indeed, these two parameters are identified as those to impact the source term. The oxidizing gas flow rate should not impact it.
The reactor is described as a porous medium under constant forced convection. In this system, the local energy balance tells us that the time derivative of temperature results of the sum of three contributions: heat convection, heat diffusion and heat production/consumption by the medium: ⏟ ∊ + −∊ ∂ ∂ + ∇ → = ∇ + ρ c ρ c T t ρ c Tv k T ( g pg (1 )s ps) . ( ) Π Accumulation term g pg Advection term eff
Diffusion term Source term
2
(1) Reordering Eq.(1)allows the source term to be isolated:
= ∊ρ c + −∊ρ c ∂∂Tt + ∇ ρ c Tv k→ − ∇T
Π ( g pg (1 ) s ps) . (g pg ) eff 2 (2)
By assuming an even gas flow over the section, all terms of the right hand side of Eq.(2)can be determined using the temperature evolution in time and space (∂ ∇
∂Tt, T and∇ T2 ). Obviously, our method can be applied only at locations in the bed for which we have the history of the temperature field. Assessing for the source term at those given locations requires further mathematical treatment.
Taking advantage of the 2D cylindrical geometry of the system, the Eq.(2)can be rewritten as:
⎜ ⎟ = ∊ + −∊ ∂∂ + ∂∂ − ⎛ ⎝ ∂ ∂ + ∂∂ + ∂∂ ⎞⎠ ρ c ρ c Tt ρ c v Tz k zT r Tr rT Π ( g pg (1 ) s ps) g pg g eff 1 2 2 2 2 (3) The former equation can then be evaluated at every position (i) for every time (n): ⎜ ⎟ = ∊ + −∊ ∂∂ + → ∂∂ − ⎛ ⎝ ∂ ∂ + ∂∂ + ∂∂ ⎞⎠ c ρ c ρ Tt ρ c v Tz k zT r Tr rT Π ( (1 ) ) | ‖ ‖ | | 1 | | i n pg g ps s in g pg in eff in in in 2 2 2 2 (4)
In order to evaluate the gradient and the Laplacian in Eq.4, the temperature field was reconstructed locally using second order poly-nomials. We intentionally choose this function which allows the La-placian to be computed, yet ensuring a spatial filter of the temperature noise.Fig. 2presents an example of a reconstructed temperature field as a 2D colormap with isotherms reported as isolines. This field exhibits all the characteristics that can be expected from a temperature field ori-ginating from a source term in a cylindrical geometry. Among those, the radial thermal gradient due to heat loss at the external surface, and the temperature rise along the axis due to convection are of note. Confident in this method, the temperature field was derived to compute spatial derivatives. Physical quantities varying with temperature,keff andρg, were evaluated locally (Eq.(5) and (6)). Other physical properties va-lues are available inTable 3.
= ∊ + −∊ + keff in kg (1 )(ks 16/3σd Tp in 3) (5) = ρgn PMRTg in i (6)
2.1.6. Theoretical analysis validation
In order to assess the reliability of this approach, a validation pro-cedure was undergone. The reactor was filled with an inert medium (alumina spheres, physical properties are listed inTable 3) and exposed to the same temperature and gas flow rate variations as for biomass. As the spheres constituting the medium are inert, if working properly, this validation method should yield a constant source term close to 0 W/m3.
Table 2
Experimental conditions during self-heating stage.
Experiments O2(vol.%) Qair(NL/min) QN2(NL/min) Qoxidizing gas(NL/min)
Ref 20.95 20 0 20 −− O2 7 6.7 13.3 20 − O2 14 13.4 6.6 20 − Qgas 20.95 10 0 10 + Qgas 20.95 30 0 30
Then, temperature histories were supplied to the processing algo-rithm. Validation results can be found onFig. 3. This figure reported the four terms of the heat balance, as expressed in Eq.4at four different heights in the reactor. As can be seen, computed accumulation, con-vection and diffusion terms compensate one another, yielding an almost zero source term throughout the bed. The fact that the processing procedure computes an almost zero source term for inert material is a token of its quality and allows us to be confident in the results it will yield when applied to the other runs.
Fig. 2. Reconstructed temperature field for reference test 20 min after oxidizing gas injection. White dots: thermocouples.
Table 3
Physical properties of wood and alumina.
Symbol Property Value Dimension Note
ρ cs ps Heat capacity of torrefied
wood 133.35× 10
4 J/K Measured
ρ ca pa Heat capacity of alumina
beads 181.30× 10
4 J/K Measured in
[37]
∊s Wood bed porosity 0.637 – Measured ∊a Alumina beads bed
porosity 0.452 – Measured in [37] ks Wood thermal conductivity 0.1046 W/m/K Estimated in [38] ka Alumina thermal conductivity 0.447 W/m/K Measured in [37]
kair Air thermal conductivity 33.5× 10⁻³ W/m/K Measured in
[39]
kN2 Nitrogen thermal conductivity
33.6× 10⁻³ W/m/K Measured in
[40]
cp air( ) Specific heat of air 1.018× 10³ J/kg/K Measured in [41]
cp N( 2) Specific heat of nitrogen 1.047× 10³ J/kg/K Measured in [42]
dp Average sphere diameter 3.04× 10⁻³ m Measured
σ Stefan–Boltzmann constant
5.67× 10⁻⁸ W/m2/K4 –
Fig. 3. Heat balance terms at different heights (10, 20, 30 cm) for validation test on alumina beads. Green arrow: gas rate flow change (from 30 NL/min to 20 NL/min).
Remark: As a first attempt, only a 1D configuration was used to assess the source term. Yet, it yielded poor results. As 2D approach is then required, which proves that, even though the reactor has a large diameter, radial thermal diffusion has to be taken into account.
3. Results and discussion
3.1. Thermal study on self-heating experiments 3.1.1. Reference test
Temperature histories during reference experiment are plotted at three different heights at 10, 20, and 30 cm on the reactor axis (Fig. 4). We selected those temperatures to describe the thermal response of the system on positions representative of low, medium and high part of the bed. At first glance, we can notice that bed temperature follows the furnace temperature with a response delay. Indeed, temperatures in-crease after a drying period nearby 70 °C before approaching torrefac-tion temperature at 250 °C.
Initially, temperature rise is more rapid at the lowest parts of the bed (10 and 20 cm high). Once the bed approaches the end of torre-faction stage, temperature of the highest parts of the bed exceed those of the lowest parts. After that, the system is progressively brought to a stable temperature of approximately 150 °C. The self-heating period starts when oxidizing gas is supplied. In this case, air is the injected gas. Temperature slowly rises, increasingly with bed’s height. At low and medium heights (10 and 20 cm), corresponding temperatures increase slightly with an overshoot of 3 and 10 °C, respectively. Nevertheless, at the top of the bed (30 cm), temperature increases linearly and more rapidly until reaching ignition after 2 h of more pronounced self-heating as detailed in (Fig. 5).
This experiment was repeated under the same conditions. Fig. 6
depicts a similar thermal behavior of the bed by maintaining the same treatment conditions.
Injecting oxidizing gas induces exothermic mechanisms that ele-vates chips bed temperature. Heat produced is flown through particles bed from bottom to top and accumulates on the top causing a thermal runaway. It is important to mention that all along the experiments, the gas composition can be considered constant in the bed with as less than 1% of depletion of O2is reported by the gas analyzer.
3.1.2. Impact of gas flow rate on self-heating propensity
Fig. 7shows the effect of increasing oxidizing gas flow rate from 20 NL/min to 30 NL/min. As a result, temperature raises less than during reference test. Only 5 °C, 10 °C and 15 °C of temperature rises are
observed at the axis in the bed (10, 20 and 30 cm), respectively. In contrast, decreasing oxidizing gas flow rate to 10 NL/min creates a rapid self-heating at the top of the bed. This phenomenon grows faster during 1 h, after which it reaches thermal runaway (Fig. 8). Meanwhile at 20 cm bed height, 20 °C of temperature overshoot is noticed. In the same logic, the lower part of the bed is barely prone to self-heating.
These results can be explained by the fact that a higher oxidizing gas flow rate promotes the convective heat transfer. Therefore, this condi-tion may supply more oxygen that is likely to intensify exothermic re-actions and intensifies heat generation. However, simultaneously, heat produced is easily evacuated through the particle bed allowing a rapid cooling. The balance of these two phenomena is in favor of a cooling of the bed. On the other hand, decreasing oxidizing gas flow rate reduces convective heat transfer resulting in a poor evacuation of produced heat. As a result, heat accumulation leads to self-ignition on the bed top.
3.1.3. Impact of oxygen supply on self-heating propensity
Results related to the experiment conducted under 14% of oxygen are depicted inFig. 9. Temperature of the bed increases slightly after adding oxygen. Only 10 °C and 5 °C of temperature gain are pointed out at the top and the middle height of the particle bed. In the same way, under 7% of oxygen, chips temperature increases more slightly with a maximum of 5 °C of temperature overshoot at the top of the bed (Fig. 10).
It can be concluded that self-heating phenomenon is closely related to oxygen presence in the medium. This is due to the exothermicity of the mechanisms involving interactions between oxygen and wood. Hence, one has to focus on the quantification of heat generated during self-heating. The next step is dedicated to this end.
3.2. Theoretical analysis results
3.2.1. Estimation of the heat production during self-heating
For the reference test, each term of the heat balance equation is plotted at three heights along the reactor axis (Fig. 11). Once the oxi-dizing gas is injected, heat production is detected at different bed levels. It can either decrease and stabilize or keep rising. At 15 cm, heat pro-duction increases moderately to 2000 W/m3. Thereafter, it decreases
slightly and converges to a stable value. Released heat at 20 cm rises more intensely and stabilizes after a slight drop. Whereas, at higher level (25 cm) it increases continually exceeding 4000 W/m3. These
re-sults are in agreement with the logic of registered temperatures evo-lution. From the evolution of generated heat with a stable trend ranging
Fig. 4. Temperature evolution during torrefaction, cooling and self-heating stages for the reference test. Black arrow: cooling start, red arrow: oxidizing gas injection.
Fig. 5. Temperature evolution at different heights (10, 20, 30 cm) during self-heating for the reference test. Red arrow: oxidizing gas injection, blue arrow: nitrogen flush.
from 5 min until 15 min after oxidizing gas injection, it is possible to extract a meaningful value for the source term of virgin torrefied wood. This has been done for every other run (not presented in figures).
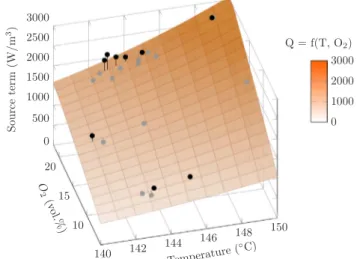
Fig. 12depicts the influence of temperature and oxygen supply on the source term. Indeed, this term is directly correlated to both of the temperature of the medium and the oxygen concentration. By assuming that the heat produced is mainly governed by an oxidation reaction, heat source can be formulated following an Arrhénius type expression:
= × ∊ × ⎛
⎝− ⎞⎠×
H A RTEa ρ
Π ∆ exp On
2 (7)
Using the experimental data, PSO algorithm was used to determine the best fitting values of Eq.(7)parameters. The obtained parameters allow the average error to be reduced to 7.2% over the whole range of temperature and oxygen fraction (Fig. 12) (Ea = 99.8 kJ/mol, A = 2.50×10⁹ s−1 ( )kg −
m3(1 )n, n = 0.734, ∆ H 14.062MJ/kg= O2 [43]).
The heat of reaction chosen here was taken from a study that estimates this parameter for a coal sample submitted to an oxidizing atmosphere at low-temperature (25–140 °C) in an adiabatic reactor[43]. Based on a
Fig. 6. Temperature evolution at different heights (10, 20, 30 cm) during self-heating for the repeatability of the reference test. Red arrow: oxidizing gas injection, blue arrow: nitrogen flush.
Fig. 7. Temperature evolution at different heights (10, 20, 30 cm) during self-heating forQgas+test. Red arrow: oxidizing gas injection, blue arrow: nitrogen flush.
Fig. 8. Temperature evolution at different heights (10, 20, 30 cm) during self-heating forQgas−test. Red arrow: oxidizing gas injection, blue arrow: nitrogen flush.
Fig. 9. Temperature evolution at different heights (10, 20, 30 cm) during self-heating forO2- test. Red arrow: oxidizing gas injection, blue arrow: nitrogen
flush.
Fig. 10. Temperature evolution at different heights (10, 20, 30 cm) during self-heating forO2– test. Red arrow: oxidizing gas injection, blue arrow: nitrogen
simplified energy balance, this estimation corresponds to the heat of chemisorption suggested in literature ranging from 2.6 to 13MJ/kgO2as
reported in[10]. Kaji et al. evaluated heat evolved during coal oxida-tion through calorimetric test which ranged from 9.8 to11.8MJ/kgO2
[44].
Optimized activation energy value is close to values found in the literature that range between 60 and 190 kJ/mol [26,45] for coal, charcoal or biomass. In order to support the relevance of the optimized activation energy, we evaluated the ratio of the oxygen consumption rate at two different temperatures (150 and 160 °C) as presented in Eq.
8. ⎜ ⎜ ⎟⎟ = ⎛ ⎝− ⎛⎝ − ⎞⎠⎞⎠ r r12 exp EaR T T1 12 1 (8)
where r is oxygen consumption rate and i = 1,2 refer to the system temperature set at 160 °C and 150 °C respectively. This approach shows that the reaction rate almost doubles (r1/r2=1.92) with only 10 °C of
temperature rise. This great dependence to temperature is in agreement with our experimental observations as well as those of other authors
[35].
Furthermore, it can be seen that the values of heat source term do not depend on the oxidizing gas flow rate making the proposed para-meters intrinsic to the phenomenon. Therefore, one can deduce that the kinetic and thermochemical parameters proposed here yield a readily usable equation for the heat generated by a torrefied wood chip. 4. Conclusion
In this work, the self-heating potential of freshly produced torrefied wood chips at the reactor scale and at low temperature was studied. The impact of oxygen supply was investigated both in terms of oxygen fraction in gas and gas flow rate. The results showed that spontaneous self-heating is intimately related to those conditions. Indeed, this phe-nomenon is notably prone to reach a self-ignition state under a growing oxygen supply and a low oxidizing gas flow rate. Indeed, supplying more oxygen to the wood bed exacerbates exothermic mechanisms occurring between oxygen and wood chips. Meanwhile, a low oxidizing gas flow rate leads to self-ignition originating from a limited convective transport of heat. On the contrary, a weak oxygen presence and a higher oxidizing gas flow rate reduce self-heating propensity. A model was proposed in order to assess the source terms involved during self-heating. This latter, does not require to provide any boundary condi-tion. Optimized kinetic parameters and reaction heat source values were suggested under the assumption that the oxidation reaction is the major source of heat production. Further work is required in order to identify accurately the mechanisms related to the interaction between oxygen and torrefied wood. To do so, gas analysis could provide more information about adsorption phenomena and oxidation reaction. Acknowledgments
The authors would like to thank Département de la Marne, Région Grand Est and Grand Reims for their financial support.
Fig. 11. Heat balance terms at different heights (15, 20, 25 cm) during self-heating for reference test. Red arrow: oxidizing gas injection.
Fig. 12. Source term correlation with temperature and oxygen fraction in oxidizing gas.
References
[1] Huang YW, Chen MQ, Luo HF. Nonisothermal torrefaction kinetics of sewage sludge using the simplified distributed activation energy model. Chem Eng J
2016;298:154–61.https://doi.org/10.1016/j.cej.2016.04.018. URLhttp://www. sciencedirect.com/science/article/pii/S1385894716304478.
[2] van der Stelt MJC, Gerhauser H, Kiel JHA, Ptasinski KJ. Biomass upgrading by torrefaction for the production of biofuels: a review. Biomass Bioenergy 2011;35(9):3748–62.https://doi.org/10.1016/j.biombioe.2011.06.023. URLhttp://www.sciencedirect.com/science/article/pii/S0961953411003473. [3] Tapasvi D, Kempegowda RS, Tran K-Q, Skreiberg Ø, Grnli M. A simulation study on
the torrefied biomass gasification. Energy Convers Manage 2015;90:446–57.
https://doi.org/10.1016/j.enconman.2014.11.027. URLhttp://www.sciencedirect. com/science/article/pii/S0196890414009844.
[4] Nhuchhen DR, Basu P, Acharya B. A comprehensive review on biomass torrefaction. Research Gate 2014;2014:56. URLhttps://www.researchgate.net/publication/ 264237153AComprehensiveReviewonBiomassTorrefaction.
[5] Ohliger A, Förster M, Kneer R. Torrefaction of beechwood: a parametric study in-cluding heat of reaction and grindability. Fuel 2013;104:607–13.https://doi.org/ 10.1016/j.fuel.2012.06.112. URLhttp://www.sciencedirect.com/science/article/ pii/S001623611200542X.
[6] Guo W. Self-heating and spontaneous combustion of wood pellets during storage. [Ph.D. thesis]. University of British Columbia; 2013.https://doi.org/10.14288/1. 0073583. URLhttps://open.library.ubc.ca/cIRcle/collections/ubctheses/24/items/ 1.0073583.
[7] Russo P, De Rosa A, Mazzaro M. Silo explosion from smoldering combustion: a case study. Can J Chem Eng 2017;95(9):1721–9.https://doi.org/10.1002/cjce.22815. URLhttp://onlinelibrary.wiley.com/doi/10.1002/cjce.22815/full.
[8] Larsson SH, Lestander TA, Crompton D, Melin S, Sokhansanj S. Temperature pat-terns in large scale wood pellet silo storage. Appl Energy 2012;92:322–7.https:// doi.org/10.1016/j.apenergy.2011.11.012. URLhttp://www.sciencedirect.com/ science/article/pii/S0306261911007094.
[9] Bradbury AGW, Shafizadeh F. Role of oxygen chemisorption in low-temperature ignition of cellulose, Combust. Flame; (United States) 37. doi:https://doi.org/10. 1016/0010-2180(80)90073-5. URLhttps://www.osti.gov/biblio/5101603. [10] Wang H, Dlugogorski BZ, Kennedy EM. Coal oxidation at low temperatures: oxygen
consumption, oxidation products, reaction mechanism and kinetic modelling. Prog Energy Combust Sci 2003;29(6):487–513. https://doi.org/10.1016/S0360-1285(03)00042-X. URLhttp://www.sciencedirect.com/science/article/pii/ S036012850300042X.
[11] Carras JN, Young BC. Self-heating of coal and related materials: models, application and test methods. Prog Energy Combust Sci 1994;20(1):1–15.https://doi.org/10. 1016/0360-1285(94)90004-3. URLhttps://www.sciencedirect.com/science/ article/pii/0360128594900043.
[12] Di Blasi C, Branca C, Sarnataro FE, Gallo A. Thermal runaway in the pyrolysis of some lignocellulosic biomasses. Energy Fuels 2014;28(4):2684–96.https://doi.org/ 10.1021/ef500296g.
[13] Ramírez-Gómez Á. Research needs on biomass characterization to prevent handling problems and hazards in industry. Part Sci Technol 2016;34(4):432–41.https://doi. org/10.1080/02726351.2016.1138262.
[14] Guo W, Trischuk K, Bi X, Lim CJ, Sokhansanj S. Measurements of wood pellets self-heating kinetic parameters using isothermal calorimetry. Biomass Bioenergy 2014;63:1–9.https://doi.org/10.1016/j.biombioe.2014.02.022. URLhttp://www. sciencedirect.com/science/article/pii/S0961953414000890.
[15] Cocchi G. The relationship between thermal diffusivity, energy of activation and temperature rise in subcritical self heating of fuels in simple geometries. Fuel 2015;158:816–25.https://doi.org/10.1016/j.fuel.2015.06.037. URLhttp://www. sciencedirect.com/science/article/pii/S0016236115006171.
[16] Chen XD. On basket heating methods for obtaining exothermic reactivity of solid materials. Process Saf Environ Prot 1999;77(4):187–92.https://doi.org/10.1205/ 095758299530053. URLhttp://www.sciencedirect.com/science/article/pii/ S0957582099708013.
[17] Mahmoudi AH, Hoffmann F, Markovic M, Peters B, Brem G. Numerical modeling of self-heating and self-ignition in a packed-bed of biomass using XDEM. Combust Flame 2016;163:358–69.https://doi.org/10.1016/j.combustflame.2015.10.010. URLhttp://www.sciencedirect.com/science/article/pii/S0010218015003582. [18] Luangwilai T, Sidhu HS, Nelson MI. One-dimensional spatial model for self-heating
in compost piles: investigating effects of moisture and air flow. Food Bioprod Process 2018;108:18–26.https://doi.org/10.1016/j.fbp.2017.12.001. URLhttp:// www.sciencedirect.com/science/article/pii/S0960308517301554.
[19] Escudey M, Arias A, Förster J, Moraga N, Zambra C, Chang AC. Sewage sludge self-heating and spontaneous combustion field, laboratory and numerical studies. High Temp Mater Process 2011;27(5):337–46.https://doi.org/10.1515/HTMP.2008.27. 5.337. URLhttps://www.degruyter.com/view/j/htmp.2008.27.5/htmp.2008.27.5. 337/htmp.2008.27.5.337.xml.
[20] Larsson I, Lönnermark A, Blomqvist P, Persson H. Measurement of self-heating potential of biomass pellets with isothermal calorimetry. Fire Mater
2017;41(8):1007–15.https://doi.org/10.1002/fam.2441. URLhttp://onlinelibrary. wiley.com/doi/10.1002/fam.2441/abstract.
[21] Cruz Ceballos DC, Hawboldt K, Hellleur R. Effect of production conditions on self-heating propensity of torrefied sawmill residues. Fuel 2015;160:227–37.https:// doi.org/10.1016/j.fuel.2015.07.097. URLhttp://www.sciencedirect.com/science/ article/pii/S0016236115007887.
[22] Babrauskas V. Ignition of wood: a review of the state of the art. J Fire Prot Eng 2002;12(3):163–89.https://doi.org/10.1177/10423910260620482. URLhttp://
journals.sagepub.com/doi/abs/10.1177/10423910260620482.
[23] Cavagnol S, Roesler JF, Sanz E, Nastoll W, Lu P, Perré P. Exothermicity in wood torrefaction and its impact on product mass yields: from micro to pilot scale. Can J Chem Eng 2015;93(2):331–9.https://doi.org/10.1002/cjce.22128. URLhttp:// onlinelibrary.wiley.com/doi/10.1002/cjce.22128/abstract.
[24] Bates RB, Ghoniem AF. Modeling kinetics-transport interactions during biomass torrefaction: the effects of temperature, particle size, and moisture content. Fuel 2014;137:216–29.https://doi.org/10.1016/j.fuel.2014.07.047. URLhttp://www. sciencedirect.com/science/article/pii/S001623611400698X.
[25] Perré P, Rémond R, Turner I. A comprehensive dual-scale wood torrefaction model: application to the analysis of thermal run-away in industrial heat treatment pro-cesses. Int J Heat Mass Transf 2013;64:838–49.https://doi.org/10.1016/j. ijheatmasstransfer.2013.03.066. URLhttp://www.sciencedirect.com/science/ article/pii/S0017931013002846.
[26] Garcia Torrent J, Fernandez Anez N, Medic Pejic L, Montenegro Mateos L. Assessment of self-ignition risks of solid biofuels by thermal analysis. Fuel 2015;143:484–91.https://doi.org/10.1016/j.fuel.2014.11.074. URLhttp://www. sciencedirect.com/science/article/pii/S0016236114011788.
[27] Nordon P, Young BC, Bainbridge NW. The rate of oxidation of char and coal in relation to their tendency to self-heat. Fuel 1979;58(6):443–9.https://doi.org/10. 1016/0016-2361(79)90086-3. URLhttp://www.sciencedirect.com/science/article/ pii/0016236179900863.
[28] Wang H, Dlugogorski BZ, Kennedy EM. Kinetic modeling of low-temperature oxi-dation of coal. Combust Flame 2002;131(4):452–64.https://doi.org/10.1016/ S0010-2180(02)00416-9. URLhttp://www.sciencedirect.com/science/article/pii/ S0010218002004169.
[29] Krishnaswamy S, Gunn RD, Agarwal PK. Low-temperature oxidation of coal. 2. An experimental and modelling investigation using a fixed-bed isothermal flow reactor. Fuel 1996;75(3):344–52.https://doi.org/10.1016/0016-2361(95)00177-8. URLhttp://www.sciencedirect.com/science/article/pii/0016236195001778. [30] Wang H, Dlugogorski BZ, Kennedy EM. Experimental study on low-temperature
oxidation of an australian coal. Energy Fuels 1999;13(6):1173–9.https://doi.org/ 10.1021/ef990040s.
[31] Krishnaswamy S, Bhat S, Gunn RD, Agarwal PK. Low-temperature oxidation of coal. 1. A single-particle reaction-diffusion model. Fuel 1996;75(3):333–43.https://doi. org/10.1016/0016-2361(95)00180-8. URLhttp://www.sciencedirect.com/science/ article/pii/0016236195001808.
[32] Wang H, Dlugogorski BZ, Kennedy EM. Thermal decomposition of solid oxygenated complexes formed by coal oxidation at low temperatures. Fuel
2002;81(15):1913–23.https://doi.org/10.1016/S0016-2361(02)00122-9. URLhttp://www.sciencedirect.com/science/article/pii/S0016236102001229. [33] Deng J, Xiao Y, Li Q, Lu J, Wen H. Experimental studies of spontaneous combustion
and anaerobic cooling of coal. Fuel 2015;157:261–9.https://doi.org/10.1016/j. fuel.2015.04.063. URLhttp://www.sciencedirect.com/science/article/pii/ S0016236115004779.
[34] Su H, Zhou F, Li J, Qi H. Effects of oxygen supply on low-temperature oxidation of coal: a case study of Jurassic coal in Yima, China. Fuel 2017;202:446–54.https:// doi.org/10.1016/j.fuel.2017.04.055. URLhttp://www.sciencedirect.com/science/ article/pii/S0016236117304623.
[35] Evangelista B, Arlabosse P, Govin A, Salvador S, Bonnefoy O, Dirion J-L. Reactor scale study of self-heating and self-ignition of torrefied wood in contact with oxygen. Fuel 2018;214:590–6.https://doi.org/10.1016/j.fuel.2017.11.048. URLhttp://www.sciencedirect.com/science/article/pii/S0016236117314503. [36] Candelier K, Dibdiakova J, Volle G, Rousset P. Study on chemical oxidation of heat
treated lignocellulosic biomass under oxygen exposure by STA-DSC-FTIR analysis. Thermochim Acta 2016;644:33–42.https://doi.org/10.1016/j.tca.2016.10.008. URLhttp://www.sciencedirect.com/science/article/pii/S0040603116302842. [37] Pozzobon V, Baud G, Salvador S, Debenest G. Darcy scale modeling of smoldering:
impact of heat loss. Combust Sci Technol 2017;189(2):340–65.https://doi.org/10. 1080/00102202.2016.1214585.
[38] Miller RS, Bellan J. Analysis of reaction products and conversion time in the pyr-olysis of cellulose and wood particles. Combust Sci Technol 1996;119(1–6):331–73.
https://doi.org/10.1080/00102209608952004.
[39] Lemmon EW, Jacobsen RT. Viscosity and thermal conductivity equations for ni-trogen, oxygen, argon, and air. Int J Thermophys 2004;25(1):21–69.https://doi. org/10.1023/B:IJOT.0000022327.04529.f3. URLhttps://link.springer.com/article/ 10.1023/B:IJOT.0000022327.04529.f3.
[40] Span R, Lemmon EW, Jacobsen RT, Wagner W, Yokozeki A. A reference equation of state for the thermodynamic properties of nitrogen for temperatures from 63.151 to 1000 K and pressures to 2200 MPa. J Phys Chem Ref Data 2000;29(6):1361–433. [41]Keenan JH, Chao J, Kaye J. Gas tables: International version. Gas tables:
interna-tional version. John Wiley & Sons; 1983.
[42] M. Chase, Nist-janaf thermochemical tables (journal of physical and chemical re-ference data monograph no. 9), American Institute of Physics.
[43] Itay M, Hill CR, Glasser D. A study of the low temperature oxidation of coal. Fuel Process Technol 1989;21(2):81–97.https://doi.org/10.1016/0378-3820(89) 90063-5. URLhttp://www.sciencedirect.com/science/article/pii/ 0378382089900635.
[44] Kaji R, Hishinuma Y, Nakamura Y. Low temperature oxidation of coals—a calori-metric study. Fuel 1987;66(2):154–7.https://doi.org/10.1016/0016-2361(87) 90233-X. URLhttp://www.sciencedirect.com/science/article/pii/
001623618790233X.
[45] Cumming JW. Reactivity assessment of coals via a weighted mean activation en-ergy. Fuel 1984;63(10):1436–40.https://doi.org/10.1016/0016-2361(84)90353-3. URLhttp://www.sciencedirect.com/science/article/pii/0016236184903533.