HAL Id: hal-00853411
https://hal-mines-paristech.archives-ouvertes.fr/hal-00853411
Submitted on 14 Nov 2013
HAL is a multi-disciplinary open access
archive for the deposit and dissemination of sci-entific research documents, whether they are pub-lished or not. The documents may come from teaching and research institutions in France or abroad, or from public or private research centers.
L’archive ouverte pluridisciplinaire HAL, est destinée au dépôt et à la diffusion de documents scientifiques de niveau recherche, publiés ou non, émanant des établissements d’enseignement et de recherche français ou étrangers, des laboratoires publics ou privés.
resistance spot welds
Florent Krajcarz, Anne-Françoise Gourgues-Lorenzon, Emmanuel Lucas,
Matthieu Mazière, André Pineau
To cite this version:
Florent Krajcarz, Anne-Françoise Gourgues-Lorenzon, Emmanuel Lucas, Matthieu Mazière, André Pineau. Local approach applied to the fracture toughness of resistance spot welds. 13th international conference on fracture, Jun 2013, Beijing, China. 10 p. �hal-00853411�
Local Approach Applied to the Fracture Toughness of Resistance Spot Welds
Florent Krajcarz
1,2, Anne-Françoise Gourgues-Lorenzon
1,*, Emmanuel Lucas
2,
Matthieu Mazière
1, André Pineau
11
MINES ParisTech, Centre des Matériaux, UMR CNRS 7633, BP 87, 91003 Evry cedex, France
2 ArcelorMittal Global R&D, BP 30320, 57283 Maizières-lès-Metz cedex, France
* Corresponding author: anne-francoise.gourgues@ensmp.fr
Abstract A recently developed methodology for measuring the nugget fracture toughness in mode I was
applied to three high-strength steel resistance spot welds, exhibiting either mixed cleavage/ductile or ductile fracture at room temperature. Fracture toughness tests revealed a difference in ductile-to-brittle transition temperature between the welds. Constitutive equations of weld nuggets were determined and implemented in a finite element model of the fracture toughness test, revealing both in-plane bending and in-plane stretching in front of the crack tip. Brittle cleavage fracture of the nuggets is not conveniently described using a simple Ritchie-Knott-Rice approach but the Rice-Tracey model allowed quantitatively relating the high number density of small particles to the nugget fracture toughness in the ductile regime.
Keywords Local approach, Brittle to ductile transition, High strength steels, Resistance spot welds
1. Introduction
The need for car-lightening has led to the development of Advanced High Strength Steels containing more alloying elements than standard steels. Resistance spot welding issues become of major concern for these steels. Due to the severe cooling conditions, the weld may exhibit an unusual microstructure that could be sensitive to unstable cracking in opening mode, inducing interfacial failure of the weld. In the opening mode, several tests are available to determine the strength of resistance spot welds (RSWs) [1]. The transition between crack propagation across the heat-affected zone and interfacial failure strongly depends on the molten zone (nugget) fracture toughness [2]. A new methodology (referenced hereafter as UXT tests) has recently been developed [3] to determine the nugget fracture toughness, using cross-tensile tests on double U-shaped specimens (Fig. 1), together with crack extension monitoring using a potential drop method. The purpose of the present study is to determine, if any, the ductile-to-brittle transition of the weld nugget for different steel compositions (and thus, nugget microstructures), by using the UXT test. A mechanical analysis of the test is then performed using a finite element modelling approach to determine the loading conditions ahead of the tip of the precrack. For this purpose, constitutive equations of the nugget are estimated from heat-treated microstructures, as already reported in literature [1]. A simple initiation criterion for both brittle cleavage and ductile dimple fracture is then tentatively derived as a function of the material microstructure and fracture mechanisms.
2. Experimental details
2.1. Materials and welding conditions
Three high strength steels were provided as 2-mm-thick bare sheets. Their chemical composition and room temperature properties are reported in Table 1. Resistance spot welds were fabricated using a Sciaky pedestal welding machine, following ISO 18278-2 (2004) standard parameters, without cold times. A low welding current (Table 2) was applied (i) to ensure the presence of a weak Diffusion Bonded Zone (DBZ), which serves as an circular precrack, and (ii) to facilitate interfacial failure under UXT tests [2]. The corresponding weld diameter, d was measured from fracture surfaces after interfacial failure (Table 2). Conventional cross-tensile strength, CTS
(averaged over four tensile tests on cross-welded 125x38 mm² coupons), hardness (average of 30 measurements at room temperature with a dwell time of 10s) and nugget microstructure (observed in cross-section after Béchet-Beaujard + Nital etching) are reported in Table 2.
Figure 1. Schematics of the UXT specimen
Table 1. Chemical composition and mechanical properties of the three base material sheets
Material C [wt%] Mn [wt%] Si [wt%] 0.2% proof stress [MPa] Tensile strength [MPa] Uniform elongation [%]
Steel F 0.15 0.68 0.01 380 505 14
Steel D 0.15 1.90 0.21 510 780 14
Steel T 0.19 1.71 1.68 540 820 22
Table 2. Welding conditions, room temperature properties and microstructure of the welds
Base metal Welding current (kA)
d (mm) CTS (kN) HV0.5 (base metal) HV0.5 (nugget) Nugget microstructure
Steel F 7.6 6.2 ± 0.1 6.3 ± 0.1 160 ± 6 373 ± 30 martensite + lower bainite Steel D 6.8 5.9 ± 0.1 7.2 ± 0.6 243 ± 3 420 ± 11 martensite
Steel T 7.0 6.4 ± 0.2 7.5 ± 0.1 243 ± 9 500 ± 10 martensite
2.2. Ductile to brittle transition curves of the weld nuggets
Specimen halves (full thickness 30x95 mm² coupons) were press-brake bent into U shapes with a bending radius of 2 mm, leaving a 30x30 mm2 central region, and then welded perpendicularly to each other (Fig. 1). The specimen was attached to grips by bolts, with spacers inserted between specimen and bolts. The weld was thus loaded normally to the sheet plane. This setup was fitted to an Instron servohydraulic tensile machine, with a 250 kN load cell and a climatic chamber. Temperature was recorded using a thermocouple spot-welded on the UXT specimen. The tensile load and load line displacement curves were recorded, together with the increase in potential drop. The stress intensity factor was estimated using the analytical formula developed by Lin and Pan for square-cup specimens [4] (Eq. 1) over the first 2 mm of crack propagation:
[
]
+ − + − + + + − − − − + − = ) 1 ²( ) 1 ²( ) / ln( ) 1 ²( 2 ) 1 ²)( ² ( ²) ² ( ) / ln( ² 2 ² ² 2 3 2 2 / 3 ν ν ν ν π d c d c c c d c d Y d c d c d c f t T KI c (1)In Eq. (1), c is the cup diameter (taken as equal to c’, the equivalent diameter of the U tensile specimen), t the sheet thickness, d the weld diameter and T the tensile load. Y =d2
(
ν −1)
−c2(
ν +1)
,ν
= 0.3 (Poisson ratio) and fc is a geometrical parameter set to 1. Ductile-to-brittle transition (DBT)curves were determined using the fracture toughness at crack initiation, KIc (in fact, crack
propagation leading to a reduction of the bearing area by 2%). Ductile and brittle temperature ranges were estimated from fracture surface examinations by scanning electron microscopy in a secondary electron imaging mode. Energy dispersive spectrometry (EDS) was used to analyse particles on fracture surfaces.
c
base metal weld
regions where opening stress is concentrated
load application points cc
base metal weld
regions where opening stress is concentrated
load application points base metal
weld
regions where opening stress is concentrated
2.3. Plastic yield and fracture properties of the weld nugget
Two approaches have been reported in literature to estimate the constitutive behaviour of the nugget: using miniature specimens machined from “actual” nuggets (e.g. [5]), or simulating the coarse-grained heat-affected zone by heat treatment (e.g. [1]). The second approach was chosen here. Using a Gleeble 3500 simulator under a vacuum, full-thickness 12x100 mm² blanks were heated at 1500°C.s-1 up to 1290°C (maximum heating rate and temperature that ensured homogeneous heating without local melting), and then cooled using helium gas blowing or water spraying (the actual spot welding cooling rate lying in between). From temperature monitoring with spot-welded thermocouples and microhardness measurements, a homogeneous heat treatment was applied over a length of at least 20 mm. Flat uniaxial tensile specimens (15x4 mm² in gauge dimensions) were spark erosion machined from heat-treated blanks and pulled in tension using the same Instron equipment at various temperatures, with an elongation rate of 1.1 10-3 s-1, as measured from an in situ extensometer (initial gauge length: 8.7 mm). The criterion for small scale yielding (SSY) conditions in the UXT test was derived from these tensile properties. Double edge U-notched tensile (DENT) specimens were machined from heat-treated blanks of Steel D with a ligament width of 6 mm, a notch radius of 1 mm, and then pulled in tension using the same machine. Notch opening was recorded by averaging measurements of two extensometers placed at either edge.
3. Experimental results and discussion
3.1. Ductile to brittle transition curves of the weld nuggets
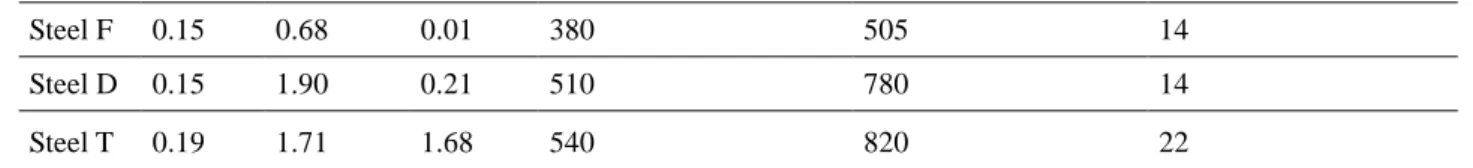
3.1.1. Steel T
Figure 2. DBT curves for Steel T nuggets: (a) load at crack initiation and weld strength (i.e. maximal load); (b) fracture toughness at crack initiation and crack-extension resistance dK/da. c) Detailed view of ductile
fracture and EDS analysis of precipitates located within dimples (red arrow)
Only interfacial failure (FIF) was observed. While the weld strength only slightly increases with temperature, a transition is observed in the load at crack initiation vs. temperature curve (Fig. 2). Above room temperature, the load only slightly increases between crack initiation and fracture. The fracture toughness transition curve showed a marked transition from 40-50 MPa√m up to 70-80 MPa√m. In the brittle temperature range, pure cleavage fracture initiated from multiple sites all around the weld. The microstructural feature at the origin of crack initiation could not be determined. Many crack deviations led to a rough fracture surface and to serrations in the load vs. displacement curves. In the ductile domain, smooth interfacial cracking occurred. Small dimples (~5 µm in size) aligned along the radial direction of the weld initiated from tiny particles of 0.4 µ m in average size (Fig. 2c) that were mainly phosphides and sometimes aluminium oxides. The dimple size was consistent with the secondary dendrite arm spacing of the weld estimated from metallographic observations [6]. In the DBT range, cracks propagated in a mixed cleavage + ductile
T (°C) -200 -100 0 100 10 0 8 2 6 4 Maximal Load Load at crack initiation Maximal load At crack initiation brittle DBT ductile Load (kN) (a) KIc dK/da d K /d a (M P a √m .m m -1) KIc (2 % ) (M P a √m ) 100 20 60 80 40 T (°C) -200 -100 0 100 10 20 30 40 0 KIc
dK/da SSY limit
brittle DBT ductile (b) 5 µm radial direc tion of the weld T = 120°C P SiP Mn,Fe (c) T (°C) -200 -100 0 100 10 0 8 2 6 4 Maximal Load Load at crack initiation Maximal load At crack initiation brittle DBT ductile Load (kN) (a) T (°C) -200 -100 0 100 T (°C) -200 -100 0 100 10 0 8 2 6 4 10 0 8 2 6 4 Maximal Load Load at crack initiation Maximal load At crack initiation brittle DBT ductile Load (kN) (a) KIc dK/da d K /d a (M P a √m .m m -1) KIc (2 % ) (M P a √m ) 100 20 60 80 40 T (°C) -200 -100 0 100 10 20 30 40 0 KIc
dK/da SSY limit
brittle DBT ductile (b) KIc dK/da d K /d a (M P a √m .m m -1) KIc (2 % ) (M P a √m ) 100 20 60 80 40 KIc (2 % ) (M P a √m ) 100 20 60 80 40 100 20 60 80 40 T (°C) -200 -100 0 100 T (°C) -200 -100 0 100 10 20 30 40 0 10 20 30 40 0 KIc
dK/da SSY limit
brittle DBT ductile (b) 5 µm radial direc tion of the weld T = 120°C P SiP Mn,Fe (c) 5 µm5 µm radial direc tion of the weld T = 120°C P SiP Mn,Fe (c)
manner. The roughness of the fracture surface decreased with increasing test temperature.
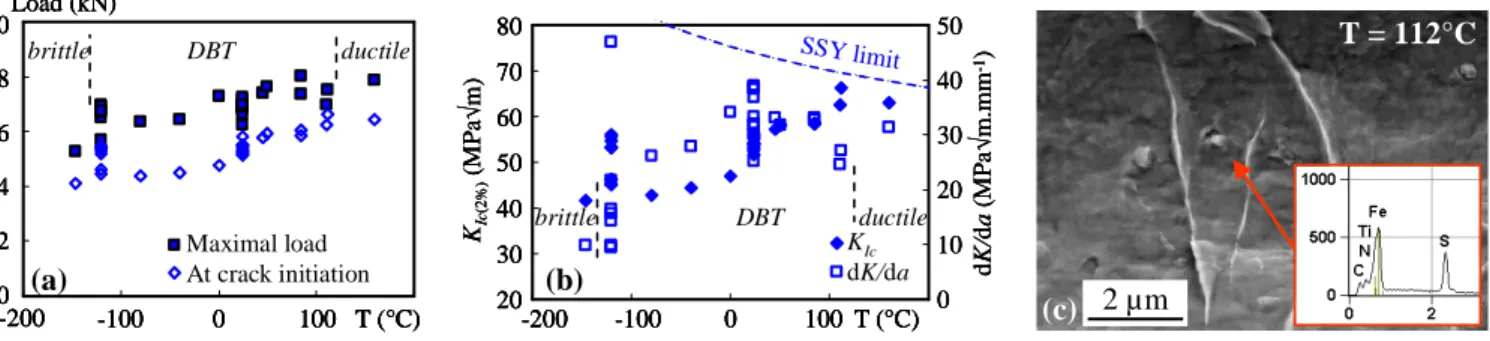
3.1.2. Steel D
Although some welds failed in a partial interfacial mode, FIF was observed in the vast majority of tests. The transition in crack initiation and fracture load is less obvious and more scattered than for Steel T but, again, the DBT range encompasses room temperature (Fig. 3). The fracture toughness in the brittle domain is similar to that of Steel T but in the ductile domain, it is lower. Cleavage and dimple ductile fracture exhibit similar macroscopic (crack deviation) and microscopic features as for Steel T. No particle was found at cleavage initiation sites. The average size of dimples and tiny particles (mainly MnS particles together with some phosphides) was 4.5 and 0.3 µm, respectively.
Figure 3. DBT curves for Steel D nugget: (a) load at crack initiation and weld strength; (b) fracture toughness at crack initiation and crack-extension resistance. (c) Ductile dimples nucleated at sulphides
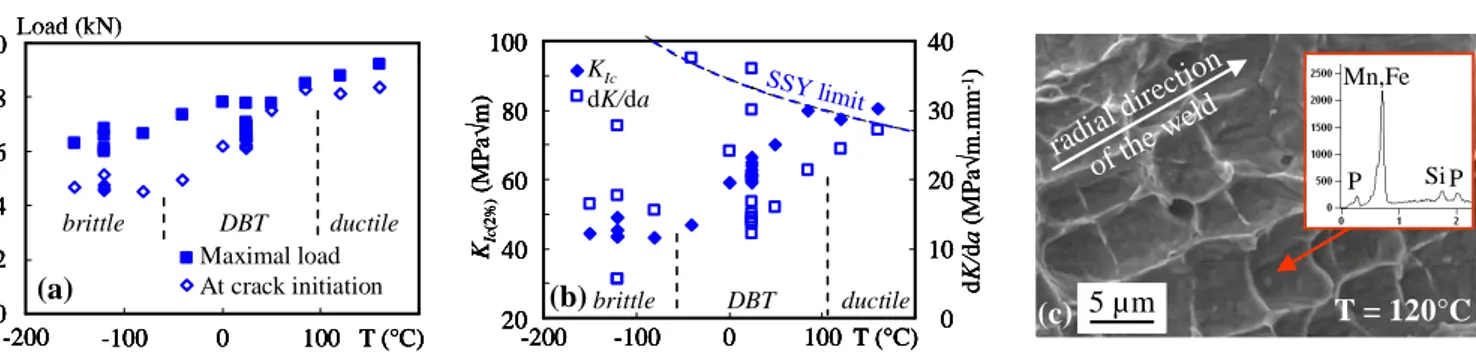
3.1.3. Steel F
Only FIF was observed for Steel F. The load at crack initiation and the ultimate load increase with temperature up to 0°C and -100°C respectively, and then decrease (Fig. 4). The fracture toughness varies in the same way as the load at crack initiation. In contrast to Steels T and D, only ductile fracture was observed at room temperature, yet with limited fracture toughness (~55 MPa√m). The fracture mechanisms were similar to those of Steels T and D, with a dimple size of ~4 µm and a fine precipitation of MnS particles of ~0.5 µm in size together with a few aluminium oxides. Only a few cleavage facets were found at 0°C but cleavage facets linked by torn ligaments dominated fracture surfaces at -40°C. Combined with transition curves, it suggests that cleavage and ductile fracture toughness could be very close to each other in this particular case.
Figure 4. DBT curves for Steel F nugget: (a) load at crack initiation and maximal load; (b) fracture toughness at crack initiation and crack-extension resistance. (c) Ductile dimples nucleated at sulphides
3.1.4. Comparison between Steels T, D, and F
Despite their difference in fracture mechanisms, Steels F and D exhibit similar weld fracture
T = 112°C
2 µm (c) Maximal Load
Load at crack initiation Load (kN) Maximal load At crack initiation brittle DBT ductile 10 0 8 2 6 4 T (°C) -200 -100 0 100 (a) KIc dK/da KIc (2 % ) (M P a √m ) T (°C) -200 -100 0 100 10 20 30 40 0 KIc dK/da SSY limit brittle DBT ductile 80 20 60 70 40 50 30 50 d K /d a (M P a √m .m m -1) (b) T = 112°C 2 µm (c) T = 112°C 2 µm 2 µm (c) Maximal Load
Load at crack initiation Load (kN) Maximal load At crack initiation brittle DBT ductile 10 0 8 2 6 4 T (°C) -200 -100 0 100 (a) Maximal Load Load at crack initiation Load (kN) Maximal load At crack initiation brittle DBT ductile 10 0 8 2 6 4 10 0 8 2 6 4 T (°C) -200 -100 0 100 T (°C) -200 -100 0 100 (a) KIc dK/da KIc (2 % ) (M P a √m ) T (°C) -200 -100 0 100 10 20 30 40 0 KIc dK/da SSY limit brittle DBT ductile 80 20 60 70 40 50 30 50 d K /d a (M P a √m .m m -1) (b) KIc dK/da KIc (2 % ) (M P a √m ) T (°C) -200 -100 0 100 T (°C) -200 -100 0 100 10 20 30 40 0 KIc dK/da SSY limit brittle DBT ductile 80 20 60 70 40 50 30 80 20 60 70 40 50 30 50 d K /d a (M P a √m .m m -1) (b) Maximal Load Load at crack initiation Maximal load At crack initiation brittle DBT ductile Load (kN) 10 0 8 2 6 4 T (°C) -200 -100 0 100
(a) KIcdK/da
KIc (2 % ) (M P a √m ) T (°C) -200 -100 0 100 10 20 30 40 0 KIc dK/da SSY limit brittle DBT ductile d K /d a (M P a √m .m m -1) 80 20 60 70 40 50 30 (b) 5 µm (c) T = 24°C radial direc tion of the weld Maximal Load Load at crack initiation Maximal load At crack initiation brittle DBT ductile Load (kN) 10 0 8 2 6 4 T (°C) -200 -100 0 100 (a) Maximal Load Load at crack initiation Maximal load At crack initiation brittle DBT ductile Load (kN) 10 0 8 2 6 4 T (°C) -200 -100 0 100 Maximal Load Load at crack initiation Maximal load At crack initiation brittle DBT ductile Load (kN) 10 0 8 2 6 4 T (°C) -200 -100 0 100 T (°C) -200 -100 0 100
(a) KIcdK/da
KIc (2 % ) (M P a √m ) T (°C) -200 -100 0 100 10 20 30 40 0 KIc dK/da SSY limit brittle DBT ductile d K /d a (M P a √m .m m -1) 80 20 60 70 40 50 30 (b) KIc dK/da KIc (2 % ) (M P a √m ) T (°C) -200 -100 0 100 10 20 30 40 0 10 20 30 40 0 KIc dK/da SSY limit brittle DBT ductile d K /d a (M P a √m .m m -1) 80 20 60 70 40 50 30 80 20 60 70 40 50 30 (b) 5 µm (c) T = 24°C radial direc tion of the weld 5 µm 5 µm (c) T = 24°C radial direc tion of the weld radial direc tion of the weld
toughness at room temperature. The main difference between these steels seems to be the fracture toughness in the ductile domain, which increases with nugget hardness. This is consistent with the similar fracture mechanisms, dimple and particle size for the three steel nuggets: for the investigated welding conditions and sheet thickness, only the yield strength, controlled by their microstructure after cooling, seems to influence their fracture toughness in the ductile regime. Strong fracture deviation was associated with cleavage dominated fracture. Crack initiation occurred perpendicular to the applied load, where Mode I dominates. Cleavage initiation sites found all around the weld suggest a rather uniform value of Mode I stress intensity factor for this test. As cleavage cracks have to deviate to propagate across high-angle boundaries, the influence of Mode II loading, which is not uniform around the weld, may increase during cleavage crack propagation. No correlation appears between crack extension resistance and fracture mechanism (Figs 2b, 3b, 4b).
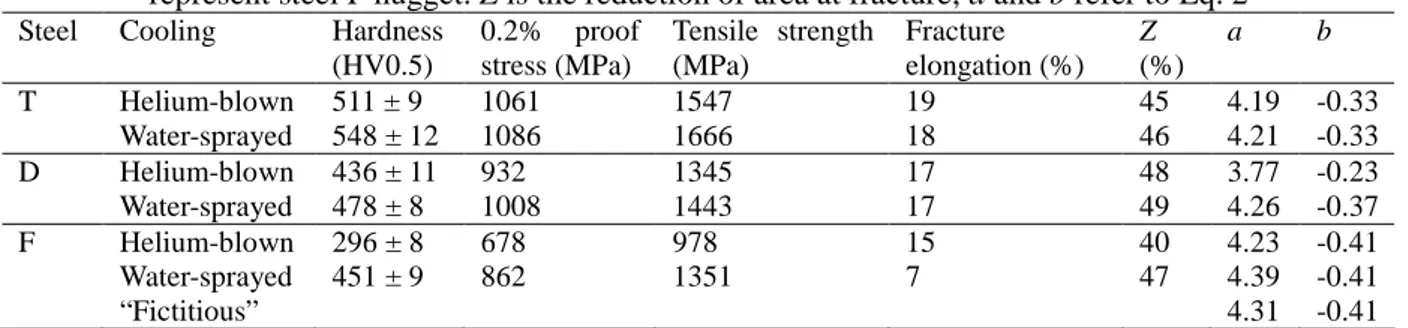
3.2. Tensile properties of simulated nugget microstructures
3.2.1. Tensile properties of smooth specimens
The dependence of yield strength, YS, on temperature was satisfactorily modelled (Fig. 5) using a Zener-Hollomon equation (Eq. 2), with T the absolute temperature andε the elongation rate:
b a T YS = ε 8 10 10 log 10 . (2)
For Steels D and T, tensile properties are not very sensitive to cooling conditions (Table 3) due to the higher hardenability of these steels leading to auto-tempered martensite. The mechanical properties of the nugget were assumed to be similar to those of the helium-blown samples. Since the hardness and microstructure of Steel F nugget are intermediate between those of the martensitic water-sprayed and bainitic helium-blown samples, a “fictitious” material was considered in order to represent Steel F nugget: its mechanical properties and constitutive parameters were thus estimated from those of water-sprayed and helium-blown materials balanced by their respective hardness.
Table 3. Mechanical properties of heat-treated microstructure, nugget (edge) and “fictitious” material used to represent steel F nugget. Z is the reduction of area at fracture; a and b refer to Eq. 2
Steel Cooling Hardness (HV0.5) 0.2% proof stress (MPa) Tensile strength (MPa) Fracture elongation (%) Z (%) a b T Helium-blown Water-sprayed 511 ± 9 548 ± 12 1061 1086 1547 1666 19 18 45 46 4.19 4.21 -0.33 -0.33 D Helium-blown Water-sprayed 436 ± 11 478 ± 8 932 1008 1345 1443 17 17 48 49 3.77 4.26 -0.23 -0.37 F Helium-blown Water-sprayed “Fictitious” 296 ± 8 451 ± 9 678 862 978 1351 15 7 40 47 4.23 4.39 4.31 -0.41 -0.41 -0.41
3.2.2. Tensile properties of notched Steel D specimens
As ductile fracture of the nugget is influenced by fine particles inherited from rapid solidification, heat-treated specimens were not representative of the nugget microstructure concerning ductile fracture. They were only used to derive an estimate of the critical stress necessary to initiate cleavage cracking. Five specimens were tested at -100°C, close to the brittle domain of Steel D nugget. Load vs. notch opening displacement curves presented a small serration around 18 kN, (Point B in Fig. 6a), well before final fracture. This could indicate brittle fracture initiation; no interrupted tensile test was available to prove this. Fracture surfaces (Fig. 6c) exhibited cleavage facets surrounded by ductile shear lips. Close to notch roots, cleavage facets are about 100-200 µm in size, similar to the prior austenite grain size of both helium-blown and nugget edge materials.
Figure 5. (a-c) Yield strength (YS), Zener-Hollomon fit (lines), and tensile strength (TS) of heat-treated steels. (d-f): Tensile curves: experiments (up to necking, thick lines) and model predictions (thin lines)
Figure 6. (a) Load vs. notch opening curves, (b) calculated axial stress along the ligament, and (c) fracture surface close to notch root of DENT specimens of helium-blown Steel D tested at -100°C
4. Mechanical analysis and derivation of a fracture criterion
4.1. Constitutive equationsConstitutive equations were determined from uniaxial tensile tests. The material were considered as elastic-plastic, homogeneous and isotropic, with Young’s modulus E = 210,000 MPa, and Poisson ratio
ν
= 0.3. A von Mises yield criterion was used with a combined linear + Voce-like isotropic strain hardening equation, which reads as follows in the particular case of uniaxial tension:UTS Water YTS Water UTS Helium YTS Helium
Steel D Stress (MPa) 400 800 1200 1600 600 1000 1400 -200 -100 0 100 T (°C) Water-sprayed Helium-blown YS TS (b)
Steel D UTS WaterUTS Helium YTS WaterYTS Helium YTS "nugget" Steel F Stress (MPa) 400 800 1200 1600 600 1000 1400 -200 -100 0 100 T (°C) Water-sprayed Helium-blown YS TS Fictitious (c) Steel F UTS Water YTS Water
UTS Helium YTS Helium Steel T Stress (MPa) 400 800 1200 1600 600 1000 1400 -200 -100 0 100 T (°C) YS TS Water-sprayed Helium-blown (a) Steel T -142°C -120°C -80°C -40°C 0°C 24°C 85°C -142°C -120°C -80°C -40°C 0°C 24°C 85°C (d) Steel D, helium-blown True stress (MPa)
1800 800 1200 1600 600 1000 1400 0 0.05 0.10 plastic strain -120°C -120°C -80°C -80°C -40°C -40°C 0°C 0°C 24°C 24°C (e) Steel F, helium-blown True stress (MPa)
800 1200 400 600 1000 0 0.05 0.10 plastic strain 1200 1600 1000 1400 -120°C -120°C -80°C -80°C -40°C -40°C 0°C 0°C 24°C 24°C Steel F, water-sprayed 0 0.05 0.10 plastic strain 800 600
True stress (MPa)
(f) UTS Water YTS Water
UTS Helium YTS Helium Steel D Stress (MPa) 400 800 1200 1600 600 1000 1400 -200 -100 0 100 T (°C) Water-sprayed Helium-blown YS TS (b)
Steel D UTS WaterUTS Helium YTS WaterYTS Helium YTS "nugget" Steel F Stress (MPa) 400 800 1200 1600 600 1000 1400 -200 -100 0 100 T (°C) Water-sprayed Helium-blown YS TS Fictitious (c) Steel F UTS Water YTS Water
UTS Helium YTS Helium Steel T Stress (MPa) 400 800 1200 1600 600 1000 1400 -200 -100 0 100 T (°C) YS TS Water-sprayed Helium-blown (a) Steel T
UTS Water YTS Water UTS Helium YTS Helium
Steel D Stress (MPa) 400 800 1200 1600 600 1000 1400 -200 -100 0 100 T (°C) Water-sprayed Helium-blown YS TS (b) Steel D
UTS Water YTS Water UTS Helium YTS Helium
Steel D
UTS Water YTS Water UTS Helium YTS Helium
Steel D Stress (MPa) 400 800 1200 1600 600 1000 1400 Stress (MPa) 400 800 1200 1600 600 1000 1400 -200 -100 0 100 T (°C) -200 -100 0 100 T (°C) Water-sprayed Helium-blown Water-sprayed Helium-blown Water-sprayed Helium-blown YS TS (b)
Steel D UTS WaterUTS Helium YTS WaterYTS Helium YTS "nugget" Steel F Stress (MPa) 400 800 1200 1600 600 1000 1400 -200 -100 0 100 T (°C) Water-sprayed Helium-blown YS TS Fictitious (c) Steel F UTS Water YTS Water UTS Helium YTS Helium YTS "nugget" Steel F Stress (MPa) 400 800 1200 1600 600 1000 1400 -200 -100 0 100 T (°C) Water-sprayed Helium-blown YS TS FictitiousUTS Water YTS Water
UTS Helium YTS Helium YTS "nugget" Steel F Stress (MPa) 400 800 1200 1600 600 1000 1400 Stress (MPa) 400 800 1200 1600 600 1000 1400 -200 -100 0 100 T (°C) Water-sprayed Helium-blown Water-sprayed Helium-blown Water-sprayed Helium-blown YS TS Fictitious (c) Steel F UTS Water YTS Water
UTS Helium YTS Helium Steel T Stress (MPa) 400 800 1200 1600 600 1000 1400 -200 -100 0 100 T (°C) YS TS Water-sprayed Helium-blown (a) Steel T
UTS Water YTS Water UTS Helium YTS Helium
Steel T
UTS Water YTS Water UTS Helium YTS Helium
Steel T Stress (MPa) 400 800 1200 1600 600 1000 1400 Stress (MPa) 400 800 1200 1600 600 1000 1400 -200 -100 0 100 T (°C) -200 -100 0 100 T (°C) YS TS Water-sprayed Helium-blown Water-sprayed Helium-blown Water-sprayed Helium-blown (a) Steel T -142°C -120°C -80°C -40°C 0°C 24°C 85°C -142°C -120°C -80°C -40°C 0°C 24°C 85°C (d) Steel D, helium-blown True stress (MPa)
1800 800 1200 1600 600 1000 1400 0 0.05 0.10 plastic strain -120°C -120°C -80°C -80°C -40°C -40°C 0°C 0°C 24°C 24°C (e) Steel F, helium-blown True stress (MPa)
800 1200 400 600 1000 0 0.05 0.10 plastic strain 1200 1600 1000 1400 -120°C -120°C -80°C -80°C -40°C -40°C 0°C 0°C 24°C 24°C Steel F, water-sprayed 0 0.05 0.10 plastic strain 800 600
True stress (MPa)
(f) -142°C -120°C -80°C -40°C 0°C 24°C 85°C -142°C -120°C -80°C -40°C 0°C 24°C 85°C (d) Steel D, helium-blown True stress (MPa)
1800 800 1200 1600 600 1000 1400 0 0.05 0.10 plastic strain -142°C -120°C -80°C -40°C 0°C 24°C 85°C -142°C -120°C -80°C -40°C 0°C 24°C 85°C (d) Steel D, helium-blown True stress (MPa)
1800 800 1200 1600 600 1000 1400 0 0.05 0.10 plastic strain 0 0.05 0.10 plastic strain -120°C -120°C -80°C -80°C -40°C -40°C 0°C 0°C 24°C 24°C (e) Steel F, helium-blown True stress (MPa)
800 1200 400 600 1000 0 0.05 0.10 plastic strain -120°C -120°C -80°C -80°C -40°C -40°C 0°C 0°C 24°C 24°C (e) Steel F, helium-blown True stress (MPa)
800 1200 400 600 1000 0 0.05 0.10 plastic strain 0 0.05 0.10 plastic strain 1200 1600 1000 1400 -120°C -120°C -80°C -80°C -40°C -40°C 0°C 0°C 24°C 24°C Steel F, water-sprayed 0 0.05 0.10 plastic strain 800 600
True stress (MPa)
(f) 1200 1600 1000 1400 -120°C -120°C -80°C -80°C -40°C -40°C 0°C 0°C 24°C 24°C Steel F, water-sprayed 0 0.05 0.10 plastic strain 0 0.05 0.10 plastic strain 800 600
True stress (MPa)
(f) Sp. #1 Sp. #2 Sp. #3 FEM simulation B C E F G A 2000 1200 1000 1400 1600 1800 0 5 10 15 20 0 0.1 0.2 0.3 0.4 0.5 0.6 0.7 0.8 Notch opening displacement (mm) Load (kN)
25
H D
Axial stress (MPa) (a)
Axial stress (MPa)
Distance from notch root (mm) notch root specimen axis
0 0.5 1 1.5 2 2.5 3 0 500 1000 1500 2000 2500 C B A F E D (b) (c) 20 µm Sp. #1 Sp. #2 Sp. #3 FEM simulation B C E F G A 2000 1200 1000 1400 1600 1800 0 5 10 15 20 0 0.1 0.2 0.3 0.4 0.5 0.6 0.7 0.8 Notch opening displacement (mm) Load (kN)
25
H D
Axial stress (MPa) (a) Sp. #1 Sp. #2 Sp. #3 FEM simulation B C E F G A 2000 1200 1000 1400 1600 1800 2000 1200 1000 1400 1600 1800 0 5 10 15 20 0 0.1 0.2 0.3 0.4 0.5 0.6 0.7 0.8 0 0.1 0.2 0.3 0.4 0.5 0.6 0.7 0.8
Notch opening displacement (mm) Load (kN)
25
H D
Axial stress (MPa) (a)
Axial stress (MPa)
Distance from notch root (mm) notch root specimen axis
0 0.5 1 1.5 2 2.5 3 0 500 1000 1500 2000 2500 C B A F E D (b)
Axial stress (MPa)
Distance from notch root (mm) notch root specimen axis
0 0.5 1 1.5 2 2.5 3 0 500 1000 1500 2000 2500 C B A F E D (b) (c)(c) 20 µm20 µm20 µm
(
P)
(
b P)
y b y p y eq H Q Q ε ε σ σ ε σ σ 1 exp 1 1 exp 2 2 1 − − + − − + + = (3)with σeq the von Mises equivalent stress, σy the yield strength, H a linear strain-hardening parameter
mainly used for large amounts of strain, Q1, Q2, b1 and b2 being material parameters. According to
the shape of experimental tensile curves, the values of Q1 and b1 were kept independent of
temperature. The values of
σ
y, H, Q2 and b2 were fitted for each temperature. Parameter H wasdetermined from the constitutive equation [5] of a material similar to Steel D. This yields a value of e.g. 600 MPa at 24°C. The fitted sets of constitutive parameters very satisfactorily described tensile curves (Fig. 5d-f).
4.2. Cleavage crack initiation criterion from mechanical analysis of the DENT specimens
The mechanical analysis of the test was performed in three dimensions thanks to the in-house Z-set finite element software. One-eighth of the specimen was meshed with quadratic bricks with reduced integration. The specimen head and the region close to the notch were respectively attributed constitutive parameters of base metal and of the helium-blown material. Displacement of the specimen head was prescribed as in experiments. The simulated load vs. notch opening curve fits well with experimental results up to a notch opening of ~0.5 mm (Fig. 6a). The axial stress reaches its maximum (σc,p = 1790 ± 40 MPa) at 0.5 mm from the notch root at the onset of experimentally
observed serrations, and (σc,f = 2270 ± 20 MPa ) at 0.8 mm from the notch root for notch opening
corresponding to experimental fracture (Points E-H in Figs 6a and 6b).
4.3. Simplified finite element modelling of the U-shape cross-tensile test
4.3.1. Modelling the UXT test
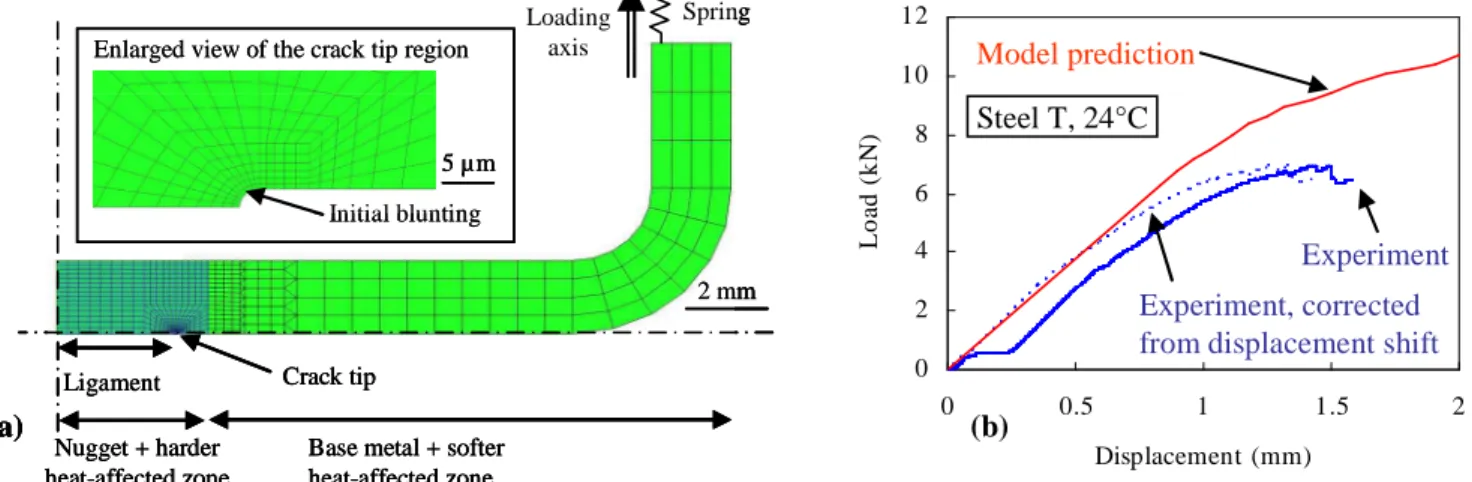
Only the upper part of the specimen was modelled, with usual symmetry conditions. Instead of a U-shaped cross tensile specimen, involving full 3D modelling, a circular-cup geometry was selected and represented by an axisymmetrical model (Fig. 7a). Consequently, the crack is only loaded in Mode I, which can induce dissimilarities with UXT tests especially during crack propagation but here, only crack initiation was considered. The finite element analysis software Abaqus/Implicit Standard was used with CAX4R elements (4-node bilinear axisymmetrical quadrangles with reduced integration and hourglass control). The following simplifying assumptions were made: • Indentations caused by the electrodes, located far from the notch tip were not taken into account.
The spacer inserted in the U specimen was not meshed but taken into account by allowing no displacement along the horizontal axis of the inner side of the flange.
• The ligament was only composed of the nugget section, i.e. the initial crack included both the non-welded interface and the DBZ. The nugget and harder part of the heat-affected zone was assimilated to the nugget material, the softer part of the heat-affected zone being assimilated to the base metal. The boundary between these two regions was taken perpendicular to the interface and located at 0.8 mm from the crack tip.
• Prescribed displacement was applied to a spring on the specimen flange which represents the stiffness of the load line [1]. The load is the resultant force on the spring. The stiffness of the spring (25 kN.mm-1) was fitted to the linear part of the load vs. displacement curves. To this aim, the shift in displacement observed at low loads, probably due to some clearance compensations at the beginning of the tests, were ignored (Fig. 7b).
• To ensure an accurate description of the stress and strain fields around the crack tip, an initial semi-circular blunting was modelled. Taking typical values of KI (60 MPa√m) and σy (1000
Consequently, the initial crack tip radius was set to 2 µm together with a mesh size close to 0.5 µm. Although the weld strength is overestimated by the model (Fig. 7b) (presumably because of neglecting work-hardening in folded regions and/or of the axisymmetry hypothesis), modelling results have been used to estimate stress and strain fields in front of the crack tip.
Figure 7. (a) Simplified finite element model and (b) experimental and simulated UXT load vs. displacement curves of Steel T
4.3.2. Derivation of the stress intensity factor and energy release rate
The finite element model was validated by considering a fully elastic specimen. The difference between the predicted value of KI and that derived from the Lin & Pan formula is only 3 MPa√m
for KI = 60 MPa√m. As a consequence of the elastic-plastic behaviour of the material, the crack tip
singularity was then described by the energy release rate, assimilated to the J-integral. The independence of calculated J with respect to the contour (chosen within the weld material, at least 0.5 mm from the crack tip) was verified in the case of Steel T welds tested at room temperature.
4.4. Assessment of a cleavage crack initiation criterion using the UXT test
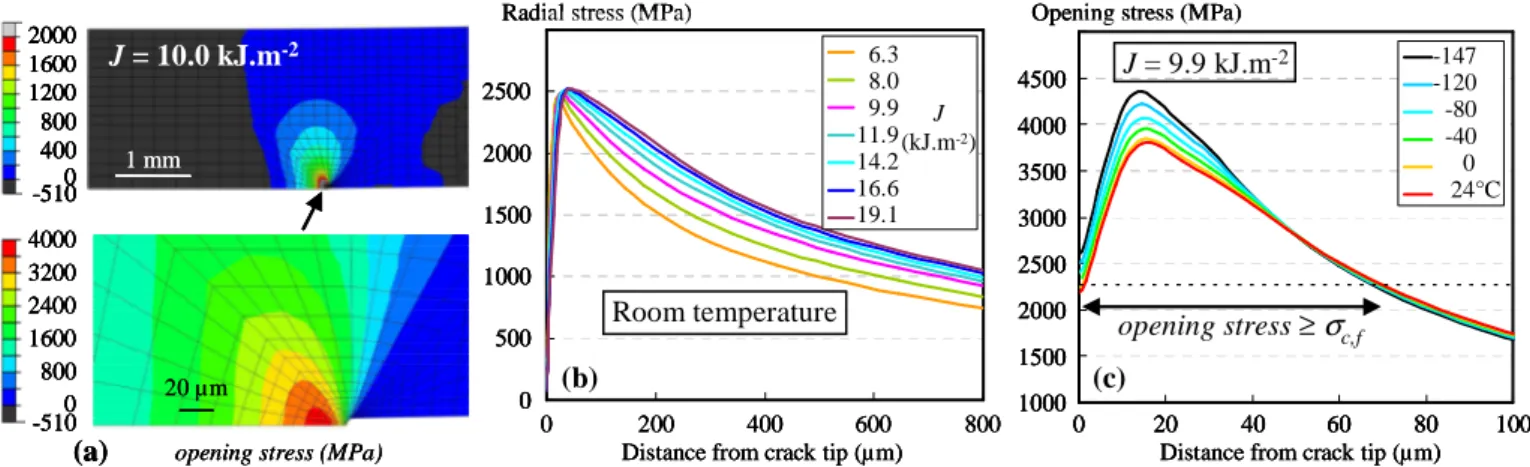
The stress state in the nugget during the UXT test is described here by considering Steel D tested at room temperature (Fig. 8a-b). The central part of the nugget (up to 2mm from the weld centre) is loaded in compression. Positive values of opening stress are concentrated within a narrow region (0.6-0.8 mm in width) in front of the crack tip, leading to high values (up to 4000 MPa). The high radial stress, which can reach 2500 MPa, was attributed to constraints induced by spacers: the base material is not only bent but also stretched along the sheet plane. The high resulting stress triaxiality limits plastic yielding in front of the crack tip. The opening stress ahead of the crack is represented in Fig. 8c for J = 9.9 kJ.m-² (close to the fracture toughness at 0°C.) The opening stress depends on test temperature over 50 µm ahead of the crack tip, i.e. in the plastically deformed region. For a given value of J, decreasing the test temperature tends to increase the maximal opening stress. The distance (~15 µm) at which the stress is highest is almost independent of test temperature.
The Ritchie-Knott-Rice (RKR) model [7] was tentatively applied (Fig. 8c). The region where the opening stress is higher than σc,f (σc,f = 2270 MPa) is about 70 µm in size for J~10 kJ.m-² whatever
the test temperature. This is larger than the plastic zone size (about 50 µ m). As plastic deformation is required to initiate cleavage cracking, crack initiation could be controlled by the extent of the plastic zone rather than by that of the region where the maximum principal stress exceeds its critical value. Cleavage fracture is thus not well described using such a simple approach. A statistical model based on the weakest link like that of Beremin [8] would probably be more appropriate.
2 mm Spring Nugget + harder heat-affected zone Crack tip Ligament 5 µm Enlarged view of the crack tip region
Initial blunting
Base metal + softer heat-affected zone Loading axis (a) 0 2 4 6 8 10 12 0 0.5 1 1.5 2 Displacement (mm) L o a d ( k N ) Model prediction Experiment Experiment, corrected from displacement shift
Steel T, 24°C (b) 2 mm Spring Nugget + harder heat-affected zone Crack tip Ligament 5 µm Enlarged view of the crack tip region
Initial blunting
Base metal + softer heat-affected zone Loading axis (a) 2 mm 2 mm Spring Nugget + harder heat-affected zone Crack tip Ligament 5 µm Enlarged view of the crack tip region
Initial blunting 5 µm 5 µm Enlarged view of the crack tip region
Initial blunting
Base metal + softer heat-affected zone Loading axis (a) 0 2 4 6 8 10 12 0 0.5 1 1.5 2 Displacement (mm) L o a d ( k N ) Model prediction Experiment Experiment, corrected from displacement shift
Steel T, 24°C (b) 0 2 4 6 8 10 12 0 0.5 1 1.5 2 Displacement (mm) L o a d ( k N ) Model prediction Experiment Experiment, corrected from displacement shift
Steel T, 24°C
Figure 8. Model predictions of (a) opening stress field at room temperature in the weld, (b) radial stress along the interface as a function of J and (c) opening stress profile as a function of temperature for Steel D
4.5. Assessment of a ductile fracture criterion using the UXT test
By using the Rice & Tracey model [9], the instantaneous void growth rate can be written as: dp R dR =α τ 2 3 exp , leading to dp R R p p
∫
= 0 2 3 exp ln 0 τ α (4)In Eq. 4, R is the void radius (R0 is its initial value), α = 0.283,
τ
is the stress triaxiality ratio, p is theequivalent plastic strain and p0 is the equivalent plastic strain at void nucleation. In the absence of
interrupted UXT tests, the value of p0 was set to zero. Determination of the critical value (R/R0)c of
R/R0 requires a microstructure representative of the fine particle-containing nugget and could thus
only be fitted from the UXT tests. Macroscopic fracture, characterized by J = Jc, occurs as soon as
the local criterion R/R0 = (R/R0)c is satisfied over a critical distance dc ahead of the crack tip. This
critical distance is usually close to a typical distance involved in the fracture process: the initial void spacing for instance. It was arbitrarily set to dc = 8µm, i.e., two times the void spacing observed in
fracture surfaces (Fig. 3c).
Figure 9. (a) Predicted void radius at room temperature and (b) comparison between experimental (full symbols) and predicted Jc (open symbols interpolated with lines) as a function of temperature
The Rice & Tracey model was first applied to ductile fracture of Steel F nugget at room temperature. The experimental fracture toughness of 58 MPa√m corresponds to Jc~15 kJ.m-2, under a plane strain
assumption. This value is reached when R/R0 exceeds 2.05 over dc (Fig. 9a). The value of (R/R0)c is
thus estimated to around 2.05. The void growth model was then applied to describe the evolution of
J = 6.3 J/m² J = 8.0 J/m² J = 9.9 J/m² J = 11.9 J/m² J = 14.2 J/m² J = 16.6 J/m² J = 19.1 J/m² Room temperature Radial stress (MPa)
0 500 1000 1500 2000 2500
Distance from crack tip (µm)
0 200 400 600 800 6.3 8.0 9.9 11.9 14.2 16.6 19.1 J (kJ.m-2) (b) (a) 1 mm 20 µm J = 10.0 kJ.m-2 4000 3200 2400 1600 800 0 -510 400 0 800 1200 1600 2000 -510
opening stress (MPa)
-147°C -120°C -80°C -40°C 0°C 24°C opening stress ≥σc,f J = 9.9 kJ.m-2
Opening stress (MPa)
1000 1500 2000 2500 3000 3500 4000 4500
Distance from crack tip (µm)
0 20 40 60 80 100 (c) -147 -120 -80 -40 0 24°C J = 6.3 J/m² J = 8.0 J/m² J = 9.9 J/m² J = 11.9 J/m² J = 14.2 J/m² J = 16.6 J/m² J = 19.1 J/m² Room temperature Radial stress (MPa)
0 500 1000 1500 2000 2500
Distance from crack tip (µm)
0 200 400 600 800 6.3 8.0 9.9 11.9 14.2 16.6 19.1 J (kJ.m-2) (b) J = 6.3 J/m² J = 8.0 J/m² J = 9.9 J/m² J = 11.9 J/m² J = 14.2 J/m² J = 16.6 J/m² J = 19.1 J/m² Room temperature Radial stress (MPa)
0 500 1000 1500 2000 2500 0 500 1000 1500 2000 2500
Distance from crack tip (µm)
0 200 400 600 800 6.3 8.0 9.9 11.9 14.2 16.6 19.1 J (kJ.m-2) (b) (a) 1 mm 20 µm J = 10.0 kJ.m-2 4000 3200 2400 1600 800 0 -510 400 0 800 1200 1600 2000 -510
opening stress (MPa)
(a) 1 mm 1 mm 20 µm 20 µm J = 10.0 kJ.m-2 4000 3200 2400 1600 800 0 -510 4000 3200 2400 1600 800 0 -510 400 0 800 1200 1600 2000 -510 400 0 800 1200 1600 2000 -510 400 0 800 1200 1600 2000 -510
opening stress (MPa)
-147°C -120°C -80°C -40°C 0°C 24°C opening stress ≥σc,f J = 9.9 kJ.m-2
Opening stress (MPa)
1000 1500 2000 2500 3000 3500 4000 4500
Distance from crack tip (µm)
0 20 40 60 80 100 (c) -147 -120 -80 -40 0 24°C -147°C -120°C -80°C -40°C 0°C 24°C opening stress ≥σc,f J = 9.9 kJ.m-2
Opening stress (MPa)
1000 1500 2000 2500 3000 3500 4000 4500 1000 1500 2000 2500 3000 3500 4000 4500
Distance from crack tip (µm)
0 20 40 60 80 100 0 20 40 60 80 100 (c) -147 -120 -80 -40 0 24°C J = 6.2 kJ/m² J = 8.1 kJ/m² J = 10.1 kJ/m² J = 11.9 kJ/m² J = 13.5 kJ/m² Jc = 15.0 kJ/m² J = 16.4 kJ/m²
Distance ahead from crack tip (µm)
R /R 0 0 0.5 1.0 1.5 2.0 2.5 3.0 0 10 20 30 40 50 8 µm (~2 x void spacing) (R/R0)c Steel F, 24°C 6.2 8.1 10.1 11.9 13.5 15.0 (= Jc) 16.4 J (kJ.m-2) (a)
Steel D: experiment Steel D: model Steel F: experiment Steel F: model
Ductile regions: Jc (k J. m -2) Steel F Steel D RT -2000 -100 0 100 T (°C) 5 10 15 20 25 Prediction of ductile fracture D F D F (b) J = 6.2 kJ/m² J = 8.1 kJ/m² J = 10.1 kJ/m² J = 11.9 kJ/m² J = 13.5 kJ/m² Jc = 15.0 kJ/m² J = 16.4 kJ/m²
Distance ahead from crack tip (µm)
R /R 0 0 0.5 1.0 1.5 2.0 2.5 3.0 0 10 20 30 40 50 8 µm (~2 x void spacing) (R/R0)c Steel F, 24°C 6.2 8.1 10.1 11.9 13.5 15.0 (= Jc) 16.4 J (kJ.m-2) (a) J = 6.2 kJ/m² J = 8.1 kJ/m² J = 10.1 kJ/m² J = 11.9 kJ/m² J = 13.5 kJ/m² Jc = 15.0 kJ/m² J = 16.4 kJ/m²
Distance ahead from crack tip (µm)
R /R 0 0 0.5 1.0 1.5 2.0 2.5 3.0 0 0.5 1.0 1.5 2.0 2.5 3.0 0 10 20 30 40 50 0 10 20 30 40 50 8 µm (~2 x void spacing) (R/R0)c Steel F, 24°C 6.2 8.1 10.1 11.9 13.5 15.0 (= Jc) 16.4 J (kJ.m-2) (a)
Steel D: experiment Steel D: model Steel F: experiment Steel F: model
Ductile regions: Jc (k J. m -2) Steel F Steel D RT -2000 -100 0 100 T (°C) 5 10 15 20 25 Prediction of ductile fracture D F D F (b)
Steel D: experiment Steel D: model Steel F: experiment Steel F: model Steel D: experiment Steel D: model Steel F: experiment Steel F: model
Ductile regions: Jc (k J. m -2) Steel F Steel F Steel D RT -2000 -100 0 100 T (°C) 5 10 15 20 25 0 5 10 15 20 25 Prediction of ductile fracture D F D F (b)
the fracture toughness in the ductile temperature range of Steel F and Steel D nuggets (Fig. 9b). The values of dc were set to two times the initial void spacing and (R/R0)c = 2.05 for the two materials.
Void growth occurs much more rapidly with J when the temperature increases, due to the decrease in yield strength and strain hardening. Consequently, the values of the J-integral for which
R/R0 > (R/R0)c over distance dc decrease with increasing temperature. The values of Jc calculated
from the void growth model were compared to those experimentally determined thanks to the UXT tensile tests with a plane strain approximation to estimate Jc from KIc (Fig. 9b). For Steel F, the
decrease in Jc in the ductile region is qualitatively predicted but the predicted fall of Jc at higher
temperatures is underestimated. A possible source of discrepancy is the extrapolation of constitutive parameters for temperatures above 24°C. Model predictions are satisfactory for Steel D nugget at 120°C where ductile fracture prevails.
5. Conclusions
The U-shape cross-tensile (UXT) test was applied to the local approach of fracture of high strength steel resistance spot welds. A ductile-to-brittle transition curve was obtained for the three steels. For two of them, the transition encompasses room temperature.
• Brittle fracture occurred by cleavage cracking. The critical cleavage initiation stress was estimated to around 2270 MPa. The lower the temperature, the higher the tendency to crack deviation in the UXT test, leading to macroscopic fracture toughness that could reach that obtained in ductile fracture (~60 MPa√m). The complex stress state in the UXT test combines in-plane tension and bending ahead of the crack tip. This reduces the size of the plastic zone; a simple approach such as the RKR model is not applicable.
• Ductile voids initiate from a dense distribution of fine sulphide or phosphide precipitates that result from rapid solidification of the weld. The high stress triaxiality and the small distance between voids lead to rapid interfacial crack propagation without crack deviation. This behaviour was quantitatively related to microstructural features using a Rice and Tracey approach.
References
[1] S. Dancette, D. Fabrègue, V. Massardier, J. Merlin, T. Dupuy, M. Bouzekri, Experimental and modelling investigation of the failure resistance of Advanced High Strength Steels spot welds. Eng Fract Mech, 78 (2011) 2259-2272.
[2] Y.J. Chao, Failure mode of spot welds: interfacial versus pullout. Sci. Technol. Welding Joining, 8 (2003) 133-137.
[3] F. Krajcarz, A.F. Gourgues-Lorenzon, E. Lucas, A. Pineau, Fracture toughness of the molten zone of resistance spot welds, submitted to Int J Fract (January, 2013)
[4] P.C. Lin, J. Pan, Closed-form structural stress and stress intensity factor solutions for spot welds in commonly used specimens. Eng Fract Mech, 75 (2008) 5187-5206.
[5] R. Lacroix, A. Lens, G. Kermouche, J.M. Bergheau, H. Klöcker, Local mechanical characterisation of a resistance spot weld of advanced high strength steel, in: Proc. 19th French Congress of Mechanics, AFM, Courbevoie, 2011 (in French) http://hdl.handle.net/2042/37135. [6] F. Krajcarz, A. F. Gourgues, V. Bochard, E. Lucas, M. Bobadilla, Development and solidification of the molten zone of resistance spot welds : influence of welding parameters, in : Matériaux 2010, paper 1211 (2010) (in French) http://hal-ensmp.archives-ouvertes.fr/hal-00570567. [7] R.O. Ritchie, J. Knott, J.R. Rice, On the relationship between critical tensile stress and fracture toughness in mild steel, J Mech Phys Solids, 21 (1973) 395-410.
[8] F.M. Beremin, A local criterion for cleavage fracture of a nuclear pressure vessel steel. Metall Trans A, 14 (1983) 2277-2287.
[9] J.R. Rice, D.M. Tracey, On the ductile enlargement of voids in triaxial stress fields, J Mech Phys Solids, 17 (1969) 201-217.