HAL Id: hal-01387863
https://hal.inria.fr/hal-01387863
Submitted on 26 Oct 2016
HAL is a multi-disciplinary open access
archive for the deposit and dissemination of
sci-entific research documents, whether they are
pub-lished or not. The documents may come from
teaching and research institutions in France or
abroad, or from public or private research centers.
L’archive ouverte pluridisciplinaire HAL, est
destinée au dépôt et à la diffusion de documents
scientifiques de niveau recherche, publiés ou non,
émanant des établissements d’enseignement et de
recherche français ou étrangers, des laboratoires
publics ou privés.
Distributed under a Creative Commons Attribution| 4.0 International License
Variety Steering Towards Sustainability: A Coupled
Evaluation and Optimization Approach
Khaled Medini, Catherine Cunha, Alain Bernard
To cite this version:
Khaled Medini, Catherine Cunha, Alain Bernard. Variety Steering Towards Sustainability: A Coupled
Evaluation and Optimization Approach. IFIP International Conference on Advances in Production
Management Systems (APMS), Sep 2014, Ajaccio, France. pp.170-177,
�10.1007/978-3-662-44736-9_21�. �hal-01387863�
Variety steering towards sustainability: a coupled
evaluation and optimization approach
Khaled Medini1, Catherine Da Cunha2, Alain Bernard2
1
Ecole Nationale Supérieure des Mines de Saint Etienne, Saint Etienne, France [email protected]
2
LUNAM Université, Ecole Centrale de Nantes, IRCCyN UMR CNRS 6597, Nantes, France {catherine.da-cunha,alain.bernard}@irccyn.ec-nantes.fr
Abstract. This paper proposes a coupled evaluation and optimization approach
to steer product variety towards environmental and economic sustainability. A predefined set of indicators enriched with weights given by the user ensures the evaluation, while optimization uses linear programming. The paper highlights the impact of variety steering on environmental and economic sustainability in-dicators. Additionally, the paper underlines the need to translate regulations into concrete company goals through integrating carbon markets into the proposi-tion.
Keywords: Variety, sustainability, evaluation, linear programming, AHP
1
Introduction
The broadening of customer requirements and emergence of market niches resulted in the proliferation of product variety. ElMaraghy et al. (2013) define variety as a num-ber or collection of different things of a particular class of the same general kind. Producers seek to provide a wider spectrum of choice to gain market share and ac-commodate as many product variants as possible (ElMaraghy et al., 2013). However, each product variant induces a certain cost and environmental impact and generates a given profit. The challenge is to keep enough variety to meet customer requirements while steering such variety towards sustainability. The scope of current paper is fo-cused on steering variety towards environmental and economic sustainability. It pre-sents a coupled evaluation and optimization approach that helps managers take deci-sions on product variants' production volumes while considering the economic and environmental criteria. A predefined set of indicators enriched with weights reflecting each indicator's relative importance ensures the evaluation. The optimization uses linear programming to find trade-offs between all indicators while considering carbon markets.
The rest of the paper is organized as follows: section 2 provides a brief review of green supply chain performance evaluation and optimization. Section 3 presents the proposed approach comprised of indicators' weighting and optimization. Section 4
illustrates the proposition with a case study. The paper ends with conclusions and discussion, presented in section 5.
2
State of the art
2.1 Sustainability performance evaluation
Literature is rich in sustainability evaluation frameworks and indicators' systems. Many of them focus on the external reporting of company performance (Global Re-porting Initiative, 2002; UNEP, 2009). Beyond benchmarking purposes, more meth-odological guidance is required to support decision makers in taking the "right" deci-sions on product, production process, and supply chain design alternatives. In this vein, life cycle thinking gained a lot of interest as it expanded the focus from produc-tion sites to the whole product life cycle. Life Cycle Assessment (LCA) is a method for assessing the environmental impact of product throughout its life cycle phases (ISO 14040, 2006). Dekker et al. (2012) enumerated several metric systems applied to supply chains, which, however, focused only on greenhouse gases emissions.
Recently, a comprehensive assessment model was proposed to assess sustainability performance of mass customized solutions: S-MC-S (Sustainable Mass Customization – Mass Customization for Sustainability) (Bettoni et al., 2013). The S-MC-S assess-ment model relies on a mixed life cycle and multi-level perspective. The life cycle aspect considers product life cycle phases (i.e. extraction, material processing, manu-facturing, logistics, etc.). The multi-level aspect considers the product, production processes and supply chain levels. Indicator formulas are implemented in an assess-ment engine connected to the Ecoinvent1 data base which ensures more reliability of the indicator values (Pedrazzoli et al., 2012). However, a critical issue is still the high number of indicators which may compromise the decision making process. One way to address this is by aggregating indicators. The Analytic Hierarchy Process (AHP) (Saaty, 2008) is a common method that can be applied in this context.
2.2 Green supply chains optimization
Dekker et al. (2012) identified a lack of life cycle perspective in green operations optimization through reviewing applications of operations research to green logistics. Most studies that integrate environmental considerations into supply chain optimiza-tion focus on transportaoptimiza-tion, warehousing and inventory management (Bauer et al., 2010; Wang et al., 2011; Abdallah et al., 2012).
Moreover, laws, regulations and government action at large, are often addressed only through empirical studies that analyse their relevance to company strategies (Tan and Rae, 2009). One important achievement in this respect is the EU Emissions Trad-ing System (EU ETS) resultTrad-ing from the Kyoto Protocol. AccordTrad-ing to this system, companies receive a certain carbon emission allowance (i.e. threshold). They have to
1
buy or sell a given amount of carbon emissions according to their effective emissions during a given period of time (EP and CEU, 2009). EU ETS motivates companies to engage in sustainable development, since it compels them to jointly optimize both economic and environmental performances.
3
Proposed approach
The proposed approach is comprised of two steps: weighting and optimization. First step relies on interviews with company manager, while second one uses these weights for optimizing variants production volumes.
3.1 Weighting
Company managers weight indicators according to their priorities, using the Analyti-cal Hierarchy Process (AHP). AHP is a widely accepted technique used in decision making. In our approach, we assume that a predefined set of indicators , is already available at the company, such that is relative to one produced unit of . Manager performs a pair wise comparison of the indicators during inter-views. The result is the matrix (Eq. 1), where is the relative importance of
indi-cator over indiindi-cator . The average value of normalized (Eq. 2) results in the
weight of indicator (Eq. 3).
( ) ] ] (1) ∑ (2) ∑ (3)
In order to check the consistency of the judgements a consistency ratio ( ) is calculated according to Eq. 4. If is lower than judgements are said to be consistent (Saaty, 2008).
[ ∑ ]
(4)
3.2 Optimization
Optimization aims to reduce costs and the environmental impact (and thus increase profit) by varying production volumes of product variants, these are represented by . The backbone of the objective functions is indicator values such that refers to product variant and refers to the indicator, and is the number of vari-ants. We define , such that if an increase of the value of indicator is de-sired, otherwise. For each indicator , an objective function is calculated as shown in Eq. 5.
∑ (5) We consider the cost/profit that can be induced by Eco taxes as follows: if the amount of greenhouse gases passes a given threshold, , then company has to pay carbon tax (calculated as shown in Eq. 6). is a Boolean variable such that if indica-tor contributes to greenhouse gas emissions, otherwise (Eq. 7). is the emis-sions' unitary cost in the company's carbon market. When a company's emissions respect the allowed amount of emissions, it is paid by other companies where emis-sions exceed such a threshold.
∑ ∑ (6)
For optimization, we use the weighted sum scalarization technique (Ehrgott, 2013). Accordingly, the function that needs to be optimized is the weighted sum of the objec-tive convex functions . Here, we propose to use the weights , given by the manager to each of the indicators . The objective function can be written as in Eq. 7, where is the weight of the cost indicator:
∑ (7)
Eq. 7 can then be written as follows:
∑ ∑ (8) Let and be the minimum and maximum values of possible production
vol-umes of variant , respectively (Eq. 9). Additionally let be the total production volume (Eq. 10). , and can be determined based on expected sales and
production capacity.
(9)
∑ (10)
The subsequent optimization model is as follows:
∑ ∑ s.t.
∑
4
Case study
We applied our proposed approach to a furniture manufacturer providing several vari-ants of customized kitchens to the luxury market. The company has three product lines. Our study involves one product line comprising 6 variants. It aims to balance the production between these variants so as to minimize the environmental impact and costs, for a given demand variation amplitude. Our approach addresses a particular aspect of product diversity by finding optimal production distribution between vari-ants. To do so, the first step is to weight the indicators using pair wise comparisons and AHP. The second step is to solve the linear programming model to come up with a given distribution of the production volumes among variants. In current research we
consider only weights that are calculated by AHP. This might be a burden for the optimization because we only consider a single point of the Pareto curve (depicting Pareto optimal solutions). However we base our model on the assumption that the chosen weights are most suitable to the company.
4.1 Indicators weighting
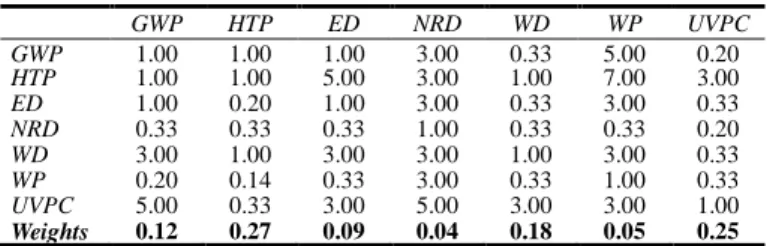
The predefined list of indicators used in the case study is taken from the S-MC-S assessment model (Medini et al., 2011; Bettoni et al., 2013). It is presented in Table 1. Table 2 summarizes pairwise comparisons of the indicators.
After applying AHP, subsequent weights are represented in the last row of Table 2. Consistency Ratio (CR) calculated according to Eq. 4 is . This value is lower than , and judgements are then said to be acceptable. Afterwards, indicators values are calculated by an assessment engine connected to an environmental data base (Pedrazzoli et al., 2012). Data concerning the 6 variants is entered through a set of product, process and supply chain editors. Each of these variants is characterized with given material type, dimensions, shape, etc. The description of variants, however, is beyond the scope of this paper.
Table 1. Indicators definitions
Indicator Unit of measure
GWP – Global Warming Potential kg eq. CO2
HTP – Human Toxicity Potential kg eq. 1,4-DCB ED – Energy Depletion MJ NRD - Natural Resources Depletion Kg antimony eq. WD – Water Depletion m3
WP - Waste Production kg UVPC - Unitary Production Cost €
Table 2. Indicators pair-wise comparisons
GWP HTP ED NRD WD WP UVPC GWP 1.00 1.00 1.00 3.00 0.33 5.00 0.20 HTP 1.00 1.00 5.00 3.00 1.00 7.00 3.00 ED 1.00 0.20 1.00 3.00 0.33 3.00 0.33 NRD 0.33 0.33 0.33 1.00 0.33 0.33 0.20 WD 3.00 1.00 3.00 3.00 1.00 3.00 0.33 WP 0.20 0.14 0.33 3.00 0.33 1.00 0.33 UVPC 5.00 0.33 3.00 5.00 3.00 3.00 1.00 Weights 0.12 0.27 0.09 0.04 0.18 0.05 0.25 4.2 Optimization
The function that needs to be minimized is represented by Eq. 11 to 13, where is the variant, with . We propose the use of another indicator, , that includes and cost incurred by the case company in the carbon market. We in-troduce an income indicator as depicted by Eq. 15. Let be the amount of green-house gases ( ) the case company can emit in a given carbon market, be the
emis-sions unitary cost ( ) and be the total production volume ( ). GWP is the only indicator that represents greenhouse gases emissions.
∑ (11) s.t. if } (12) if (13) ∑ (14)
Indicators values and production volumes are represented in Table 3. Minimum ( ) and maximum ( ) production volumes are defined. Their values shown in
Table 3 are chosen based on average data from the case company.
Table 3. Variants data
Variants Indicators values Production volumes GWP HTP ED NRD WD WP UVPC 1 20.95 11.71 1368.3 0.19 0.17 2.00 11.21 6 10 2 23.56 16.87 1485.2 0.22 0.19 2.27 13.41 6 10 3 22.84 16.69 1444.4 0.21 0.18 2.27 14.35 6 10 4 22.36 12.53 1471.4 0.21 0.18 2.14 13.80 6 10 5 23.07 12.84 1518.2 0.22 0.19 2.18 16.10 60 64 6 22.10 12.57 1466.4 0.21 0.18 2.15 14.86 60 64
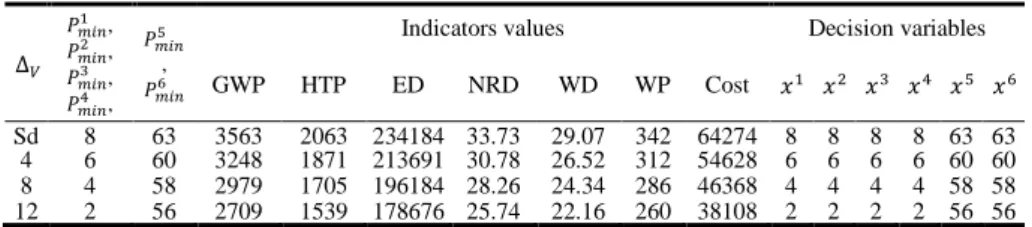
The linear programming problem is solved using Microsoft Office Excel solver and by choosing Simplex method. We varied in order to check the impact of produc-tion volume variance on the indicators. Table 4 shows the results obtained for differ-ent values of such that . Columns 3 to 10 represent the sum of
indicators among all variants. The first row of the table relates to the standard (Sd) situation within the case study, that is: and
. Optimal solution fitting such standard situation is as follows:
producing 8 units of each of variants 1 to 5 and 63 units of each of variants 5 and 6. Data relating to this situation are described in detail in Table 3.
Table 4. Production volumes variance impact on indicators (∑ )
, , , , ,
Indicators values Decision variables
GWP HTP ED NRD WD WP Cost
Sd 8 63 3563 2063 234184 33.73 29.07 342 64274 8 8 8 8 63 63 4 6 60 3248 1871 213691 30.78 26.52 312 54628 6 6 6 6 60 60 8 4 58 2979 1705 196184 28.26 24.34 286 46368 4 4 4 4 58 58 12 2 56 2709 1539 178676 25.74 22.16 260 38108 2 2 2 2 56 56
As shown, in Table 3, all indicators values decrease with the increase of the gap be-tween minimum and maximum production volumes of each variant . Such a de-crease is expected, since the model has as many options as the interval of decision variables (production volumes of the variant) increases. It is then more likely to find more optimal solutions. The manager, for instance, can select one of the proposed solutions according to the production system capacity that determines which the company can afford. The trend that can be noticed in the solutions offered by the
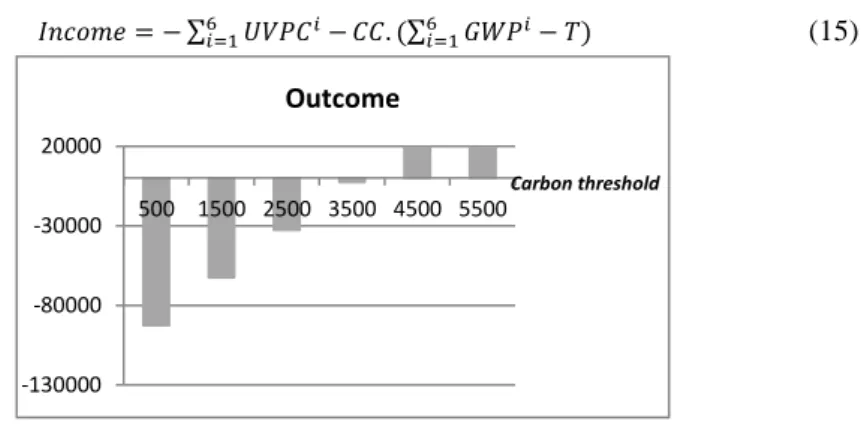
model (i.e. decision variables) values is the minimization of total production volumes of the variants. The lower the variant minimal production volume, the lower is total production volume. Figure 1 shows the variation of the income for different carbon market threshold values, with:
∑ ∑ (15)
Fig. 1. Carbon threshold impact on income
Company's greenhouse gases emissions amount to approximately . Thus, it incurs a carbon cost until the threshold exceeds this value, then revenue is generated by the reimbursement to the company for the non-emitted but allowed amount of greenhouse gases. This highlights the importance of considering the carbon market in the optimization of the economic and environmental performance of the company.
5
Conclusions
In this paper we propose a combined evaluation and optimization approach to miti-gate variety impact on sustainability. The evaluation relies on sustainability perfor-mance indicators connected to an external environmental data base. Indicators are weighted according to company priorities, thus providing more decision support to managers. Optimization aims to minimize emissions and cost through balancing pro-duction volumes between variants and integrating the carbon market. Propro-duction ca-pacity and demand are considered at this point. The originality of our approach lies in coupling performance evaluation and optimization. Moreover, the indicators used in the evaluation consider product life cycle phases (i.e. extraction, manufacturing, transportation, etc.).
The paper underlines the impact of variety steering on sustainability indicators. When the variants' production volumes are flexible, the cost and environmental im-pact are lower. Furthermore, the paper points out the relevance of the carbon market to company environmental and economic performances. From this, it follows that environmental considerations should be considered from a win-win perspective rather than an external constraint. In this sense optimizing company sustainability perfor-mance generates economic value (e.g. reimbursement from the carbon market) instead of making companies incur additional costs.
-130000 -80000 -30000 20000 500 1500 2500 3500 4500 5500 Carbon threshold Outcome
6
References
1. Abdallah, T., Diabat, A., Simchi-Levi, D., 2012. Sustainable supply chain design: a closed-loop formulation and sensitivity analysis,Production Planning & Con-trol, 23(2-3), 120-133.
2. Bauer, J., Bektas, T., and Crainic, T.G., 2010. Minimizing greenhouse gas emis-sions in intermodal freight transport: an application to rail service design. Journal of the Operational Research Society, 61, 530–542.
3. Bettoni, A., Corti, D., Fontana, A., Zebardast, M., and Pedrazzoli, P., 2013. Sus-tainable Mass Customization Assessment, in: Carneiro L.M., Jasinski T., Zolgha-dri M., Pedrazzoli P.(Ed.), Intelligent Non-hierarchical Manufacturing Networks, John Wiley & Sons, Inc., 249-276.
4. Dekker, R., Bloemhof, J., and Mallidis, I., 2012. Operations research for green logistics – an overview of aspects, issues, contributions and challenges, European Journal of Operational Research, 219(3), 671–679.
5. ElMaraghy, H., Schuh, G., ElMaraghy, W., Piller, F., Schönsleben, P., Tseng, M., and Bernard, A. 2013. Product Variety Management, CIRP Annals - Manufactur-ing Technology, 62(2), 629–652.
6. European Parliament (EP) and Council of the European Union (CEU) (2009). Di-rective 2009/29/EC of the European parliament and of the council of 23 April 2009. Official Journal of the European Union. Online, accessible from : http://eur-lex.europa.eu/LexUriServ/LexUriServ.do?uri=OJ:L:2009:140:0063:008 7:EN:PDF.
7. Ehrgott, M. A, 2013. A discussion of scalarization techniques for multiple objec-tive integer programming. Annals of Operations Research, 147(1),343-360. 8. Global Reporting Initiative, 2002. Sustainability reporting guidelines, Global
Re-porting Initiative, Boston, USA.
9. ISO 14040 (2006). Environmental Management – Life Cycle Assessment – Principles and Framework. International Organization of Standardization. 10. Jorgensen, A., Le Bocq, A., Nazarkina, L., and Hauschild, M., 2008.
Methodolo-gies for social life cycle assessment. International Journal of Life Cycle Assess-ment, 13(2), 96-103.
11. Medini, K., Bettoni, A., Fontana, A., Corti D., and Zebardast, M., 2011. S-MC-S - D3.1 Assessment Model, European Commission, 507p.
12. Pedrazzoli, P., Alge, M., Bettoni, A., Canetta, L., 2012. Modeling and Simulation Tool for Sustainable MC Supply Chain Design and Assessment, In: Proc. of APMS 2012, Rhodes, Greece.
13. Saaty, T. L., 2008. Decision making with the analytic hierarchy process, Interna-tional Journal Services Sciences, 1(1), 83-98.
14. Tan, K.H., and Rae, R.H., 2009. Uncovering the links between regulation and performance measurement, International Journal of Production Economics, 122(1), 449-457.
15. United Nations Environment Programme (UNEP), 2009. Life Cycle Manage-ment: A Business Guide to Sustainability. Online, accessible from: http://www.unep.org/pdf/dtie/DTI0889PA.pdf.
16. Wang, F., Lai, X., and Shi, N., 2011. A multi-objective optimization for green supply chain network design, Decision Support Systems, 51 (2), 262–269.