UNIVERSITÉ DE MONTRÉAL
POLYLACTIDE BASED NANOCOMPOSITES: PROCESSING,
STRUCTURE AND PERFORMANCE RELATIONSHIP
SHAHIR KARAMI
DÉPARTEMENT DE GÉNIE CHIMIQUE ÉCOLE POLYTECHNIQUE DE MONTRÉAL
THÈSE PRÉSENTÉE EN VUE DE L’OBTENTION DU DIPLÔME DE PHILOSOPHIAE DOCTOR
(GÉNIE CHIMIQUE) JUIN 2015
UNIVERSITÉ DE MONTRÉAL
ÉCOLE POLYTECHNIQUE DE MONTRÉAL
Cette thèse intitulée:
POLYLACTIDE BASED NANOCOMPOSITES: PROCESSING,
STRUCTURE AND PERFORMANCE RELATIONSHIP
présentée par: KARAMI Shahir
en vue de l’obtention de diplôme de: Philosophiae Doctor a été dûment acceptée par le jury d’examen constitué de: M.PERRIER Michel, Ph. D., président
M. LAFLEUR Pierre, Ph. D., membre et directeur de recherche M. AJJI Abdellah, Ph. D., membre
DEDICATION
First and foremost, I would like to express my deep gratitude to my supervisor, Prof. Pierre G Lafleur. It was a wonderful opportunity to work with him. He is not only an experienced and intelligent professor but also he is an excellent psychologist. He has been an inspiration on how to make great strides towards cracking the obstacles.
I would take this opportunity to thank to all technical staff and faculty members at Chemical Engineering Department of École Polytechnique de Montréal for their help. Special thank goes to Karen Stoeffler of Polymer Bioproducts at National Research Council Canada, who truly supported me through this venture. I offer my deepest thanks to Dr.Daniel Fortin of Université de Sherbrooke, for all those instructive discussions. I also thank Mazen Samara of Concordia University, Dr.Ahmad Zohrevand, Dr.Amir Hossein Maani, and Dr.Nima Khadem for their unforgettable collaborations.
I recognize the financial support from NSERC, Natural Science and Engineering Research Council of Canada, and CREPEC, Research Center for High Performance Polymer and Composite Systems. To my heart's content, a special acknowledgement goes to my beloved mom, Fariba, my wonderful dad, Shahram, and my little brother, Shahin. Their support has been unconditional all these days, despite my countless complaints. I am also grateful to my girlfriend, Matin, who has supported me through good and bad times, no matter what. Lastly, I also sincerely thank all my friends and colleagues for the encouragement and understanding.
Les polymères biodégradables sont une alternative aux polymères à base de pétrole pour l'industrie de l'emballage. De plus, les fluctuations du marché pétrolier forcent les manufacturiers à trouver des produits de substitution aux matières premières non renouvelables. L'acide Polyactide (PLA), avec une production à grande échelle, est le polymère biodégradable le plus utilisé. Cependant, l'utilisation du PLA pour l'emballage est limitée à cause de sa fragilité et de ses faibles propriétés barrières. L'objectif principal de cette thèse est de comprendre la relation entre les paramètres du procédé, la microstructure et les propriétés du film de PLA.
Des nanocomposites de PLA ont été préparés à l'aide d'un procédé de mélange à l'état fondu. La dispersion de plaquettes de nanoparticules traitées par un solvant organique a été caractérisée par WAXS et TEM, démontrant l'intercalation des nanoparticules. Le spectre de relaxation, mesuré en rhéologie dynamique, démontre la présence d'une fraction amorphe à l'interphase polymère-particule. Cette fraction de chaînes amorphes rigides a été évaluée en utilisant un TMDSC et un DMA. Elle augmente avec le pourcentage de nanoparticules et atteint un maximum au moment où il y a agrégation des nanoparticules. La fraction amorphe rigide, telle que mesurée par FR-IR, augmente avec un réarrangement moléculaire suite à un recuit. La cristallisation à froid a été étudiée lors d'essai non isotherme par TMDSC. Les paramètres de l'équation cinétique de cristallisation d’Avrami ont été évalués lors d'essai isotherme sur une plage de température de Tg+30°C à Tg+70°C. Les paramètres cinétiques évoluent en fonction du pourcentage de
nanoparticules qui influencent la fraction amorphe rigide et en fonction de la formation d'une structure interparticulaire. Néanmoins, les nanoparticules agissent comme agent nucléant à une température supérieure à la température de transition vitreuse qui permet le mouvement des chaînes amorphes. Un plus grand nombre d'agents nucléants a pour effet d'augmenter le volume de la fraction amorphe rigide de la structure semi-cristalline.
La variation dans le temps de la viscosité complexe à l'état fondu dénote une dégradation du PLA. La caractérisation par NMR a été utilisée pour évaluer l'effet des nanoparticules sur la dégradation de la matrice polymère. Il a été démontré que la dégradation augmentait avec le pourcentage de nanoparticules. Cependant, la stéréorégularité des chaînes de PLA demeure inchangée en présence de nanoparticules. Les propriétés mécaniques ont été mesurées à l'aide d'un tensiomètre Instron. La surface des échantillons obtenus par fracture a été étudiée par SEM et SAXS. Il a été démontré
la densité dans le cas de fissurations multiples.
L'évolution de la structure pendant un étirage à chaud, pour différentes déformations et températures (Tg+10°C et Tg+30°C), a été étudiée hors-ligne par WAXS et SAXS. Il a été constaté
qu'une phase mésomorphique s'est développée, dans la direction de l'étirement à TG + 10C, principalement composé de chaînes parallèles à l'étirement avec une densité inférieure à celle des domaines cristallins. Le changement de structure de la mésophase, à la température de fusion, peut servir d'initiateur à un réarrangement de la phase cristalline.
Une fraction plus faible dans l'organisation moléculaire intermédiaire a été détectée en présence de nanoparticules que pour le polymère pur, et ce, aux mêmes conditions d'opération. Le glissement des mésophases est responsable du durcissement sous tension pendant la déformation en étirement à la température de la pièce. Il en résulte une augmentation de la ténacité et de la contrainte à la rupture du film. Une structure cristalline sphérulitique s'est développée à partir de points de nucléation durant le procédé d'étirement à une température de TG + 30C. Aucune mésophase n'a été détectée à cette température en raison de la relaxation des chaînes de polymère. Pour des taux de déformation élevés, on a observé une cristallisation sous forme de fibrille due à une nucléation sous forme de points continus.
Le flux d'oxygène dans le film a été mesuré à température et humidité relative constantes. Le coefficient de perméabilité a permis d'évaluer la diffusivité et la solubilité à partir du flux en régime transitoire et de la deuxième loi de Fick. Théoriquement, la diffusivité diminue en présence d'un matériau imperméable, de domaines cristallins et de plaquettes de nanoparticules. De plus, la présence de régions amorphes rigides diminue la fraction de volume libre dynamique. La solubilité, quant à elle, augmente avec le pourcentage de nanoparticules dû à une augmentation de la dégradation. La formation d'agrégat de nanoparticules est aussi responsable d'une augmentation du volume libre statique.
La structure moléculaire de l'agent durcissant a été évaluée en utilisant les techniques NMR et FT-IR et a été identifiée comme étant un copolymère éthylène butyle acrylate (ÉBAC) avec un ratio de 10:1. Le mélange PLA/ÉBAC est immiscible et une morphologie à deux phases a été observée au SEM. Une troisième transition vitreuse a été observée par DMA correspondant au développement d'un terpolymère PLA-EBAC à l'interface suite à une réaction de transestérification. L'augmentation de la viscosité à cisaillement nulle est attribuable à la formation
de nanoparticules qui se retrouvent dans la phase de PLA et qui est responsable de l'augmentation de la ténacité.
The application of biodegradable polymers has been offered to the packing industry wishing to overcome the environmental consequence of employing the petroleum-based polymers. Furthermore, the unstable oil market urged the industry to look for the substitution of the renewable resources. Polylactide is known as the most popular biodegradable polymer developed on a large scale. Nevertheless, the growing contribution of polylactide to packing industry is somewhat restricted owing to its inherent brittleness and weak barrier properties. Therefore, the main objective of this thesis was defined to build a fundamental relationship between processing parameters and solid-state microstructure to improve the performance of polylactide.
Polylactide nanocomposites were prepared through a multi-step melt compounding process. Dispersion of organically modified layered nanoparticles was detected by the WAXS and TEM characterizations, demonstrating the formation of intercalated nanocomposites. Relaxation spectrum exhibited the restricted dynamics of fraction of amorphous phase confined in polymer-particle interphase through dynamic rheological measurements. The fraction of rigid amorphous chains was estimated using TMDSC and DMA. This increased with nanoparticle content, levelling off upon the aggregation of nanoparticles. The annealing-induced molecular ordering was detected by FR-IR, increasing the rigid amorphous fraction. Cold crystallization was investigated during non-isothermal process using TMDSC. Crystallization kinetic was studied through the evaluation of Avrami parameters in isothermal process at the temperature range of Tg+30°C to Tg+70°C. The
crystallization rate depressed with the nanoparticle content due to the enhanced fraction of rigid amorphous chains, as well as, the topological constraints derived from the formation of network structure. Nevertheless, the nanoparticles acted as heterogeneous nucleating sites upon devitrification of the rigid amorphous chains at the temperatures above Tg+60°C. The larger
nucleation density resulted in the formation of larger rigid amorphous fraction along the semi-crystalline matrix. The variation of complex viscosity at molten state reflected the degradation of polylactide. The NMR characterization was conducted to investigate the effect of dispersed nanoparticle on the degradation of matrix. It was found that the degradation was accelerated with the nanoparticle content. However, the stereoregularity of polylactide chains remained unchanged in the presence of nanoparticles. Mechanical response was measured using Instron mechanical tester. The fractured surface was analyzed by SEM and SAXS. It was found that, toughness improved with the nanoparticle content due to enhanced occupation density upon multiple crazing.
and the temperatures of Tg+10°C and Tg+30°C, using WAXS and SAXS offline measurements. A
mesomorphic phase was developed along the drawing direction, at Tg+10°C, composed of a bundle
of parallel extended molecules with a looser lateral chain packing compared to that of the crystalline domain. The mesophase was disordered at the glass transition temperature of the bulk-like chains acting as the precursor of crystalline ordering. A lower fraction of the intermediate ordering was detected with nanoparticle content than that of the neat polymer at constant processing conditions. The slippage of frozen-in mesophase triggered strain hardening behavior during the stretching process at room temperature. This led to the significant improvement of film toughness and stress at break. Spherulitic crystalline domains were formed upon development of point-like nuclei during the drawing process at Tg+30°C. No mesophase was detected at Tg+30°C, due to the
enhanced contribution of chain relaxation. Line-like nuclei were observed at the highest applied strain rate, resulting in the formation of a fibrillar crystalline structure. Oxygen flux density was measured at constant temperature and relative humidity. Permeability coefficient was distinguished to the diffusivity and solubility, through the analysis of the non-steady state flux density with time by an approximate solution of the Fick’s second law. The diffusivity decreased in the presence of the impermeable matters, crystalline domains and nanoparticle layers. Furthermore, the restricted dynamics of rigid amorphous fraction decreased the fraction of dynamic free volumes. Solubility increased with the nanoparticle content due to the accelerated degradation. The aggregation of nanoparticles also intensified the accessible static free volume.
The chain architecture of toughening modifier was disclosed using NMR and FT-IR. It was believed to be Ethylene-Butyl Acrylate copolymer with the average sequence length of 10:1. A two-phase morphology was detected by SEM for polylactide/toughening modifier immiscible blend. DMA measurements exhibited a third glass transition, corresponding to development of polylactide-ethylene-butyl acrylate terpolymer at the interface through a transesterification reaction. The enhancement of zero shear viscosity of blends attributed to the Marangoni stresses derived from the uneven distribution of in-situ formed terpolymer at the interface. An intermeshed morphology was observed upon the incorporation of the nanoparticles. The nanoparticles were accommodated within the polylactide phase determined by the calculation of wetting parameter. The morphology connectivity led to the outstanding improvement of toughness.
DEDICATION ... III ACKNOWLEDGEMENTS ... IV RÉSUMÉ ... V ABSTRACT ... VIII TABLE OF CONTENTS ... X
LIST OF TABLES ... XVI
LIST OF FIGURES ... XVII
CHAPTER 1 INTRODUCTION ... 1
CHAPTER 2 LITERATURE REVIEW ... 5
2.1 Polylactide structure ... 5
2.1.1 Molecular architecture ... 5
2.1.2 Stereosequence distribution of chains ... 6
2.1.3 Degradation of polylactide ... 7
2.2 Crystallization of polylactide ... 10
2.2.1 Crystalline structure of polylactide ... 10
2.2.2 Multi-step crystallization process ... 12
2.2.3 Crystalline phase transition ... 12
2.2.4 Aging-induced molecular ordering ... 17
2.2.5 Rigid amorphous fraction ... 19
2.2.6 Multiple melting endotherms ... 23
2.2.7 Kinetic of crystallization process ... 23
2.3 Polymer nanocomposites ... 31
2.3.1 Structure of Smectic clay ... 31
2.3.2 Dispersion nanoparticles ... 31
2.3.3 Development of the interphase ... 32
2.3.4 Effect of addition of nanoparticles on crystallization ... 32
2.4 Polymer Blends ... 36
2.4.1 Break-up process ... 37
2.4.2 Coalescence of dispersed phase ... 39
2.4.3 Compatibilization of immiscible blends ... 39
2.4.4 Phase morphology in the presence of nanoparticles ... 43
2.4.5 Thermodynamic and kinetic aspects of nanoparticles distribution ... 44
2.5 Failure mechanism of polymers ... 47
2.5.1 Effect of molecular characteristics on failure mechanism ... 48
2.5.2 Effect of strain-induced structure on failure mechanism ... 53
2.5.3 Effect of crystallization on failure mechanism ... 54
2.5.4 Necking ... 55
2.6 Toughening mechanisms ... 55
2.6.1 Effect of phase morphology ... 55
2.6.2 Effect of interfacial adhesion ... 58
2.6.3 Viscoelastic nature of the phases ... 58
2.6.4 Effect of addition of nanoparticle on matrix toughness ... 60
2.7 Barrier properties and molecular structure ... 60
CHAPTER 3 METHODOLOGY ... 67 3.1 Materials ... 68 3.1.1 Masterbatch ... 70 3.1.2 Hybrids preparation ... 71 3.1.3 Film preparation ... 71 3.1.4 Hot-drawn Films ... 71 3.2 Characterizations ... 72
3.2.1 Size Exclusion Chromatography, SEC ... 72
3.2.2 Density Measurements ... 72
3.2.3 Contact Angle ... 73
3.2.4 Nuclear Magnetic Resonance Spectroscopy, NMR ... 74
3.2.5 Fourier Transform Infrared Spectroscopy, FT-IR ... 74
3.2.6 Scanning Electron Microscopy, SEM ... 74
3.2.7 Transmission Electron Microscopy, TEM ... 75
3.2.8 Small Angle X-ray Scattering, SAXS ... 75
3.2.9 Wide Angle X-ray Diffraction, WAXS ... 75
3.2.10 Thermal Analysis ... 76
3.2.11 Rheology ... 77
3.2.12 Tensile ... 77
3.2.13 Barrier Properties ... 78
CHAPTER 4 ORGANIZATION OF ARTICLES ... 79
CHAPTER 5 ARTICLE 1: ROLE OF CHAIN DYNAMICS AND TOPOLOGICAL CONFINEMENTS IN COLD CRYSTALLIZATION OF PLA-CLAY NANOCOMPOSITES . 81 5.1 Introduction ... 82
5.2.1 Materials ... 85
5.2.2 Nanocomposite Preparation ... 85
5.2.3 WAXS ... 86
5.2.4 Rheology ... 86
5.2.5 Thermal Analysis ... 86
5.2.6 Fourier Transform Infrared Spectroscopy (FTIR) ... 88
5.2.7 SAXS ... 88
5.3 Results and discussions ... 89
5.4 Conclusions ... 106
5.5 Appendix ... 108
CHAPTER 6 ARTICLE 2: EFFECT OF STRAIN INDUCED MOLECULAR ORDERING ON MECHANICAL PERFORMANCE AND BARRIER PROPERTIES OF POLYLACTIDE NANOCOMPOSITES ... 111
6.1 Introduction ... 113
6.2 Experimental ... 116
6.2.1 Materials ... 116
6.2.2 Sample Preparation ... 116
6.2.3 Hot-drawing and measurement of mechanical properties ... 117
6.2.4 SAXS ... 117 6.2.5 WAXS ... 118 6.2.6 DSC ... 118 6.2.7 Dynamic mechanical ... 119 6.2.8 TEM ... 119 6.2.9 Rheology ... 119
6.2.11 Density Measurements ... 120
6.3 Result and discussion ... 121
6.4 Conclusion ... 146
CHAPTER 7 ARTICLE 3: TOUGHENING OF POLYLACTIDE NANOCOMPOSITES WITH AN ETHYLENE ALKYL ACRYLATE COPOLYMER: EFFECTS OF THE ADDITION OF NANOPARTICLES ON PHASE MORPHOLOGY AND FRACTURE MECHANISM ... 149
7.1 Introduction ... 151 7.2 Experimental ... 154 7.2.1 Materials ... 154 7.2.2 Sample Preparation ... 154 7.2.3 WAXS ... 155 7.2.4 NMR Spectroscopy ... 155
7.2.5 Fourier Transform Infrared Spectroscopy (FTIR) ... 155
7.2.6 SEM ... 155 7.2.7 Contact Angle ... 156 7.2.8 Rheology ... 156 7.2.9 Thermal Analysis ... 156 7.2.10 Tensile ... 157 7.2.11 SAXS ... 157
7.3 Results and discussion ... 157
7.4 Conclusion ... 188
CHAPTER 8 GENERAL DISCUSSION ... 191
CHAPTER 9 CONCLUSION AND RECOMMENDATIONS ... 203
BIBLIOGRAPHY ... 210
Table 2-1. Polymer/Rubber Blends with Brittle Matrices [104]. ... 57
Table 5-1 thickness of the crystalline lamellae(lc) and the amorphous layer (la), calculated based
on the correlation function. ... 105
Table 6-1. Density, fractional free volume, permeability, diffusivity and solubility of the hot-drawn PLA(FS2)TdRx films at 23°C and RH=0%. ... 134
Table 6-2. Herman’s orientation function of the hot-drawn PLAAi(FS2)TdRx films. ... 140
Table 6-3. Permeability, diffusivity and solubility of the hot-drawn PLAA1.2(FS2)TdRx films at
23°C and RH=0% ... 144
Table 6-4. Permeability, diffusivity and solubility of the hot-drawn PLAA3.6(FS2)TdRx films at
23°C and RH=0% ... 145
Table 7-1. Detected peaks in 1HNMR and 13CNMR spectra of Biomax Strong. ... 164
Table 7-2. The volume fraction of the rubber phase, the average particle size, the surface density of the dispersed particles, and the average matrix ligament length, of samples. ... 166
Table 7-3. Surface tension, dispersive and polar component of the constituents. ... 169
Table 7-4. Zero-shear viscosity and complex viscosity at a high frequency, as well as, viscosity ratio. ... 173
Table 7-5. Plateau modulus, molecular weight of the entanglement strands, and the entanglement density. ... 178
Table 7-6. Variation of the forward intensity at the yielding point, calculated by the Guinier approximation. ... 180
Table 7-7. Variation of the forward intensity at the breaking point, calculated by the Guinier approximation. ... 181
Figure 2-1. L-lactide, D-lactide, and meso-lactide configuration [2]. ... 5
Figure 2-2. 1H and 13C solution NMR spectra of PLA synthesized using 5% L-lactide and 95% D-lactide [2]. ... 6
Figure 2-3. Enolization in lactate unit [8]. ... 8
Figure 2-4. Meso-lactide formation by the SN2 reaction on asymmetrical methine carbon [8]. ... 9
Figure 2-5. Intramolecular backbiting intrachain reaction [7]. ... 9
Figure 2-6. Complex viscosity at 200°C (a) and DSC thermogram of PLLA during cooling from 200°C (b) compounded by various concentrations of PDLA during cooling from 200°C[19]. ... 11
Figure 2-7. Projections perpendicular to the helical axis of a 103 helical conformation (a) and 31 helical conformation (b) [24]. ... 13
Figure 2-8. Sequential ordering at atomic scale during cold crystallization of PLLA [22]. ... 13
Figure 2-9. Overall crystallization rate as a function of crystallization temperature [14]. ... 14
Figure 2-10. Relationship between the reciprocal long period and the crystalllization temperature[14]. ... 16
Figure 2-11. DSC thermogram of PLLA annealed at different temperatures [13] (a) Variation of invariant upon heating [14] (b) ... 17
Figure 2-12. Lattice spacing of High and low molecular weight PLLA, estimated from the (110)/(200) after annealing at different temperatures for 360 min [30]. ... 18
Figure 2-13. Cold crystallization temperature (a) and crystallization half-life (b) as a function of annealing time at different temperature [34]. ... 20
Figure 2-14. DSC thermogram obtained after an aging period at 45°C for 42 h (solid-line) and the subsequent second heating (a) [40], DMA of PLLA isothermally conditioned at 50°C for different times (b) [37]. ... 21
Figure 2-15. MAF and RAF of PET as function of the crystallinity, formed during cold-crystallization at 117°C [36]. ... 22
strain of 360% [47] ... 25
Figure 2-17. True stress-true strain curves of PLA films at various draw temperatures beyond the glass transition temperature [47]. ... 26
Figure 2-18. Mesophase content as a function of strain for the drawing of PDLLA at Td = 65°C (a)
[12], elongational viscosity as a function of time at the strain rate of 0.1 s-1 (b) [49]. ... 28
Figure 2-19. Shish-kebab structures with twisted (a) and untwisted (b) lamellae, according to Keller and Machin [53]. ... 30
Figure 2-20. Schematic representation of coexistence of shish-kebab and spherulitic like crystals along the thickness of the mold [58]. ... 30
Figure 2-21. Schematic illustration of spherulite growth when nanoparticles acted as heterogeneous nucleating sites [77] ... 33
Figure 2-22. Schematic illustration of the physical jamming of nanoparticles and formation of spatially interconnected network [84]. ... 35
Figure 2-23. Variation of crystallization half-life (a) and Avrami exponent as a function of single-wall (SWNT), double-single-wall (DWNT), and multi-single-wall (MWNT) nanotube concentration at the crystallization of HDPE [74] ... 35
Figure 2-24. Accommodation of nanoparticles into the growing crystalline domains [77]. ... 36
Figure 2-25. Effect of clay nanoparticle content on crystallization half-life (a) and Avrami exponent (b) as a function of for nanocomposites based on low, medium and high molecular weight nylon 6 [68]. ... 36
Figure 2-26. Critical Capillary number as a function of viscosity ratio in shear and extensional flow field [91] ... 38
Figure 2-27. Effects of compatibilizer on drop deformation in extensional flow (left) in shear flow (right) [87] ... 42
Figure 2-28. The development of in-situ formed graft at the interface of phase A and phase B [97]. ... 45
enhanced viscosity and altered the breakage and coalescence process (b) [97]. ... 47
Figure 2-30. Schematic illustration of the crazed region [106]. ... 48
Figure 2-31. Craze surface profile computed from the measured opening displacements using the Fourier transform method [108]. ... 51
Figure 2-32. New surfaces appear under stress (a), chain segments elongate (b), maximum elongation (c), and chain scission or pull-out (d) [16]. ... 53
Figure 2-33. Schematics illustration of surface-to-surface interparticle distance and center-to-center interparticle distance L [105]. ... 57
Figure 2-34. Schematic illustration of continuum percolation of stress volume upon the increase of the dispersed phase concentration from (a) to (d) [105]. ... 59
Figure 2-35. Lattice model for oxygen transport (left) diffusional channels between static free-volume holes (b) [128]. ... 61
Figure 2-36. Relationship between specific volume of PET and T-Tg, constructed for amorphous
PET with the oxygen [128]. ... 62
Figure 2-37. More tortuous pathway as the unit vector normal to the layered nanoparticles is parallel to the diffusion direction [129]. ... 64
Figure 3-1. Molecular structure of dimethyl dehydrogenated tallow quaternary ammonium. ... 68
Figure 3-2. The experimental roadmap. Sample Preparation ... 69
Figure 5-1. WAXS pattern of the organically modified nanoparticle (Cloisite 15A) and the nanocomposites (PLAAi) with different nanoparticle loading. The broken line represents the peak position of Cloisite 15A and the broken-dot line shows the diffraction peak related to PLAA1.2(Q). ... 89
Figure 5-2. Storage modulus as a function of frequency in the linear viscoelastic region (a). Relaxation spectrum (b). ... 90
underlying heating rate of 3°C/min, modulation amplitude 0.7°C, and modulation period 60s. The dash-line represents the Tcc of PLA(Q) ... 91
Figure 5-4. FT-IR spectrum of the samples annealed for 1h at 70°C. ... 93
Figure 5-5. Variation of the cold crystallization temperature (Tcc) of the samples with different
particle contents and at heating rates, of 10°C/min by Standard DSC and 3°C/min by TMDSC with a modulation amplitude of 0.7°C and modulation period of 60s. ... 95
Figure 5-6. Elastic modulus variation of the quenched nanocomposites (PLAAi(Q)) and the samples annealed for 1 hr at 70°C (PLAAi(Q1h)70). E0 is the elastic modulus of PLA(Q) at
70°C. ... 96
Figure 5-7. Heat evolution (a),(c) and development of crystallinity (b),(d) of the annealed samples at different temperatures. ... 97
Figure 5-8. Development of crystallinity of PLA(Q1h)Ta (a) and PLAA1.2(Q1h)Ta (b). ... 98
Figure 5-9. Overall crystallization rate of the samples as a function of annealing temperature. It is assumed that the overall crystallization growth rate is proportional to (1/t1/2) in cold
crystallization. ... 99
Figure 5-10. Degree of crystallinity as a function of nanoparticle content, at different annealing temperatures, calculated using Equation 5-1 ... 100
Figure 5-11. Loss factor variations of PLAAi(Q) (a), PLAAi(Q1h)70 (b), PLAAi(Q1h)110 (c), PLAAi(Q1h)130 (d). ... 101
Figure 5-12. Rigid amorphous fraction (RAF) as a function of nanoparticle content, calculated from DSC (a) and DMA (b) data. ... 102
Figure 5-13. The correlation function, as a function of correlation distance for the samples annealed at 110oC (a) and 130oC (b). ... 105
Figure 5-14. Avrami analysis for the primary crystallization of PLA(Q1h)90, n= 2.27, Xp=0.97,
and (a) secondary crystallization of PLA(Q1h)90, n= 0.7, Xs=0.03 (b). ... 108
Figure 5-15. Avrami analysis for the primary crystallization of PLA(Q1h)100, n= 2.51, Xp=0.92,
(a) and secondary crystallization of PLA(Q1h)110, n= 0.76, Xs=0.15 (b). ... 109
Figure 5-17. Avrami analysis for the primary crystallization of PLA(Q1h)120, n= 2.07, Xp=0.89,
(a) and secondary crystallization of PLA(Q1h)120, n= 0.53, Xs=0.11 (b). ... 109
Figure 5-18. Avrami analysis for the primary crystallization of PLA(Q1h)130, n= 2.07, Xp=0.93,
(a) and secondary crystallization of PLA(Q1h)130, n= 0.53, Xs=0.07 (b). ... 110
Figure 6-1. The 2’D SAXS integrated azimuthal distribution of the hot-drawn PLA(FS2)TdRx
films. ... 121
Figure 6-2. The WAXS diffraction pattern of the hot-drawn PLA(FS2)TdRx films at the azimuthal
angle of 0°. ... 122
Figure 6-3. Total heat capacity by DSC at a heating rate of 10°C/min (a) Temperature modulated DSC at a heating rate of 3°C/min, total heat capacity (b), reversing component (c), and non-reversing component (d) of PLA(FS2)TdRx. The dash-line represents Tg and Tcc, the dot
relates to melting point. ... 123
Figure 6-4. The SAXS integrated azimuthal distribution of PLA(FS2)70R20 for the scattering peak related to the 110 plane at 2θ =15°±1,, re-heated to 110°C crystallized. The inset represents its 2’D SAXS pattern. ... 126
Figure 6-5. Elastic modulus (a) and Loss factor (b) of the hot-drawn PLA(FS2)TdRx films. ... 128
Figure 6-6. Variation of Young’s modulus (a), yield stress (b), elongation at break (c), and toughness (d) of the hot-drawn PLA(FS2)TdRx films. ... 130
Figure 6-7. Stress-strain curve of PLA(FS2)70R20 at room temperature (on the left axis), and variation of fraction of mesophase at the azimuthal angle of 0°(on the right axis). ... 131
Figure 6-8. Experimental time-dependant oxygen flux of PLA(F). The inset reveals express the ... 132
Figure 6-9. Relationship between solubility and molar volume of the hot-drawn PLA(FS2)TdRx.
... 134
Figure 6-10. Storage and loss moduli as a function of frequency in the linear viscoelastic region (a), and Relaxation spectrum (b). ... 136
Figure 6-12. The 2’D SAXS integrated azimuthal distribution of the hot-drawn PLAA1.2(FS2)TdRx films (a), and PLAA3.6(FS2)TdRx films (b). ... 138
Figure 6-13. The WAXS diffraction pattern of the hot-drawn PLA(FS2)TdRx films (a), and
PLAA3.6(FS2)TdRx (b), at the azimuthal angle of 0°. ... 139
Figure 6-14. Total heat capacity by DSC at a heating rate of 10°C/min (a) Temperature modulated DSC at a heating rate of 3°C/min, total heat capacity (b), reversing component (c), and non-reversing component (d) of PLAA1.2(FS2)TdRx. The dash-line represents Tg and Tcc, the dot
relates to melting point. ... 141
Figure 6-15. Total heat capacity by DSC at a heating rate of 10°C/min (a) Temperature modulated DSC at a heating rate of 3°C/min, total heat capacity (b), reversing component (c), and non-reversing component (d) of PLAA1.2(FS2)TdRx. The dash-line represents Tg and Tcc, the dot
relates to melting point. ... 142
Figure 6-16. Variation of Young’s modulus (a), yield stress (b), elongation at break (c), and toughness (d) of the hot-drawn PLAAi(FS2)TdRx films. ... 144
Figure 7-1 WAXS patterns of the organically modified nanoparticle (Cloisite 15A) and the nanocomposites (PLAAi), with different nanoparticle loading. The broken line represents the peak position of Cloisite 15A. ... 159
Figure 7-2. 1HNMR spectra of Polylactide (4043D) pellet (a), PLA (b), and PLAA1.2 (c), PLAA3.6
(d) CDCl3, 700 MHz. ... 161
Figure 7-3. 13CNMR spectra of PLA(a), PLAA1.2(b), and PLAA3.6(c) CDCl
3, 176 MHz. ... 163
Figure 7-4. FT-IR spectra of Biomax Strong. ... 165
Figure 7-5. SEM micrograph of (a) PLAEA5, (b) PLAEA10, (c) PLAA1.2EA5 and (d) PLAA3.6EA5. ... 167
Figure 7-6. WAXS patterns of the hybrids (PLAAiEAj) ... 168
Figure 7-7. Complex viscosity of the hybrids (PLAAiEAj) as a function of time, within the linear viscoelastic region, at 190°C. ... 170
linear viscoelastic region at 190°C. ... 172
Figure 7-9. Variation of the heat capacity as a function of temperature of the hybrids (PLAAiEAj), at a heating rate of 3°C/min... 174
Figure 7-10. Loss factor of the hybrids, PLAAiEAj, over the high temperature range, 20 to 100°C (a), and the low temperature range, -60 to 20°C (b). ... 176
Figure 7-11. Variation of Young’s modulus (a), and yield strength (b), for the hybrids. ... 177
Figure 7-12. 2’D scattering patterns at the yielding point for PLAA1.2 (a), PLAA3.6 (b), PLAEA5 (c), PLAEA10 (d), PLAA1.2EA5 (e), PLAA3.6EA5 (f) ... 179
Figure 7-13. the integrated azimuthal distribution of the hybrids at the yielding point. ... 181
Figure 7-14. Variation of the elongation at break (a), and toughness (b), of the hybrids ... 182
Figure 7-15. Micrographs of fractured surfaces of PLAA (a,b), PLAA1.2(c,d), and PLAA3.6 (e,f). ... 184
Figure 7-16. Micrographs of fractured surfaces of PLAEA5 (a), PLAEA10 (b), PLAA1.2EA5(c,d), and PLAA3.6EA5 (e,f) ... 186
CHAPTER 1
INTRODUCTION
Polylactide is known as a popular biopolymer produced from renewable sources. This biodegradable polymer revealed promising physical and mechanical performances compared to conventional petroleum-based polymers, recently turning into an inevitable material in the packaging industry. Nevertheless, the inherent brittleness and weak barrier properties of polylactide have somewhat restricted its growing application among packaging materials, in spite of its superior properties compared to other biodegradable polymers. Then, the improvement of physical and mechanical properties is of great interest to academia and industry. Numerous methods have been offered to overcome the major drawbacks of polylactide.
Crazing and shear yielding are two major competing mechanisms of polymer failure. Basically, the easier process occurs first. A brittle fracture takes place upon yielding in the absence of plastic deformation. It has been believed that, the high rigidity of polylactide molecules is responsible for the relatively high permeability and the brittleness of polylactide. Copolymerization has been proposed to prevail the stiffness of the polylactide backbone through altering the chain architecture. However, this method has not been proven cost-competitive on a large industrial scale.
Self-reinforcement was applied through hot-drawing of polylactide films. This method significantly reinforced the physical and the mechanical properties depending on the stretching process parameters. Nevertheless, the barrier properties might be deteriorated upon development of micron-sized voids during the drawing below glass transition temperature of polylactide. Melt blending with a flexible polymer has been found to be an efficient alternative to toughen polylactide. The low thermal resistance of polylactide also restricted the processing conditions in the course of melt compounding. The degradation mechanisms of polylactide were widely scrutinized within the past decades. The degradation can affect the properties through increasing the population of the low molecular weight species, accompanied by changing the stereoregularity of skeletal units of polylactide chains. The morphology of the blend is a crucial parameter, controlling the brittle-ductile transition of matrix. Furthermore, interfacial adhesion and viscoelastic properties of phases influence the mechanical response of the immiscible polymer blends. Several commercial toughening modifiers were developed on large scale. However, they are not necessarily biodegradable. Therefore, the lowest content of this non-biodegradable component is desired to preserve the biodegradability of hybrid.
Polymer nanocomposites have aroused a great deal of interest from academic and industrial standpoints over the past decades. The layered-silicate nanoparticles widely employed to prepare the polymer nanocomposites owing to their large aspect ratio, as well as, the high capacity for isomorphic substitution. The polymer-layered silicate nanocomposites revealed an outstanding improvement of barrier and mechanical properties, in spite of low filler content, compared to conventional composites. Furthermore, the crystallization of polymeric host has been influenced upon the incorporation of the inorganic nanoparticles. The kinetics of crystallization can be either significantly enhanced or dramatically retarded in the presence of nanoparticles. It has been demonstrated that, the physical and mechanical properties undergo the microstructure of crystalline domains in semi-crystalline polymers.
On the other hand, permeability was employed to study the structural features, molecular interaction, and conformational rearrangement. Therefore, the kinetic and the thermodynamic aspect of the permeability were independently investigated to find out, the influence of morphological parameters and topological constraints on the solubility and the diffusivity of permeant through the thin films.
The main objective of this thesis was defined to build a fundamental relationship between processing parameters and solid state microstructure to control the performance of polylactide. Several alternatives were addressed in order to acquire the main goal, such as the addition of layered-silicate nanoparticles, self-reinforcement through hot-drawing process, melt blending with a commercial toughening modifier. The resultant performance was investigated to evaluate the efficiency of the methods individually. Subsequently, the alternatives were effectively combined to achieve the desire physical and mechanical properties.
It was tried in chapter 2, to collect a comprehensive literature review on any subject, which one might run across within the next chapters, consists of molecular architecture and stereoregularity of polylactide chains, degradation mechanism of polylactide, multi-step crystallization of polylactide, kinetic of crystallization process, crystalline phase structure, rigid amorphous fraction, annealing-induced molecular ordering, strain-induced molecular ordering, strain-induced crystallinty, polymer nanocomposites, effect of nanoparticles on crystallization process, polymer blends, distribution of the nanoparticles in polymer blends, phase morphology in the presence of nanoparticles, failure mechanism of polymers, effects of molecular features, strain-induced
morphology, interfacial adhesion, and nanoparticle on matrix toughness, and at last the relationship between barrier properties and molecular structure of polymers.
The materials, the characterization methods, and the experimental roadmap were elaborated in chapter 3. The organization of the articles was summarized in chapter 4.
In chapter 5, the chain dynamics were measured using Rheological measurements, DSC, and DMA. For that purpose, an annealing process, accompanied by a subsequent reheating was carried out to ascertain the influence of the addition of organically modified nanoparticles on chain dynamics, and consequently crystallization parameters. An effort was made to illustrate a relationship between devitrification of the rigid amorphous fraction and crystallization kinetics. Moreover, periodicity of the crystalline and amorphous layers was related to the development of rigid amorphous molecules and internal structure of the crystalline domains.
In chapter 6, the structural evolutions were investigated within the hot-drawing of the nanocomposites by WAXS and SAXS analysis. The contributions of intrinsic and extrinsic parameters to microstructure were discussed. Furthermore, the effect of the addition of the nanoparticles, on the strain-induced molecular ordering was unfolded. The molecular ordering strongly influenced the mechanical and barrier properties of the hot-drawn films. Furthermore, the crystalline phase morphology undergoes the stretching parameters. The basic components of permeability were used as a structural probe discerning it to dig into structural features and chain dynamics. The development of intermediate phase found to affect the accessible static and dynamic free volumes.
In chapter 7, a commercial toughening modifier, Biomax Strong, was applied to toughen polylactide. Sufficient information on its molecular structure and functionality were not available. Therefore, the molecular structure and the chain architecture of Biomax Strong were revealed. The toughening mechanisms were investigated to find out how the addition of Biomax Strong may alter the balance. The effect of the addition of organically modified nanoparticles was detected on the morphology of the immiscible polymer blend. The matrix degradation was conducted to turn in a constructive parameter through a transesterification reaction at the interface. This reflected in the phase morphology, the melt rheology, and the mechanical response of the hybrid. Eventually, an attempt was carried out to represent a relationship between the matrix characteristics, resultant morphology of the hybrids, and the failure mechanisms.
established though the experiments. The major conclusions of this work are summarized in chapter 9 and a number of recommendations are addressed for the future works on this broad objective.
CHAPTER 2
LITERATURE REVIEW
2.1 Polylactide structure
2.1.1 Molecular architecture
Generally, at a large scale, Polylactide is produced by anionic ring opening polymerization of lactide, a cyclic dimer of lactic acid [1]. The statistical skeletal units of PDLLA exhibit two different spatial organizations of atoms, R and S, around the asymmetric methine carbon, known as the stereocenter. Therefore, lactide has three potential configurational stereoisomers, corresponding to the two chiral centers in the cyclic compound. These potential configurations consist of RR, SS, and RS stereoisomers, respectively, referred to as D-lactide, L-lactide, and meso-lactide, in Figure 2-1. D-lactide and L-lactide are non-superimposable mirror images of each other’s, in Figure 2-1 [2]. The pair of enantiomers is optically active molecule. The dextrorotatory molecule rotates the plane of polarized light to the right, while the levorotatory molecule turns it to the left. The polarized light is not digressed by meso-lactide compound, as this is optically inactive. Thus, stereosequence distribution of the enantiomers along polylactide chain architecture severely influences physical and chemical properties in chiral environments [3].
2.1.2 Stereosequence distribution of chains
Nuclear magnetic resonance provides a map regarding the number of distinct types of hydrogen, in 1HNMR, or carbon-13, in 13CNMR, based on the valence-shell electron density, surrounding
the nuclei and the electronegativity of the immediate neighbors. The enantiomers are not spatially equivalent [4, 5].
Therefore, stereosequence distribution of the polylactide skeletal units can be detected by 1HNMR
and 13CNMR spectroscopy. The stereoregularity influences the frequency, which the methine 1hydrogen and 13carbon nuclei manifest their resonances due to the variation of the electron
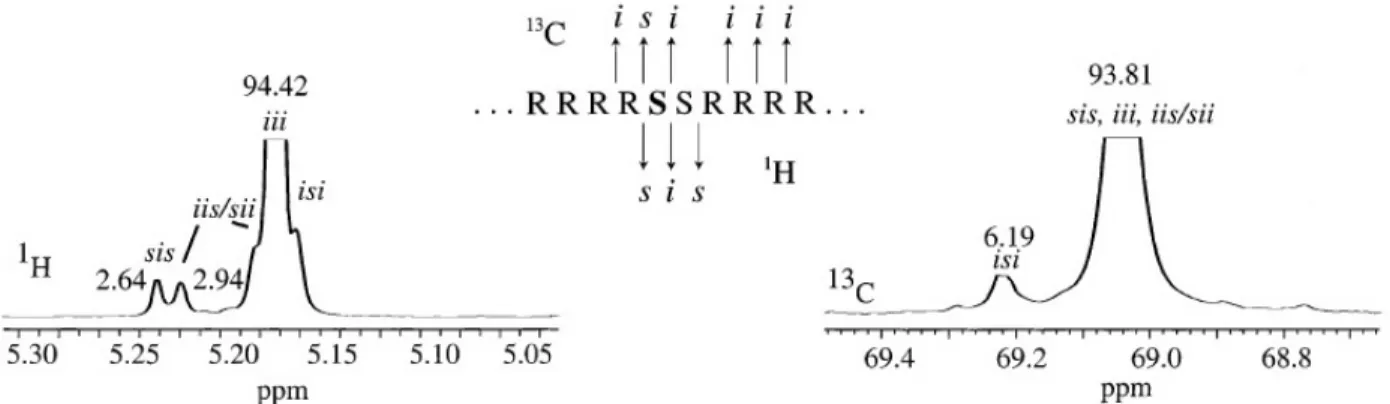
density, arising from the steric interactions [2, 6]. Therefore, methine shows different resonance frequencies, depending on the stereosequence distribution. Figure 2-2 reveals the 1HNMR and 13CNMR spectra of a polylactide composed of 5% L-isomer and 95% D-isomer. The chemical
shifts addressed in Figure 2-2, are assigned to the tetrad stereosequence distributions along chains. The most pronounced peaks are distinguished at 5.18 ppm in 1HNMR, and at 69.04 ppm in 13CNMR, corresponding to the “iii” stereorelationship of chiral centers. This stems from the large
region of isotacticity along the chain due to the predominant contribution of the D-isomer (95%) in the chain architecture. The integrated area underneath the peaks has been related to the population of tetrad stereosequence distributions using statistical probabilities.
Figure 2-2. 1H and 13C solution NMR spectra of PLA synthesized using 5% L-lactide and 95%
2.1.3 Degradation of polylactide
Low thermal resistance creates several restrictions on melt processing of PLA. It is well known that, aliphatic esters can be easily degraded. The degradation mechanisms of PLA have been widely scrutinized within the past decades [7-9]. It has been reported that, the major mechanisms of PLA degradation include transesterifications, backbiting and unzipping depolymerization, selective lactide elimination, and SN2 reaction on asymmetrical methine carbon. The predominant
mechanism can be predicted depending on processing conditions, chain-end terminating agent, molecular weight, and residual elements. These reactions cause a lower molecular weight and a broader molecular weight distribution, resulting in a drastic deterioration of the physical and mechanical properties.
The ring opening polymerization of lactide is initiated by a nucleophilic reagent, most often an organometals such as, Tin(II) Octoate [1]. Subsequently, the polymerization propagates through the attack of negatively charged nucleophilic chain-end to the carbonyl carbon of lactide. The nucleophilic character of the chain-ends can trigger several side reactions during polymerization and melt processing.
The hydrolysis of an ester skeletal unit can be carried out in either an acidic or a basic aqueous medium. In the aqueous acid, the acid plays the catalyst role, while in the aqueous base a stoichiometric amount of the base is required. Therefore, in the hydrolysis of esters in aqueous base, referred to as saponification reaction, the efficiency of hydrolysis depends on the concentration of the base as a reactant. It is noteworthy that, hydrolysis in the aqueous acid is a reversible reaction, unlike the one in the aqueous base which is irreversible, due to the formation of relatively stable carboxylate anion during saponification.
The degradation mechanism of the organometallic-initiated Polylactide is strictly influenced by the temperature range of processing. Racemization is the predominant reaction within a temperature range below 250°C. According to this mechanism, the asymmetric methine carbon in the skeletal unit is attacked by a carboxylic anion at the chain-end through an intrachain SN2
from the organometals. An enolization of the ester unit occurs prior to the racemization reaction by the Walden’s inversion on the methine carbon, as revealed in Figure 2-3.
Following the formation of this contributing structure, delocalization of the carbonyl double bond causes the asymmetric methine carbon susceptible of the nucleophilic attack by the relatively stable carboxylic anion, Figure 2-4. This mechanism induces the bond session between the oxygen of the ester skeletal unit and the stereogenic center, accompanied by altering the configuration of the neighboring methine carbon, led to the formation of meso-lactide. Enolization is intensified with an increase of the temperature towards the upper band. Nevertheless, the possibility of the racemization reaction decreases thereby.
Figure 2-3. Enolization in lactate unit [8].
The unzipping depolymerization is the dominant mechanism at a higher temperature range (250<T<320°C), advancing through the attack of the nucleophilic alkoxide chain-end to the most electrophilic point of the skeletal unit, carbonyl carbon. This nucleophilic attack may proceed as either an interchain reaction, or a backbiting intrachain reaction, Figure 2-5. The transfer mechanism of the carboxylate chain-end to the alkoxide has not been quite elucidated yet. This degradation mechanism has no noticeable influence on the stereoregularity of the neighboring methine carbon. Therefore, no meso-lactide forms during the degradation at this temperature range. Surprisingly, as the processing temperature exceeds 320°C, the racemization mechanism is activated once more. However, it develops through a different mechanism.
Figure 2-4. Meso-lactide formation by the SN2 reaction on asymmetrical methine carbon [8].
A hydrolytic degradation occurs at room temperature over a long period (several weeks) [10]. It has been shown that, the bulk species predominantly undergo the hydrolytic degradation than the species on surface. The rate of degradation is proportional to the concentration of water in the bulk. Therefore, the enhancement of Polylactide crystallinity decreases the degradation rate due to impermeability of the crystalline domain.
Dispersion of layered-silicate nanoparticles might decrease the diffusivity of moisture throughout the bulk. However, the addition of nanoparticles can enhance the hydrophilic character of the matrix, depending on the surface characteristics and functionality of the nanoparticles. This enhanced hydrophilicity may increase the concentration of water in the bulk, accelerating the hydrolytic degradation at room temperature.
2.2 Crystallization of polylactide
2.2.1 Crystalline structure of polylactide
PLA crystallization has been extensively investigated over the past few years. Generally, crystallization of a polymer depends on molecular parameters and processing conditions. Processing conditions include crystallization temperature, heating/cooling rate, and applied stress. The crucial molecular parameters, which strongly influence the crystallization of polylactide, are molecular weight, molecular weight distribution, density of branching, length of branches, and stereoregularity. It has been demonstrated that, the highest relative crystallinity might be obtained as the chain architecture of polylactide comprises the least D-stereoisomer content. No crystallization takes place while the D-stereoisomer content exceeds 8% [11, 12].
Three major crystalline forms (α, β, and γ) have been reported for PLA [13-15]. α-form crystals consist of two parallel chains with 103 helical conformation packed into an orthorhombic unit cell.
This sort of crystals can be developed during melt, solution and cold crystallization of polylactide. Nonetheless, various morphologies of the crystalline domains have been observed corresponding to processing conditions. Typically, melt crystallization leads to the formation of relatively large and less defected spherulites, whereas, grain-like morphology is expected in cold crystallization process. It was simply attributed to the lower density of nuclei, and the higher growth rate during the melt crystallization, compared to those of the cold crystallization [16].
A frustrated crystalline structure is achieved through drawing of the α-form crystals at a high temperature and a very high stretching rate. This crystalline structure is referred to as β-form, including left-handed 31 helices packed into a trigonal unit cell. γ-form crystals are developed by
epitaxial crystallization on the surface of a crystalline substrate. This oriented crystalline phase is composed of anti-parallel 31 helices packed in an orthorhombic unit cell [17, 18].
Stereocomplex, SC, crystalline domains might be developed in 1:1 stoichiometric mixture of the polylactide enantiomers, PLLA and PDLA, along with the individually formed homopolymer crystal of PLLA [19-21]. This crystalline structure consists of 31 helices fitted into trigonal unit
cells. The SC crystals disordered at a significantly higher temperature compared to the homopolymer crystal owing to the compact lattice dimension and the higher intermolecular
interactions. Therefore, the SC crystals were homogeneously distributed in the molten medium of individual enantiomers at the crystallization temperature of homopolymer during melt crystallization process. However, the SC crystals cannot be assumed as substrate for the melt crystallization of PLLA due to their different crystalline structure. A physically cross-linked network of molecules is developed at a temperature below the melting point of SC crystals, since high molecular weight species can be involved in several crystalline domains. The apparent increase of the molecular weight at this temperature region leads to an enhancement of the zero shear viscosity, as illustrated in Figure 2-6a. A pseudo solid-like behavior is observed at the largest volume fraction of SC crystal in Figure 2-6a.
A substantial thermal shrinkage occurs in polymer melt as it is cooled down to the crystallization temperature, triggering an internal stress. Subsequently, the nucleation rate is accelerated by inducing the internal stress on the chains restricted in the network structure. The effect of stress-induced nucleation is reflected in an increased crystallization temperature during cooling process, as represented in Figure 2-6b.
Figure 2-6. Complex viscosity at 200°C (a) and DSC thermogram of PLLA during cooling from 200°C (b) compounded by various concentrations of PDLA during cooling from 200°C[19].
2.2.2 Multi-step crystallization process
It has been demonstrated that, polylactide crystallization is a sequential process at atomic scale. The intramolecular conformational ordering precedes the intermolecular ordering and the packing of crystallizing segments. However, the intermolecular and the intramolecular ordering had been believed to trigger simultaneously in the course of the crystallization, according to the classical theories [22, 23].
Four pairs of conformational states have been detected in amorphous polylactide, including “gt”, “gg”, “tg”, and “tt”. The “gt” conformer is the most energy-favorable state, creating a periodic helical structure along the chain axis, either with 10 skeletal units in 3 spiral turns (103), in Figure
2-7a, or 3 skeletal units in 1 spiral turn (31), in Figure 2-7b. The second stable conformer, “gg”, is
more favorable to form 41 helical chains [24].
The conformational rearrangements are accelerated by increase of temperature above glass transition. Therefore, prior to the onset of crystallization, the intramolecular conformational ordering gradually occurs in coil-like amorphous chains at crystallization temperature. Subsequently, the crystallizing segments pack into a crystalline lattice upon formation of the helical sequence. This stepwise crystallization process is depicted in Figure 2-8 [22].
Several conformational disorders along the helical structure may remain during the crystallization at low temperatures, due to the high energy barrier of the conformational readjustment. This conformational disorder leads to a decrease of the interchain interaction, accompanied by an increase of the characteristic intermolecular spacing in crystalline lattice. The disordered crystalline structure can be reorganized into an ordered one at higher temperatures.
2.2.3 Crystalline phase transition
It is well-established that, the nucleation rate increases with a decrease of the crystallization temperature, reaching its maximum as the crystallization temperature approaches the glass transition temperature. However, the diffusion rate of the crystallizing segments into the growth front of crystal increases with an increase of the crystallization temperature, associated with the chain mobility. Therefore, overall crystallization rate increases with an increase of the crystallization temperature up to a certain maximum value. At that point, the trend no longer holds
due to the growing entropy barrier of the uncrystallizing segments. Then, the overall crystallization rate reveals bell-shaped temperature dependence [14, 16].
Figure 2-7. Projections perpendicular to the helical axis of a 103 helical conformation (a) and 31
helical conformation (b) [24].
Nevertheless, a discontinuity in the conventional bell-shaped dependence is observed in the cold crystallization of polylactide. The discontinuity is related to the appearance of two distinct maximums of the overall growth rate around 100°C and 125 °C, as illustrated in Figure 2-9.
Figure 2-8. Sequential ordering at atomic scale during cold crystallization of PLLA [22].
The molecular parameters influence the corresponding temperatures of the maximum overall rates. This peculiar behavior had been attributed to regime transitions, from regime II to regime III at around 120°C [25, 26]. The crystallization regimes can be predicted by the calculation of the
secondary crystallization nucleation constant,
K
g, according to the Hoffman-Lauritzen theory.The general expression for the overall crystallization rate of a linear polymer crystal with folded chains is mentioned in Equation 2-1 [21, 27, 28].
Figure 2-9. Overall crystallization rate as a function of crystallization temperature [14].
Where U *is the activation energy of segmental diffusion into the crystallization front.T is the
degree of undercooling, known as the driving force of the crystallization (Tm0 Tc, where
T
m0and Tc stand for equilibrium melting point and crystallization temperature, respectively).
f
is afactor explained by
2
T
c/(
T
m0
T
c)
, R is the gas constant.T
is an imaginary temperature, where all motions associated with viscous flow ceases(Tg 30C), and
G
0 is the front factor. The temperature dependence of the secondary nucleation rate and short-range diffusion are described by the second and first term on the right-hand side of the Equation 2-1, respectively. It has been demonstrated that, crystallization proceeds through regime I in the vicinity of melting point, where) exp( ) ) ( exp( * 0 T Tf K T T R U G G a g a 2-1
the rate of substrate completion, g, is considerably higher than the rate of nuclei deposition, i, leading to the formation of axialite crystalline domains. As the temperature decreases, two consecutive transitions take place in the crystallization regimes, from regime I to regime II, and eventually from regime II to regime III. The completion rate becomes comparable with the deposition rate in regime II (i~g). In regime III, the deposition rate is substantially larger than the completion rate of the substrate (i>>g). Spherulitic crystalline domains are developed in regime II and regime III. The secondary nucleation constant, Kg, of the different regimes are correlated
through Equation 2-2. ) ( 2 ) ( ) (III K I K II Kg g g 2-2
It has been exhibited that, the sudden acceleration of the overall crystallization rate cannot be attributed to the regime transition since no morphological changes have been observed around 120°C.
The crystalline structure of polylactide has been investigated through the comparison of diffraction patterns corresponding to the crystalline domains developed at different temperatures. Several contributions are missing to the diffraction pattern of the crystalline domain formed at a temperature below 90°C, compared to that of the α-form crystals (such as 103 and 011) [14]. Therefore, the crystallization at lower temperatures results in the formation of a disordered α-form crystals, referred as to α'-form crystals [29]. The restricted conformational readjustment at lower temperatures caused the 103 helical chains to pack into a looser crystalline structure during the
multi-step crystallization process, due to the periodically distorted molecular conformation. The crystalline phase manifested a pseudo-hexagonal structure, instead of the orthorhombic structure observed in α-form crystals. Three temperature regions can be discerned through a Gibbs-Thompson type relationship, where crystallization temperature plotted as a function of reciprocal long period in Figure 2-10. This represents that, same crystalline structures were developed at Tc
< 90°C and Tc > 120°C owing to the linear dependence. The top and bottom dash-lines are related
to the formation of the α-form and the α'-form crystals, respectively. However, a deviation from the linear dependence is observed at 90 < Tc < 120°C, in Figure 2-10., while scattered points step
top dash-line. This behavior demonstrates the coexistence of the both crystalline structures. The contribution of the α-form crystals becomes predominant with increase of the crystallization temperature approaching 120°C[30].
Figure 2-10. Relationship between the reciprocal long period and the crystalllization temperature[14].
The α'-form crystals transform into α-forms through a non-isothermal reheating, reflecting in an exotherm around 150°C, as can be seen Figure 2-11.a. This transformation cannot be explained by the melting of disordered α'-crystals and the re-crystallization into α-forms, since no endotherm was detected prior to the exotherm in Figure 2-11.a [13]. Furthermore, the evolution of crystalline phase volume fraction revealed in Figure 2-11.b (by an arbitrary unit), corresponding to the re-heating process of the different crystalline structures developed at various crystallization temperatures. No pre-melting of α'-crystals is manifested as there is no evidence of reduction of the crystalline phase fraction during the re-heating. Therefore, a solid-solid phase transition occurs upon the conformational rearrangements at the elevated temperature, leading to more compact lateral chain packing, and consequently decrease of the unit cell dimensions. The effect of molecular weight emphasizes the contribution of conformational motion to the α'-to- α transition. The lower the molecular weight the less the activation energy of conformational rearrangement
becomes. Then, the variation of interchain characteristic distance,d110/200, of low molecular weight
species triggers at a lower temperature, compared to that of the high molecular weight, as revealed in Figure 2-12. Therefore, the phase transition proceeds at lower temperatures in low molecular weight species [14].
Figure 2-11. DSC thermogram of PLLA annealed at different temperatures [13] (a) Variation of invariant upon heating [14] (b)
2.2.4 Aging-induced molecular ordering
Basically, non-equilibrium glassy state is obtained by quenching of polymer melts to a temperature far below the glass transition. The conformational rearrangements are severely confined in the glassy sate. Therefore, several structural evolutions are expected through annealing of the glassy polymers at a temperature in vicinity of the glass transition, owing to the relatively accelerated segmental motions at this temperature region [31].
Annealing is a free volume controlled process, particularly at a temperature below glass transition, referred to as physical aging. The hole free volumes is created as a result of insufficient packing of the polymer chains, arising from configurational restriction and steric repulsion [32]. Furthermore, excess hole free volumes might be formed depending on the volume difference in
the equilibrium and the non-equilibrium states of the glassy polymer [33]. Quenching process caused a substantial fraction of the free volume absorbed at temperatures above the glass transition, to preserve at the glassy state. Then, the excess free volumes are eliminated during aging process, accompanied by the segmental motions, according to the Fox and Flory theory[16]. Therefore, the chain packing of the glassy polymer becomes denser during physical aging, due to the reduction of the excess hole free volume fraction. Thus, a more ordered molecular structure is derived from aging process [30, 34].
Figure 2-12. Lattice spacing of High and low molecular weight PLLA, estimated from the (110)/(200) after annealing at different temperatures for 360 min [30].
It has been reported that, the physical aging of glassy polylactide leads to an increase of the glass transition temperature and appearance of a pronounced endotherm around Tg [34]. Moreover, the
aged polylactide specimens reveal an unexpectedly larger cold crystallization rate at low temperature during reheating process than that of unaged ones. However, a gradual acceleration of the crystallization rate has been observed by aging of most polymers.
It has been well-understood that, an intermediate ordering, between the crystalline and amorphous state, might be kinetically driven by quenching of a polymer melt through a drastic cooling rate. The rapid cooling process interrupts the multi-step crystallization process, as the lateral packing
of adjacent helices requires strict correlation of handedness and direction during the melt crystallization [35]. Therefore, the quench-induced intermediate structure reveals a disordered chain packing compared to long-range ordered crystalline domains. The intermediate ordered domain is referred to as mesomorphic phase, distributing randomly through the matrix. The ordered domains can be, also, induced through physical aging in glassy state polylactide, depending on structural factors of the molecules as well as aging parameters. The aging-induced short-range ordered structure is developed upon the accelerated conformational changes at aging temperature, accompanied by the formation of relatively disordered helical sequences during a long period [34].
The enthalpy recovery around glass transition temperature and the improved cold crystallization are originated from the presence of this intermediate ordering. Generally, glass transition is defined as a long-range cooperative segmental motion. It has been demonstrated that, the enthalpy, related to the endotherm at the glass transition temperature, is considerably larger than the required activation energy of the conformational rearrangements. Therefore, the pronounced endotherm is explained by the energy absorbed to disorder the locally ordered domains. In other words, the enthalpy recovery is derived from melting of the short-range ordering due to the wide segmental motions in the amorphous fraction at the glass transition temperature. Moreover, the matrix rejuvenation and the recovery of free volumes can enhance the endotherm during re-heating at the glass transition temperature [23].
Furthermore, the formation of the aging-induced ordering enhances the nucleating ability with aging time, leading to a decrease of the crystallization temperature, in Figure 2-13a, and an improvement of the crystallization rate, in Figure 2-13b. The short-range ordered domains may act as the precursor of crystalline ordering, due to the larger population of more energy-favorable conformers and the higher intermolecular interactions than those of the amorphous phase [34].
2.2.5 Rigid amorphous fraction
A fraction of chains, with the length longer than lateral thickness of crystalline lamellae, might be frequently folded into different crystalline domains, also being entangled with amorphous chains [36-38]. Therefore, the tie molecules interconnect the amorphous and the crystalline phases
through covalent bonds in semi-crystalline polymers. Segments confined at the crystalline surface exhibit restricted dynamics compared to that of the bulk-like chains, referring to as rigid amorphous fraction, RAF. Heat capacity, cp, is controlled by vibrational motion below glass
transition [39]. The long-range segmental motions lead to an increase of the heat capacity at the glass transition temperature, manifesting itself as a step during heating process. The rigid fraction of the amorphous phase has larger activation energy of segmental motion than the bulk-like chains. Thus, a distinct glass transition temperature is expected for the rigid fraction as an individual intermediate phase trapped between the crystalline domains and the amorphous phase.
Figure 2-13. Cold crystallization temperature (a) and crystallization half-life (b) as a function of annealing time at different temperature [34].
Moreover, at the glass transition temperature of the bulk-like chains, the increase of the heat capacity steps down with the development of RAF, since a glassy matter does not participate in the cooperative conformational rearrangements of the mobile amorphous phase at this temperature. The devitrification of this intermediate phase may occur at a temperature above the glass transition temperature of the bulk-like chains, between Tg and Tm , depending on degree of restriction.
Multiple endotherms, corresponding to the enthalpy recovery, has been reported at glass transition temperature as a result of physical aging of glassy state polylactide, as represented in Figure
2-14a[40]. The high temperature glass transition is attributed to the devitrification of the fraction of the rigid amorphous phase, developed through aging-induced local ordering. Moreover, RAF has no contribution to energy dissipation at the glass transition temperature of mobile amorphous fraction. However, the devitrification of rigid amorphous fraction addresses a second transition at a higher temperature, as can be seen in Figure 2-14b.
Chain folding mechanism influences the rigid fraction of amorphous phase during crystallization process [41]. It has been mentioned that, random re-entry of the folding stems results in larger fraction of intralamellar tie molecules and loose loops, creating a strong coupling between the neighboring phases [28]. Therefore, cold crystallization usually causes a larger RAF than melt crystallization due to the larger contribution of the crystalline surface structure with random re-entry than that of the adjacent re-re-entry. Furthermore, a broad crystalline surface area is provided in the cold crystallization compared to that of the melt crystallization due to the larger nucleation density.
Figure 2-14. DSC thermogram obtained after an aging period at 45°C for 42 h (solid-line) and the subsequent second heating (a) [40], DMA of PLLA isothermally conditioned at 50°C for
different times (b) [37].
RAF is diminished through reorganization of the crystalline structure and lamellar thickening. The rigid fraction of the amorphous phase obtains enough mobility to rearrange into the crystalline lattice at a temperature above the devitrification of the restricted chains [36]. This causes decoupling of the crystalline and the amorphous phases. The total heat flow can be divided into a
reversing component and a non-reversing component during a heating process. The non-reversing component reflects the latent heat corresponding to phase transitions. The reversing component represents endothermic melting processes. The contribution of reversing component is enhanced by melting of the defective crystals developed through the devitrification and the rearrangement of RAF [39].
RAF is being extended gradually at the early stage of crystallization, as illustrated in Figure 2-15. The higher overall crystallization rate causes larger RAF. The rigid fraction of the amorphous phase levels off at a maximum and subsequently reduces over the longer crystallization time. The rearrangement of RAF into crystalline domains is triggered either at longer crystallization time or through annealing at high temperatures. Moreover, no noticeable variation in RAF has been observed depending on the crystalline phase morphology and polymorphism [39].
Figure 2-15. MAF and RAF of PET as function of the crystallinity, formed during cold-crystallization at 117°C [36].
![Figure 2-10. Relationship between the reciprocal long period and the crystalllization temperature[14]](https://thumb-eu.123doks.com/thumbv2/123doknet/2333979.32356/39.918.265.651.271.572/figure-relationship-reciprocal-long-period-crystalllization-temperature.webp)
![Figure 2-12. Lattice spacing of High and low molecular weight PLLA, estimated from the (110)/(200) after annealing at different temperatures for 360 min [30]](https://thumb-eu.123doks.com/thumbv2/123doknet/2333979.32356/41.918.257.652.401.685/figure-lattice-spacing-molecular-estimated-annealing-different-temperatures.webp)
![Figure 2-14. DSC thermogram obtained after an aging period at 45°C for 42 h (solid-line) and the subsequent second heating (a) [40], DMA of PLLA isothermally conditioned at 50°C for](https://thumb-eu.123doks.com/thumbv2/123doknet/2333979.32356/44.918.123.828.583.818/figure-thermogram-obtained-period-subsequent-heating-isothermally-conditioned.webp)
![Figure 2-17. True stress-true strain curves of PLA films at various draw temperatures beyond the glass transition temperature [47]](https://thumb-eu.123doks.com/thumbv2/123doknet/2333979.32356/49.918.247.656.587.892/figure-stress-strain-curves-various-temperatures-transition-temperature.webp)
![Figure 2-31. Craze surface profile computed from the measured opening displacements using the Fourier transform method [108]](https://thumb-eu.123doks.com/thumbv2/123doknet/2333979.32356/74.918.282.623.244.513/figure-surface-profile-computed-measured-displacements-fourier-transform.webp)
![Figure 2-33. Schematics illustration of surface-to-surface interparticle distance and center-to- center-to-center interparticle distance L [105]](https://thumb-eu.123doks.com/thumbv2/123doknet/2333979.32356/80.918.118.606.131.434/figure-schematics-illustration-surface-interparticle-distance-interparticle-distance.webp)
