Co-creating service recovery after service failure:
The role of brand equity
Simon HAZÉEa
HEC Liège, University of Liège Yves VAN VAERENBERGHb
KU Leuven Vincent ARMIROTTOc
KU Leuven
a Simon Hazée: HEC Liège, University of Liège, Rue St Gilles, 35, Bât. N2, Liège, Belgium, (simon.hazee@ulg.ac.be, Phone: +32 4 232 72 25).
b Yves Van Vaerenbergh (Corresponding author): Department of Marketing, KU Leuven, Warmoesberg 26, 1000 Brussels, (Yves.VanVaerenbergh@kuleuven.be; Phone: +32 2 609 82 89)
c Vincent Armirotto, Department of Marketing, KU Leuven, Warmoesberg 26, 1000 Brussels, (v.armirotto@gmail.com)
This paper is an author pre-print version of a paper accepted for publication in
the Journal of Business Research.
Co-creating service recovery after service failure:
The role of brand equity!
Abstract
Co-creating service recoveries with customers has recently appeared as a new perspective in service research. Prior research demonstrates the effectiveness of co-created recovery strategies in driving customer outcomes, and outlines when co-creating a service recovery is recommended. This paper complements prior research not only by demonstrating the
mediating role of outcome favorability in the relationship between co-created service recovery and customer outcomes, but also by showing whether organizations with different levels of brand equity benefit equally from co-creating service recovery with their customers. The results of two experiments show that co-creating a service recovery makes customers believe they received the most favorable solution for the service failure, which in turn influences satisfaction with service recovery and repurchase intentions. In addition, co-creating a service recovery is recommended for organizations with low levels of brand equity, but not for organizations with high levels of brand equity.
Keywords: Service failure, service recovery, customer satisfaction, co-creation, brand equity
1. Introduction
Many customers experience service failures. For example, the U.S. Department of
Transportation (2016) reports that of the 423,889 flights in the U.S. in February 2016, a little less than 70,000 flights were delayed, and almost 7,000 flights were cancelled. As service failures are a major cause of customer defection (Knox and Van Oest, 2014), managers benefit from understanding how to restore customer satisfaction following these events. Researchers propose several service recovery options, such as offering compensation, apologizing, showing empathy, and offering explanations (Gelbrich & Roschk, 2011). More recently, researchers demonstrate the viable benefits of co-creating service recovery with customers. A co-created service recovery refers to customers’ “ability to shape or personalize the content of the recovery through joint collaboration with the service provider” (Roggeveen, Tsiros, & Grewal, 2012, p. 772). Several studies show the positive effect of a co-created service recovery on customer satisfaction and repurchase intentions, especially since customers consider a co-created service recovery as more fair (e.g., Cheung & To, 2016). Interestingly, research also reveals that a co-created service recovery makes customers less likely to demand a compensation (Roggeveen et al., 2012).
This paper complements prior research in three ways. First, while researchers have been studying service recovery issues for over 40 years (Van Vaerenbergh & Orsingher, 2016), co-creating a service recovery emerged as a research stream only recently. The increased
popularity of co-creation in service recovery calls for additional empirical verifications, particularly considering the increasing emphasis on replications in marketing science (Lynch, Bradlow, Huber, & Lehmann, 2016).
Second, despite the observation that people’s evaluations of joint decision-making is driven by both justice and outcome favorability perceptions (Skitka, Winquist, & Hutchinson, 2003), the service recovery literature focuses predominantly on perceived justice as a
theoretical mechanism. Researchers, however, question whether other mechanisms underlie the effects of service recovery on customer evaluations (Van Vaerenbergh & Orsingher, 2016). This study provides a better understanding of the co-created recovery––customer outcomes relationships by examining the mediating role of outcome favorability, that is customers’ beliefs that the received outcome is the most favorable of all potential outcomes.
Third, prior research mainly examines when a co-created service recovery is appropriate (e.g., in case of severe failures or when the employee initiates the co-created recovery; Roggeveen et al., 2012; Xu et al., 2014a), but do not disclose whether all organizations benefit equally from doing so. This study examines the moderating role of the service provider’s customer-based brand equity (hereafter: brand equity), which refers to the differential effect of brand knowledge on consumer response to the marketing of the brand (Keller, 1993). Customers react differently to service failures caused by high- versus low-equity brands (Brady et al., 2008). Despite the observation that organizations differ significantly in their brand equity, the literature seems to have taken for granted that
organizations could apply the same recovery options. This paper therefore examines whether customer reactions to a co-created recovery depend on the service provider’s brand equity.
2. Theoretical background
2.1. Service recovery, justice and outcome favorability
Service recovery refers to the actions a service provider takes in response to a service failure (Grönroos, 1988). Prior research has commonly applied justice theory to explain why recovery activities (such as offering compensation, apologizing, etc.) affect customers’ evaluations. Customers assess the fairness of the recovery in terms of what is provided to them (distributive justice), how (interactional justice), and why (procedural justice). Justice perceptions, however, explain only between 43 and 63% of the variance in customer
satisfaction and behavioral intentions (Gelbrich & Roschk, 2011). Van Vaerenbergh and Orsingher (2016) thus suggest that mediators other than justice might “provide a more comprehensive understanding of the processes underlying service recovery’s effects on individual customers” (p. 340).
Prior psychological research identifies fairness and favorability as two goals in decision-making (e.g., Skitka et al., 2003; Johnson & Rips, 2015). In line with Skitka et al. (2003), we define outcome favorability as customers’ beliefs that the outcome is strictly better than alternatives, given their self-interests, to offset the dissatisfaction caused by the service failure. Social psychologists debated heavily about whether outcome fairness and outcome favorability are distinct, yet Skitka et al.’s (2003) meta-analysis reached the conclusion that “outcome fairness is empirically distinguishable from outcome favorability” (p. 309). Both concepts are naturally related, yet they refer to different aspects of the decision-making process. While the outcome of a service recovery process might be perceived as fair, this outcome might still not represent the most favorable outcome for a complaining customer. Drawing upon this literature, this study proposes outcome favorability as and alternative mechanism underlying the co-created recovery-customer outcomes relationships. 2.2. Co-creation in service recovery
Researchers recently started to explore the effectiveness of co-creating service recoveries with complaining customers. Co-creation is rooted in the Service-Dominant Logic (SDL), which proposes essentially that customers need to integrate their own resources (tools, skills, knowledge,…) with the resources provided by the organization (tools, skills, knowledge,…) in order to create and maximize value (Vargo & Lusch, 2004). Researchers and practitioners increasingly embrace value co-creation, as adopting these principles creates a more customer-centric organization and increases competitive advantage (Payne, Storbacka, & Frow, 2008).
Against this backdrop, several researchers examine the effectiveness of co-creating a service recovery (see Table 1). Co-creating service recovery generally increases customer evaluations of the service recovery, particularly in case of severe service failures, when the employee initiated the recovery, and if the level of co-creation during service recovery matches the level of co-creation during the initial service encounter. This study aims to broaden the scope of this research by examining the mediating role of outcome favorability and the moderating role of brand equity. Figure 1 provides an overview of the conceptual framework guiding this study.
[Table 1 and Figure 1 about here] 2.3. Hypotheses development
Prior research offers several explanations for the effectiveness of a co-created service recovery. First, customers appreciate the ability to discuss jointly a certain issue, as it allows them to exert more personal control and increase the probability of attaining the optimal outcome (Thibaut & Walker, 1975). For instance, Guo et al. (2015) show that co-creating a recovery increases perceived control over both the process and the recovery solution. Second, Park and Ha (2016) show that co-creating a service recovery leads customers to perceive the service provider as devoting more efforts to finding the most favorable outcome, which ultimately influences their post-recovery evaluations. Third, offering people the opportunity to express their views before the final decision is made signals the flexibility of the
organization (Karande, Magnini, & Tam, 2007), which increases customer outcomes. Fourth, the self-serving bias induces people to take more credit for their own work (Bendapudi & Leone, 2003), leading to perceive the outcome of a co-created recovery as the most favorable. Common to these studies is the observation that customers who co-create a recovery have a higher probability of attaining an outcome that is tailored to their needs, which in turn creates more favorable perceptions of the recovery encounter. Hence, co-creating service recovery
might influence customer perceptions of outcome favorability, which in turn affects their post-recovery evaluations. This study hypothesizes:
H1: Co-creating a service recovery affects customer (a) satisfaction with service recovery, and (b) repurchase intentions
H2: Outcome favorability mediates the relationship between a co-created service recovery and post-recovery evaluations
2.4. The moderating role of brand equity
Brand equity refers to the ‘strength’ of a brand in customers’ minds, and is based upon brand awareness, perceived quality, brand associations, and other brand assets (Aaker, 1991). Brand equity is commonly considered as a signaling phenomenon (Erdem & Swait, 1998); high equity brands convey quality signals that can reduce customers’ uncertainty. Keller and Lehmann (2006) further argue that brand equity plays an important role in reducing risks, especially during failure episodes. For instance, Brady et al. (2008) show that customers are more likely to forgive service failures caused by high equity brands than service failures caused by low equity brands. A high equity brand helps service providers to offset the potential negative consequences resulting from a service failure.
This paper posits that brand equity influences customer reactions to a co-created service recovery. The higher levels of risk and lower quality perceptions associated with low equity brands might make customers more uncertain about getting a favorable outcome during service recovery. Customers experiencing high levels of uncertainty tend to maximize control over the service delivery process (e.g., Grewal et al., 2007). Customers of low equity brands prefer to stay as close to the service provider as possible in order to maintain control and to ensure the service provider finds the best solution for their needs. In contrast, customers of high equity brands may feel less the need to closely monitor the service provider’s actions as
they are more likely to believe that the service provider is acting in their best interest. In support of this rationale, Pitta, Franzak, and Fowler (2006) argue that brand equity fosters trust and serves as a crucial performance guarantee. Customers of low equity brands would thus be less likely to have confidence into firms’ recovery efforts, compared with customers of high equity brands. This lack of confidence leads them to value more the opportunity to co-create the recovery in order to ensure a favorable solution is found. This rationale leads to the following hypothesis:
H3a: For low equity brands, co-creating a service recovery has a positive effect on outcome favorability and subsequent customer outcomes
H3b: For high equity brands, co-creating a service recovery does not have an effect on outcome favorability and subsequent customer outcomes
3. Method
3.1. Procedure and manipulations
Two 2 (co-created vs. no co-created service recovery) × 2 (high equity vs. low equity brand) scenario-based, between-subjects experiments provide tests of the hypotheses. The experiments were conducted in two settings (airline and hotel) in order to increase the generalizability of the findings. Participants were randomly assigned to one of the scenarios. Except for the brand equity manipulation, the researchers kept the scenarios as closely as possible to Roggeveen et al.’s (2012) scenarios. The setting described the context (airline or hotel) and asked participants to imagine going on a holiday. The respondents had previously booked the airline tickets (the hotel room), and the events following their arrival at the airport (the hotel) were happening to them.
This description also contained the brand equity manipulation, which was based on Brady et al.’s (2008) procedure as well as on Aaker’s (1991) definition of brand equity. We
manipulated brand equity by instructions as opposed to being based on respondents’ experience with an actual organization, in order to avoid confounding effects and to overcome the respondents’ potential lack of knowledge about this construct. In the high brand equity condition, respondents were told that the brand was well-known worldwide, and that although they were not experienced with the brand, they knew the brand name and were familiar with its image as a quality service. In the low brand equity condition, respondents were informed that the brand was not well-known, and that they were not familiar with the brand, nor with its image. The brand equity manipulations were identical across both settings.
The next section detailed the service failure. The scenario in the airline setting described a service failure that was due to uncontrollable, external causes. The participants were asked to imagine arriving at the airport, only to find out that their flight is cancelled due to bad
weather conditions. To increase generalizability, the failure in the hotel setting was not clearly due to uncontrollable, external reasons. In particular, the respondents were told the room is unavailable because the reservation had not been confirmed due to a computer error.
The final section described the firm’s response to the failure. The employee acknowledged the problem quickly, provided an explanation for the cancellation, and promised the customer to book him/her a new flight (room) in all scenarios. In the no co-creation condition, the customer is asked to wait in the lounge next to the check-in desk. After 10 minutes, the customer is told that the employee was able to book the customer to the next flight (another room at a partner hotel), which departs in 9 hours (is ready in a couple of hours). In the co-creation condition, the employee and customer discussed several alternatives before arriving at the same solution. In line with Roggeveen et al.’s (2012) findings, this study focuses on severe failures.
Table 2 lists all measures. Customer satisfaction with service recovery was measured using a three-item scale adopted from Roggeveen et al. (2012). Repurchase intentions were measured using a three-item scale adopted from Maxham and Netemeyer (2002). Outcome favorability was measured with two items developed for the purposes of this study, following Skitka et al.’s (2003) definition. A three-item scale measuring customer-based brand equity adopted from Brady et al. (2008) assessed the effectiveness of the brand equity
manipulations. Finally, Van Vaerenbergh et al.’s (2013) two-item scale measured scenario realism. All items were rated on a seven-point Likert scale. Items from the various scales were interspersed to hinder formation of response sets. Finally, as survey participants might engage in satisficing (i.e., answering questions with as little cognitive effort as possible), the survey included an instructional manipulation check (Oppenheimer, Meyvis, & Davidenko, 2009). One of the questions was phrased: “If you read this question, please tick the answer: Strongly agree.” A failure to comply with the instructional manipulation check signals satisficing, which threatens the validity of the findings.
[Table 2 here] 3.3. Participants
A market research agency collected data based on its consumer panel. Data were collected based on quota sampling, such that the sample was representative for the U.S. population in terms of gender, age, and education. Before collecting the data, the authors performed sample size calculations using G*Power 3.1.6 (Faul et al., 2007). The authors determined the
appropriate effect size by performing a meta-analysis of the co-creation––satisfaction with service recovery (14 effect sizes reported in 7 studies, with a total N of 3,933) and the co-creation––repurchase intentions (11 effect sizes reported in 7 studies, with a total N of 5,553) relationships. Using standard meta-analytic procedures (Hunter & Schmidt, 2007), the results show a sample-size weighted reliability-corrected correlation of .16 (p < .001) for satisfaction
with service recovery and .24 (p < .001) for repurchase intentions. The lowest estimate served as input for the power analysis, returning a minimum required sample size of 436 participants per setting.
Bearing in mind the potential for satisficing, we instructed the market research agency to oversample with 30%. In total, 1,170 U.S. respondents (NAirline = 583, NHotel = 587)
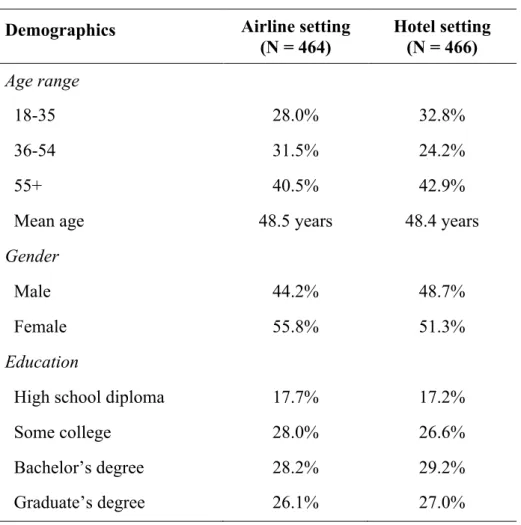
participated in this study. About 20% of the participants had to be excluded from the analysis because they failed to provide the correct response to the instructional manipulation check. 930 respondents (NAirline = 464, NHotel = 466) provided usable responses, which exceeds the recommended sample size. Table 3 provides an overview of the samples; Table 4 provides some descriptive statistics.
[Tables 3 and 4 here]
4. Results
4.1. Manipulation checks and psychometric properties
The brand equity manipulation worked as intended. Respondents reading a scenario about the low equity brand perceive lower levels of brand equity (airline M = 3.8, SD = 1.9; hotel M = 4.0, SD = 1.8) than respondents reading a scenario about the high equity brand (airline M = 5.7, SD = 1.26; t(406.8) = 12.77, p < .001; hotel M = 5.8, SD = 1.2; t(393.5) = 12.99, p < .001). Moreover, the respondents evaluated the scenarios as realistic (airline: M = 6.0, SD = 1.0; hotel: M = 6.0, SD = 0.9).
The authors also assessed the constructs’ psychometric properties using Partial Least Squares Structural Equation Modeling (PLS-SEM). An inspection of outer loadings after the initial run, however, revealed that the reversed items of the repurchase intentions measure did not meet the criteria for convergent validity (all outer loadings > .70; Hair et al., 2011). This item was dropped from the analysis. After a rerun, the outer model demonstrates indicator validity (all indicator loadings > .70), internal consistency reliability (all composite
reliabilities > .70), convergent validity (all average variances extracted > .50), and
discriminant validity (all HTMT ratios < .90; Hair et al., 2011; Henseler, Ringle & Sarstedt, 2015) of the measures (see Table 2). The R²-values for outcome favorability (airline: 7.2%, p < .01; hotel: 7.3%, p < .01; combined: 6.7%, p < .001), satisfaction with service recovery (airline: 54.0%, p < .001; hotel: 45.5%, p < .001; combined: 49.0%, p < .001), and repurchase intentions (airline: 72.8%, p < .001; hotel: 62.7%, p < .001, combined: 65.0%; p < .001) are all significant. The model meets all relevant properties.
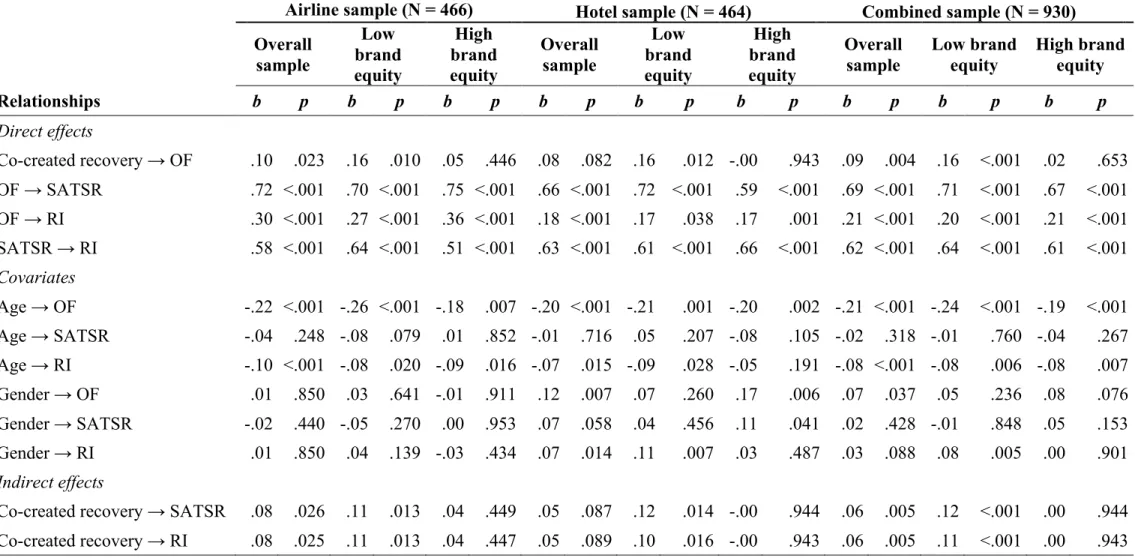
4.2 Hypotheses testing
The first hypothesis proposes that co-creating a service recovery increases customer satisfaction with service recovery and repurchase intentions. Statistically significant differences in the level of satisfaction with service recovery occur between the co-created recovery conditions, in both the airline setting (Mco-creation = 5.4, SD = 1.4; Mno co-creation = 4.9,
SD = 1.6; t(462)= 3.61, p < .001) and the hotel setting (Mco-creation = 5.2, SD = 1.4; Mno co-creation = 4.9, SD = 1.6; t(464)= 2.32, p < .05). The results also show a significant effect of a co-created service recovery on repurchase intentions in the airline setting (Mco-creation = 4.9, SD = 1.4; Mno co-creation = 4.6, SD = 1.6; t(462)= 2.12, p < .05), but not in the hotel setting (Mco-creation = 4.2, SD = 1.4; Mno co-creation = 3.9, SD = 1.7; t(464)= 1.64, p > .05). These findings provide support for H1a, but only partial support for H1b.
A multi-group structural equation model (SEM) tests the mediation (outcome
favorability) and moderation (brand equity) hypotheses. A SEM model is preferred over other analysis techniques as this model allows researchers to assess the reliability and validity of the measurement instrument (see section 4.1), yields more powerful tests of hypotheses that are less likely to be biased by measurement error, and allows researchers to test for mediating effects more easily (Russell et al., 1998). We use a Partial Least Squares (PLS) SEM method instead of a covariance-based SEM method because experimental data often fails to meet the
requirements of covariance-based SEM (e.g., multivariate normality, large sample sizes), improper or nonconvergent solutions are bound to occur with covariance-based SEM, and PLS-SEM models can be specified more easily for experimental data than covariance-based SEM models (Bagozzi & Yi, 1989; Bagozzi, Yi, & Singh, 1991).
The structural model provides a test of the hypothesized relationships (see Figure 1). Although not hypothesized, the model also includes a path from satisfaction with service recovery to repurchase intentions (Gelbrich & Roschk, 2011), and includes gender and age as covariates. We specified the experimental manipulations by constraining the factor loading of the experimental variable (co-created service recovery) to one. The multi-group PLS-SEM approach allows the comparison of the co-created service recovery ! outcome favorability ! customer outcomes relationships across both low and high brand equity groups. A bootstrapping procedure with 5,000 resamples provides parameter estimates.
Table 5 lists the structural model results. The second hypothesis proposes that outcome favorability would mediate the relationship between co-created service recovery and
customer outcomes. An inspection of the indirect effects reveals a significant indirect effect of a co-created service recovery on satisfaction with service recovery (b = .08, p < .05) and repurchase intentions (b = .08, p < .05) in the airline setting, and a marginally significant indirect effect of a co-created service recovery on satisfaction with service recovery (b = .05, p = .09) and repurchase intentions (b = .05, p < .09) in the hotel setting. In the combined sample, outcome favorability significantly mediates the relationships of co-created service recovery with satisfaction with service recovery (b = .06, p < .01) and repurchase intentions (b = .06, p < .01). These results provide partial support for the second hypothesis.
The third hypothesis proposes that a co-created service recovery would affect outcome favorability and subsequent customer outcomes when customers interact with low equity brands, but not with high equity brands. A co-created service recovery has a significant direct
effect on outcome favorability for low equity brands (airline: b = .16, p < .01; hotel: b = .16, p < .05; combined: b = .16, p < .001), but not for high equity brands (airline: b = .05, p > .10; hotel: b = -.00, p > .10; combined: b = .02, p > .10). An analysis of the indirect effects reveals similar patterns, with co-created service recovery being significantly related to satisfaction with service recovery (airline: b = .11, p < .05; hotel: b = .12, p < .05; combined: b = .12, p < .001) and repurchase intentions (airline: b = .11, p < .05; hotel: b = .10, p < .05; combined: b = .11, p < .001) in the low brand equity setting, but is not related to satisfaction with service recovery (airline: b = .04, p > .10; hotel: b = -.02, p > .10; combined: b = .00, p > .10) and repurchase intentions (airline: b = .04, p > .10; hotel: b = -.02, p > .10; combined: b = .00, p > .10) in the high brand equity setting.
In order to assess the moderating role of brand equity on the direct relationship between co-created service recovery and outcome favorability, and on the indirect relationships between co-created service recovery and recovery evaluations (satisfaction with service recovery and repurchase intentions) through outcome favorability, we specified an interaction effect between co-created service recovery and brand equity in the overall sample model. The interaction effect on outcome favorability is marginally significant in the hotel setting (b = -.08, p = .064) and not significant in the airline setting (b = -.06, p = .175). The moderating effect of brand equity on the indirect relationship between a co-created service recovery and satisfaction with service recovery is marginally significant in the hotel setting (b = -.06, p = .068) and not significant in the airline setting (b = -.05, p = .178). Likewise, the moderating effect of brand equity on the indirect relationship between a co-created service recovery and repurchase intentions is marginally significant in the hotel setting (b = -.05, p = .067) and not significant in the airline setting (b = -.04, p = .179).
Post hoc power analyses, however, reveal that both samples might lack statistical power to detect a significant interaction effect. The required samples size was calculated based on
the main effects of a co-created recovery with customer outcomes (see section 3.3). Interaction effects, however, typically show smaller effect sizes than main effects.
Calculations using G*Power, using the small effect size convention (r = .10) as input, show that it would take at least 1,073 respondents to accurately assess this particular interaction effect. We therefore rely on the combined sample (N = 930) to formally evaluate the third hypothesis. The results show a significant interaction effect on outcome favorability (b = -.07, p = .021), a significant interaction effect on the indirect relationship between a co-created service recovery and satisfaction with service recovery through outcome favorability (b = -.05, p = .023), and a significant interaction effect on the indirect relationship between a co-created service recovery and repurchase intentions through outcome favorability (b = -.05, p = .023). These findings support H3a and H3b.
4.3. Robustness tests
Several tests of alternative explanations examine the robustness of our findings1. In particular, customers might perceive a co-created recovery as risky and stressful. Instead of simply “receiving” a recovery, they might need to negotiate about their ideal service
recovery. Hence, customers might have to engage in a series of stressful negotiations with the service provider before being able to attain the desired outcome. For this reason, we examine whether perceived risk and perceived stress differ among customers who co-create a service recovery and customers who do not co-create a service recovery. In addition, customers might perceive the organization’s invitation to co-create the service recovery as an attempt to shift the responsibility of coming up with a solution onto the customer’s shoulders, and to take advantage of customers by recovering the service failure with as little effort and especially as little compensation as possible. Customers might perceive the organization’s
invitation to co-create the service recovery as greedy, as a co-created service recovery might come across as an attempt to serve themselves.
The survey also included questions about customers’ perceived risk, perceived stress, and perceived greed. Risks associated with the service recovery (airline α = .93; hotel α = .92) were measured using a two-item semantic differential adapted from Grewal et al. (2007). The items are: “I would describe the way in which the solution was found as not at all risky/very risky” and “Overall, I would rate the process through which the problem was resolved as not at all risky/very risky”. Perceived stress (airline α = .85; hotel α = .84) was measured using a three-item seven-point Likert scale adapted from Duhachek (2005). The items are: “The process through which the problem was resolved was stressful”, “The way the company handled the situation made me anxious”, and “The way the company dealt with the problem worried me”. Perceived greed (airline α = .84; hotel α = .85) was measured using a three-item seven-point Likert scale adapted from Grégoire, Laufer, and Tripp (2010). The measures are: “The company intended to take advantage of me given the way they handled the situation”, “The company was primarily motivated by its own interest through the process of finding a solution”, and “The company had bad intentions during the process for finding a solution”. The results of two-way analyses of variance, with perceived risk, perceived stress, and perceived greed as dependent variables, and the level of co-creation in the service recovery and the level of brand equity as independent variables, are not significant for the main effects nor for the interaction effects (all p-values > .05). Moreover, the relationships between a co-created service recovery and customer outcomes do not change substantially when adding perceived risk, perceived stress, and perceived greed as covariates to the model.
5. Discussion
The aim of this paper was to examine the impact of co-creating a service recovery on customer outcomes, resulting in three main contributions. First, the relationships between co-creation in service recovery and customer outcomes are not as clear-cut as in prior research. A co-created service recovery has a significant effect on satisfaction with service recovery in both settings, but has a significant effect on repurchase intentions only one setting. In order to assess the extent to which these findings diverge from prior literature, we use the
meta-analytic effect size estimates reported in the method section (section 3.3. Participants) to construct a theoretical effect size distribution for both dependent variables. Figure 2 shows these meta-analytically derived effect size distributions. We also plotted the effect sizes for the co-created service recovery––customer outcomes relationships in both samples.
[Figure 2 here]
The obtained effect sizes for the co-created recovery – satisfaction with recovery relationship fall within the confidence intervals. Hence, the current research findings corroborate with prior research results (Roggeveen et al., 2012). The effect sizes for the co-created service recovery––repurchase intentions relationship fall outside the meta-analytic confidence intervals, and are generally weaker than the effect sizes reported in prior research. More research is necessary to further validate the relationships between a co-created recovery and customer outcomes, and to test moderators that might explain the mixed findings.
Second, this study extends prior research by examining the mediating role of outcome favorability. While justice theory has been the dominant framework in explaining customer reactions to (co-created) service recovery, Gelbrich and Roschk’s (2011) meta-analysis shows justice only partially explains customer outcomes. Drawing on prior research in decision-making (e.g., Skitka et al., 2003), this study shows that co-creating a service recovery influences customers’ beliefs about the favorability of the outcome, which in turn influences their evaluations. Customers evaluate a recovery based on whether they received
the best solution to the problem at hand. This study responds to Van Vaerenbergh and Orsingher’s (2016) recent call for more research on the processes––different from justice–– underlying service recovery’s effects on customers, and shows that outcome favorability might be a variable worthy of further investigation.
Third, prior research examines whether and when a co-created recovery is recommended (e.g., Roggeveen et al., 2012; Xu et al., 2014a). This paper complements prior research by showing that a co-created recovery seems recommended for firms with low brand equity, but not for firms with high brand equity. The uncertainty associated with low equity brands drives customers to exert more control over the recovery process in order to ensure a
favorable solution. In contrast, a high equity brand reduces uncertainty and bolsters customer trust into the firm’s actions (Aaker, 1991; Pitta et al., 2006), making a co-created recovery not more efficient than a traditional recovery. Taking a broader perspective, this study questions whether creating service is recommended for all organizations. Value co-creation becomes a dominant stream within service research; this paper’s findings provide indications that co-creating a service might be valued differently for high and low equity service brands.
5.2. Managerial implications
This research carries several implications for practice. First, co-creating a recovery generally yields positive results; firms might benefit from training their frontline employees or altering their service scripts to incorporate co-created service recoveries. While this is a recommendation stemming from prior research (Roggeveen et al., 2012), this study outlines the role of outcome favorability. Frontline employees need to reassure customers that they are receiving the most favorable outcome for the service failure, rather than simply “a” solution. Frontline employees might show customers clearly a list of alternatives, and
the offered solution is also the most favorable one. Including such behavior in employees’ training might allow organizations to attain the viable benefits of a co-created recovery. Second, although brand equity is considered as an important dimension driving businesses today (Keller & Lehmann, 2006), not all companies might be aware of their brand equity level. Hence, service providers could use the established scales used in this study in order to first determine their brand equity level, or derive the latter based on prior surveys measuring brand awareness, brand image, and so forth. Managers might also use online reviews
(Bambauer-Sachse & Mangold, 2011) or social media (Bruhn, Schoenmueller, & Schäfer, 2012) to determine customer perceptions of brand equity.
Once managers identified their brand equity level, they may decide whether to implement co-creation in their recovery procedures. Customers of low equity brands perceive more uncertainty and less confidence. Co-creating the recovery seems to be efficient for firms with low brand equity as it allows their customers to exert personal control over the process, reduce the uncertainty, and ensure the best solution is found. In contrast, customers of high equity brands have more confidence in the firm’s actions and, therefore, value less co-creation in recovery. Such findings are particularly relevant as low equity brands typically focus on price, and hence may not wish to invest the time and effort to co-create a service recovery. Co-creating a service recovery is however an easy-to-implement technique, which is especially important for firms with limited resources and low brand equity.
5.3. Limitations and future research
Several limitations of the present study offer opportunities for future research. First, this study relies on a scenario-based experiment to test the hypotheses. Even though recent meta-analyses show only limited differences between service recovery studies using experiments and surveys (Gelbrich & Roschk, 2011; Van Vaerenbergh et al., 2014), experiments are useful for achieving high internal validity but might limit the external validity. Hence, future
research might use a survey method, a role-playing experiment, or a field experiment to replicate our findings.
Second, this study focuses on brand equity as a firm-specific moderator. Brand equity is based upon brand awareness, perceived quality, brand associations, and other brand assets (Aaker, 1991). Future research could single out the effects of these variables to expand the scope of the present study. Future research might also examine other relevant moderators, such as the firm size or the country-of-origin. For instance, customers might prefer to co-create a recovery with a small firm, as they might believe no recovery procedures are in place to ensure a proper solution to their complaint.
Finally, this paper examines outcome favorability as a theoretical mechanism for the co-created service recovery––customer outcomes relationships. Given that outcome justice and outcome favorability are related (Skitka et al., 2003), future research might model both
References
Aaker, D.A. (1991). Managing brand equity. New York, NY: The Free Press.
Bagozzi, R.P. & Yi, Y. (1989). On the use of structural equation models in experimental designs. Journal of Marketing Research, 26 (3), 271-284.
Bagozzi, R.P., Yi, Y., & Singh, S. (1991). On the use of structural equation models in experimental designs: Two extensions. International Journal of Research in Marketing, 8 (1), 125-140.
Bambauer-Sachse, S., & Mangold, S. (2011). Brand equity dilution through negative online word-of-mouth communication. Journal of Retailing and Consumer Services, 18(1), 38-45.
Bendapudi, N., & Leone, R.P. (2003). Psychological implications of customer participation in co-production. Journal of Marketing, 67 (1), 14-28.
Brady, M.K., Cronin, J.J.Jr., Fox, G.L. & Roehm, M.L. (2008). Strategies to offset
performance failures: The role of brand equity. Journal of Retailing, 84 (2), 151-164. Bruhn, M., Schoenmueller, V., & Schäfer, D.B. (2012). Are social media replacing
traditional media in terms of brand equity creation? Management Research Review, 35(9), 770-790.
Cheung, F.Y.M., & To, W.M. (2016). A customer-dominant logic on service recovery and customer satisfaction. Management Decision, 54 (10), 2524-2543.
Dong, B., Evans, K. R., & Zou, S. (2008). The effects of customer participation in co-created service recovery. Journal of the Academy of Marketing Science, 36 (1), 123-137.
Dong, B., Sivakumar, K., Evans, K. R., & Zou, S. (2016). Recovering coproduced service failures: Antecedents, consequences, and moderators of locus of recovery. Journal of Service Research, 19 (3), 291-306.
Duhachek, A. (2005). A multidimensional, hierarchical framework of responses to stressful consumption episodes. Journal of Consumer Research, 32 (1), 41-53.
Erdem, T., & Swait, J. (1998). Brand equity as a signaling phenomenon. Journal of Consumer Psychology, 27 (2), 131-157.
Faul, F., Erdfelder, E., Lang, A.G., & Buchner, A. (2007). G*Power 3: A flexible statistical power analysis program for the social, behavioral, and biomedical sciences. Behavior Research Methods, 39, 175-191.
Gelbrich, K. & Roschk, H. (2011). A meta-analysis of organizational complaint handling and customer responses. Journal of Service Research, 14 (1), 24-43.
Gohary, A., Hamzelu, B., Pourazizi, L., & Hanzaee, K.H. (2016a). Understanding effects of co-creation on cognitive, affective and behavioral evaluations in service recovery: An ethnocultural analysis. Journal of Retailing and Consumer Services, 31 (July), 182-198. Gohary, A., Hamzelu, B., & Alizadeh, H. (2016b). Please explain why it happened! How
perceived justice and customer involvement affect post co-recovery evaluations: A study of Iranian online shoppers. Journal of Retailing and Consumer Services, 31 (July), 127-142.
Grégoire, Y., Laufer, D., & Tripp, T.M. (2010). A comprehensive model of customer direct and indirect revenge: Understanding the effects of perceived greed and customer power. Journal of the Academy of Marketing Science, 38(6), 738-758.
Grewal, D., Gopalkrishnan, R.I., Gotlieb, J., & Levy, M. (2007). Developing a deeper understanding of post-purchase perceived risk and behavioral intentions in a service setting. Journal of the Academy of Marketing Science, 35 (2), 250-258.
Grönroos, C. (1988). Service quality: The six criteria of good perceived service quality. Review of Business, 9 (3), 10-13.
Guo, L., Lotz, S.L., Tang, C., & Gruen, T.W. (2016). The role of perceived control in
customer value concretion and service recovery evaluation. Journal of Service Research, 19 (1), 39-56.
Hair, J.F., Ringle, C.M., & Sarstedt, M. (2011). PLS-SEM: Indeed a silver bullet. Journal of Marketing Theory and Practice, 19 (2), 139-152.
Heidenreich, S., Wittkowski, K., Handrich, M., & Falk, T. (2015). The dark side of customer co-creation: exploring the consequences of failed co-created services. Journal of the Academy of Marketing Science, 43 (2), 279-296.
Henseler, J., Ringle, C.M., & Sarstedt, M. (2015). A new criterion for assessing discriminant validity in variance-based structural equation modeling. Journal of the Academy of Marketing Science, 43 (1), 1-21.
Huang, H.H. (2016). A study of customer co-recovery from self-oriented and other-oriented perspectives. Journal of Leisure, Tourism, Sport, & Health, 6 (2), 1-28.
Hunter, J.E., & Schmidt, F.L. (2007). Methods of meta-analysis: Correcting error and bias in research findings (2nd ed.). Thousand Oaks, CA: Sage.
Johnson, S.G.B., & Rips, L.J. (2015). Do the right thing: The assumption of optimality in lay decision theory and causal judgment. Cognitive Psychology, 77, 42-76.
Karande, K., Magnini, V.P., & Tam, L. (2007). Recovery voice and satisfaction after service failure: An experimental investigation of mediating and moderating factors. Journal of Service Research, 10 (2), 187-203.
Keller, K.L. (1993). Conceptualizing, measuring, and managing consumer-based brand equity. Journal of Marketing, 57 (1), 1-22.
Keller, K.L., & Lehmann, D.R. (2006). Brands and branding: Research findings and future priorities. Marketing Science, 25 (6), 740-759.
Knox, G., & Van Oest, R. (2014). Customer complaints and recovery effectiveness: A customer base approach. Journal of Marketing, 78 (September), 42-57.
Lynch, J.G., Bradlow, E.T., Huber, J.C., & Lehmann, D.R. (2016). Reflections on the replication corner: In praise of conceptual replications. International Journal of Research in Marketing, 32 (4) 333-342.
Maxham, J.G., & Netemeyer, R.G. (2002). A longitudinal study of complaining customers' evaluations of multiple service failures and recovery efforts. Journal of Marketing, 66 (4), 57-71.
Oppenheimer, D.M., Meyvis, T., & Davidenko, N. (2009). Instructional manipulation checks: Detecting satisficing to increase statistical power. Journal of Experimental Social
Psychology, 45 (4), 867-872.
Park, J., & Ha, S. (2016). Co-creation of service recovery: Utilitarian and hedonic value and post-recovery responses. Journal of Retailing and Consumer Services, 28 (January), 310-316.
Payne, A.F., Storbacka, K., & Frow, P. (2008). Managing the co-creation of value. Journal of the Academy of Marketing Science, 36 (1), 83-96.
Pitta, D., Franzak, F., & Fowler, D. (2006). A strategic approach to building online customer loyalty: integrating customer profitability tiers. Journal of Consumer Marketing, 23 (7), 421-429.
Roggeveen, A.L., Tsiros, M., & Grewal, D. (2012). Understanding the co-creation effect: when does collaborating with customers provide a lift to service recovery? Journal of the Academy of Marketing Science, 40 (6), 771-790.
Russell, D.W., Kahn, J.H., Spoth, R., & Altmaier, E.M. (1998). Analyzing data from
experimental studies: A latent variable structural equation modeling approach. Journal of Counseling Psychology, 45 (1), 18-29.
Skitka, L., Winquist, J., & Hutchinson, S. (2003). Are outcome fairness and outcome favorability distinguishable psychological constructs? A meta-analytic review. Social Justice Research, 16 (4), 309-341.
Thibaut, J., & Walker, L. (1975). Procedural justice: A psychological analysis. Hillside, NJ: Lawrence Erlbaum.
U.S. Department of Transportation (2016), Air Travel Consumer Report, April 2016, https://www.transportation.gov/sites/dot.gov/files/docs/2016AprilATCR_0.pdf
Van Vaerenbergh, Y., & Orsingher, C. (2016). Service recovery: An integrative framework and research agenda. Academy of Management Perspectives, 30 (3), 328-346.
Van Vaerenbergh, Y., Orsingher, C., Vermeir, I., & Larivière, B., (2014). A meta-analysis of relationships linking service failure attributions to customer outcomes. Journal of Service Research, 17 (4), 381-398.
Van Vaerenbergh, Y., Vermeir, I. & Larivière, B. (2013). Service recovery’s impact on customers next-in-line. Managing Service Quality, 23 (6), 495-512.
Vargo, S., & Lusch, R. (2004). Evolving to a new dominant logic in marketing. Journal of Marketing, 68 (1), 1-17.
Vazquez-Casielles, R., Iglesias, V., & Varela-Neira, C. (2016). Co-creation and service recovery process communication: Effects on satisfaction, repurchase intentions, and word of mouth. Service Business, forthcoming.
Xu, Y., Marshall, R., Edvardsson, B., & Tronvoll, B. (2014a). Show you care: Initiation co-creation in service recovery. Journal of Service Management, 25 (3), 369-387.
Xu, Y., Tronvoll, B., & Edvardsson, B. (2014b). Recovering service failure through resource integration. Service Industries Journal, 34 (16), 1253-1271.
Figure 1: Conceptual framework
Note: Dashed lines represent non-hypothesized relationships
Co-creation in service recovery Outcome favorability Customer satisfaction with service recovery Brand equity Repurchase intentions Covariates • Age • Gender
Figure 2: Effect size distributions
! Notes: Full lines represent the meta-analytically derived effect size distribution. Dashed lines
represent location of effect sizes of the current examination. LCI refers to the lower 95% confidence interval, and UCI refers to the upper 95% confidence interval of the effect size distribution. ! 0 0. 01 0. 02 0. 03 0. 04 0. 05 0. 06 0. 07 0. 08 0. 09 0. 10 0. 11 0. 12 0. 13 0. 14 0. 15 0. 16 0. 17 0. 18 0. 19 0. 20 0. 21 0. 22 0. 23 0. 24 0. 25 0. 26 0. 27 0. 28 0. 29 0. 30 0. 31 0. 32 0. 33 0. 34 0. 35 0. 36 0. 37 0. 38 0. 39 0. 40
r = .156
LCI: .068
UCI: .245
Sat
is
fact
io
n
w
it
h
serv
ice
reco
very
Airline setting:
r = .166
Hotel setting:
r = .098
0 0. 01 0. 02 0. 03 0. 04 0. 05 0. 06 0. 07 0. 08 0. 09 0. 10 0. 11 0. 12 0. 13 0. 14 0. 15 0. 16 0. 17 0. 18 0. 19 0. 20 0. 21 0. 22 0. 23 0. 24 0. 25 0. 26 0. 27 0. 28 0. 29 0. 30 0. 31 0. 32 0. 33 0. 34 0. 35 0. 36 0. 37 0. 38 0. 39 0. 40r = .235
LCI: .146
UCI: .324
Rep
urch
as
e
in
ten
ti
on
s
Airline setting:
r = .107
Hotel setting:
r = .076
Reference! Objectives! Context! Method! Main results! Cheung &
To (2016)!
Explores the antecedents and outcomes of customer co-creation of service recovery!
Various settings (e.g., Telecom,
bank)!
Survey!
- Customer information sharing and co-production in the service failure influence co-creation of service recovery.
- A co-created recovery positively influences perceived justice and customer satisfaction with service recovery.
Dong et al. (2008)!
Conceptualizes customer
participation in service recovery !
Course registration and
Internet setup !
Two experiments!
- Customers participating in co-created recovery report higher levels of role clarity, perceived value, satisfaction with the service experience, and intention to co-create in the future.
Dong et al. (2016)!
Investigates antecedents of customer expectancy of recovery after a co-created service failure, the impact of different recovery strategies on evaluation, and the moderating roles of recovery urgency and preference matching!
Online car rental !
Three experiments!
- A co-created recovery is most effective in generating satisfaction with recovery and intention for future coproduction.
- A co-created recovery is even more efficient under resource constraints, regardless of preference matching.
Gohary et al. (2016a)!
Examines the effects of perceived justice and co-creation on
customer outcomes in two ethnic groups !
Mobile banking!
One experiment!
- Co-creation strategy in recovery process increases both
negative and positive emotions, perceived justice, satisfaction, and reuse intentions
- Co-creation promotes procedural justice among Azeri (versus Baloch) people, leading to less negative evaluations
Gohary et al. (2016b)!
Examines the effects of the perceived justice and co-creation on customer evaluations!
Online retail!
One experiment!
- Justice dimensions are positively associated with satisfaction. - Involvement in the service recovery mediates the relationship
between justice dimensions and satisfaction.
Guo et al. (2015)!
Conceptualizes three types of customer perceived control in service recovery! Various settings (e.g., auto repair, hotel, cable firm)! Survey and experiment!
- Customers are motivated to exert influence and regain control over service recovery for economic and psychosocial gains. - The various types of control either substitute (process and
decision control), or complement (information and process control) in influencing customers’ recovery evaluations.
Heidenreich et al. (2015)!
service failure episodes and the effectiveness of different recovery strategies!
and train booking !
Four experiments!
negative disconfirmation than failures of regular encounters. - Firms benefit from mirroring the level of co-creation in service
recovery with the level of co-creation during service delivery.
Huang (2016)!
Explores a conceptual model of customer co-recovery, moderated by self-other perspective!
Restaurant! experimentOne !
- Customers with a self-oriented view experiencing a firm-attributed failure have more positive evaluations than customers with an other-oriented view.
- An observer witnessing a co-created service recovery to another customer has more positive evaluations and behavioral intentions than an observer witnessing a firm-attributed failure.
Karande et al. (2007)!
Investigates mediating and moderating factors between recovery voice and satisfaction!
Airline and hotel!
Two experiments!
- Recovery voice increases procedural justice, which results in higher levels of overall satisfaction.
- Recovery voice has a greater impact on procedural justice for established customers than for new ones.
Park & Ha (2016)!
Explores the value customers derive from co-creation
experiences in service failure and recovery encounters.!
Hotel! experimentOne !
- Utilitarian value enhances both equity and affect while hedonic value contributes only to equity.
- Equity and affect are positively associated with repurchase intentions.
Roggeveen et al. (2012)!
Examines whether co-creation affects customer outcomes, and whether it is a cost-effective alternative to compensation!
Airline! experimentsFour !
- A co-created service recovery improves customer satisfaction and repurchase intentions for severe failures (mediated by perceived justice).
- A co-created recovery is effective only when customers view the co-created recovery positively.
Vazquez-Casielles et al. (2016)!
Investigates the impact of compensation, co-creation, and process recovery communication on customer outcomes.!
Retail! experimentOne !
- Co-creation and process recovery communication improve customer satisfaction, repurchase intentions, and word-of-mouth.
Xu et al. (2014a)!
Explores the effect of initiating a co-created recovery in two countries !
Hotel! experimentOne !
satisfaction and repurchase intentions if the employee initiates the recovery, but not when the customer initiates the recovery. - Western customers are more sensitive to initiation than Eastern
customers.
Xu et al. (2014b)!
Explores the role of resource integration for value co-creation in service recovery! Various settings + Hotel! CIT study and experiment!
- Co-created service recovery efforts create more favorable customer experiences than recovery without co-creation - Customer-perceived justice of activities in handling the
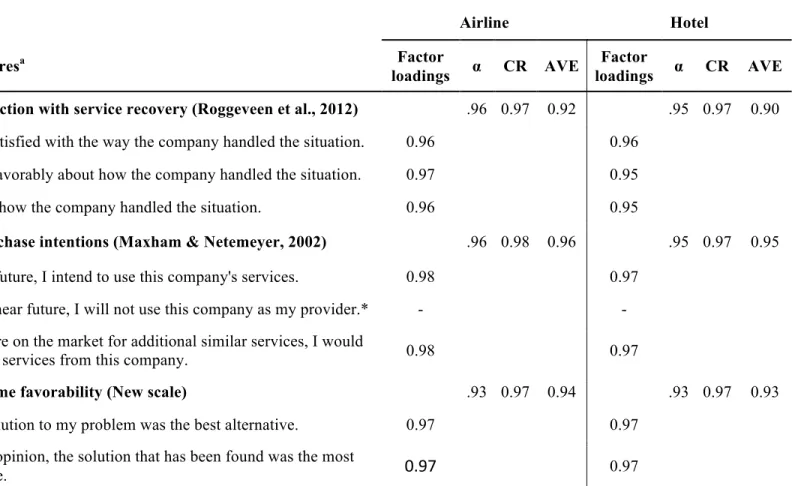
Table 2: Dependent measures
Airline! Hotel!
Measuresa! loadingsFactor ! α! CR! AVE! loadingsFactor ! α! CR! AVE!
Satisfaction with service recovery (Roggeveen et al., 2012)! .96! 0.97! 0.92! .95! 0.97! 0.90! I am satisfied with the way the company handled the situation.! 0.96! 0.96!
I feel favorably about how the company handled the situation.! 0.97! 0.95!
I liked how the company handled the situation.! 0.96! 0.95!
Repurchase intentions (Maxham & Netemeyer, 2002)! .96! 0.98! 0.96! .95! 0.97! 0.95! In the future, I intend to use this company's services.! 0.98! 0.97!
In the near future, I will not use this company as my provider.*! -! -! If I were on the market for additional similar services, I would
use the services from this company.! 0.98! 0.97!
Outcome favorability (New scale)! .93! 0.97! 0.94! .93! 0.97! 0.93! The solution to my problem was the best alternative.! 0.97! 0.97!
In my opinion, the solution that has been found was the most
suitable.! 0.97! 0.97!
a All items were presented using 7-point Likert scales (1 = strongly disagree; 7 = strongly agree). CR = Composite reliability, AVE = Average
Table 3: Participant demographics
Demographics! Airline setting
(N = 464)! Hotel setting (N = 466)! Age range! 18-35! 28.0%! 32.8%! 36-54! 31.5%! 24.2%! 55+! 40.5%! 42.9%!
Mean age! 48.5 years! 48.4 years!
Gender!
Male! 44.2%! 48.7%!
Female! 55.8%! 51.3%!
Education!
High school diploma! 17.7%! 17.2%!
Some college! 28.0%! 26.6%!
Bachelor’s degree! 28.2%! 29.2%!
Graduate’s degree! 26.1%! 27.0%!
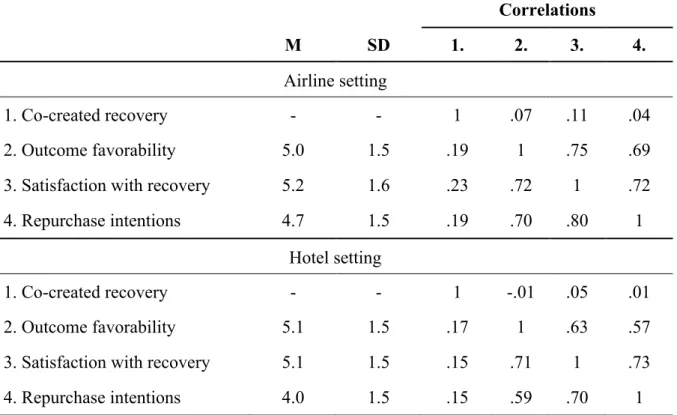
Table 4: Descriptive statistics Correlations! ! M! SD! 1.! 2.! 3.! 4.! Airline setting 1. Co-created recovery! -! -! 1! .07! .11! .04! 2. Outcome favorability! 5.0! 1.5! .19! 1! .75! .69!
3. Satisfaction with recovery! 5.2! 1.6! .23! .72! 1! .72! 4. Repurchase intentions! 4.7! 1.5! .19! .70! .80! 1!
Hotel setting
1. Co-created recovery! -! -! 1! -.01! .05! .01!
2. Outcome favorability! 5.1! 1.5! .17! 1! .63! .57!
3. Satisfaction with recovery! 5.1! 1.5! .15! .71! 1! .73! 4. Repurchase intentions! 4.0! 1.5! .15! .59! .70! 1! Notes: Values below the diagonal represent correlations in the low brand equity setting, values above the diagonal represent correlations in the high brand equity setting.
Table 5: Structural model results
Airline sample (N = 466) Hotel sample (N = 464) Combined sample (N = 930)
Overall sample Low brand equity High brand equity Overall sample Low brand equity High brand equity Overall sample Low brand equity High brand equity Relationships b p b p b p b p b p b p b p b p b p Direct effects Co-created recovery → OF .10 .023 .16 .010 .05 .446 .08 .082 .16 .012 -.00 .943 .09 .004 .16 <.001 .02 .653 OF → SATSR .72 <.001 .70 <.001 .75 <.001 .66 <.001 .72 <.001 .59 <.001 .69 <.001 .71 <.001 .67 <.001 OF → RI .30 <.001 .27 <.001 .36 <.001 .18 <.001 .17 .038 .17 .001 .21 <.001 .20 <.001 .21 <.001 SATSR → RI .58 <.001 .64 <.001 .51 <.001 .63 <.001 .61 <.001 .66 <.001 .62 <.001 .64 <.001 .61 <.001 Covariates Age → OF -.22 <.001 -.26 <.001 -.18 .007 -.20 <.001 -.21 .001 -.20 .002 -.21 <.001 -.24 <.001 -.19 <.001 Age → SATSR -.04 .248 -.08 .079 .01 .852 -.01 .716 .05 .207 -.08 .105 -.02 .318 -.01 .760 -.04 .267 Age → RI -.10 <.001 -.08 .020 -.09 .016 -.07 .015 -.09 .028 -.05 .191 -.08 <.001 -.08 .006 -.08 .007 Gender → OF .01 .850 .03 .641 -.01 .911 .12 .007 .07 .260 .17 .006 .07 .037 .05 .236 .08 .076 Gender → SATSR -.02 .440 -.05 .270 .00 .953 .07 .058 .04 .456 .11 .041 .02 .428 -.01 .848 .05 .153 Gender → RI .01 .850 .04 .139 -.03 .434 .07 .014 .11 .007 .03 .487 .03 .088 .08 .005 .00 .901 Indirect effects
Co-created recovery → SATSR .08 .026 .11 .013 .04 .449 .05 .087 .12 .014 -.00 .944 .06 .005 .12 <.001 .00 .944 Co-created recovery → RI .08 .025 .11 .013 .04 .447 .05 .089 .10 .016 -.00 .943 .06 .005 .11 <.001 .00 .943
Note: Standardized estimates are reported. OF = Outcome favorability, SATSR = Satisfaction with service recovery, RI = Repurchase intentions. !