Speckle interferometry in the long-wave infrared for combining
holography and thermography in a single sensor. Applications to
nondestructive testing: the FANTOM project
Marc P. Georges*
Centre Spatial de Liège-Université de Liège, Liege Science Park, 4031 Angleur, Belgium
ABSTRACT
Speckle interferometry in the thermal wavelengths range (long-wave infrared, 8-14 µm), combining a CO2 laser and
recording with an uncooled microbolometer camera is presented. In this wavelength range specklegrams are affected by the thermal radiation emitted by objects at room temperature. This allows simultaneously capturing temperature and surface shape information about objects. The FANTOM project is based on this concept and an instrument was developed to take advantage of this natural data fusion. It has been used in a variety of nondestructive testing applications where both information are useful, specifically in aeronautical composite structures.
Keywords: Speckle interferometry, CO2 lasers, long-wave infrared, thermography, microbolometer arrays,
nondestructive testing, composite materials, aerospace applications
1. INTRODUCTION
Electronic speckle pattern interferometry (ESPI) and Holographic Interferometry[1] are well-known nondestructive
techniques used for the full-field contactless measurement of object surface displacements, which can be determined through fringes patterns (interferograms) superimposed to the object image. Thermography is an imaging technique which is used in a wide variety of applications, among which nondestructive testing[2]. Following Planck’s law, the
spectral radiance of a blackbody is function of the temperature of the latter[2]. In thermography a thermal imager
integrates this spectral radiance over some infrared spectral range and in a given solid angle. The resulting flux is related to the temperature of the object or scene observed. HI/ESPI and thermography are often used in combination because they give complementary information, mainly in the field of defect detection[3][4][5][6]. Nevertheless in such cases,
separate devices with their own imaging systems are used. Deformation map (from interferograms) and thermal images require to be resampled for correlating both.
The concept presented in this paper is based on the fact that HI or ESPI in the infrared range offers the possibility of a natural fusion of information. Indeed in the infrared these interferometric techniques use cameras which are also used in thermography. Therefore it makes sense to think capturing both information simultaneously on every pixel, which allows a perfect correlation between thermal and deformation fields.
We consider here the long-wave infrared range (LWIR) with wavelengths between 8 and 14 micrometers and the CO2
laser as coherent source, with various possible lines around 10 micrometers. Photochemical hologram recording at this
wavelength was studied already in the 1960s years. In a previous paper[7] we performed a literature survey of the
different materials. We showed that there was no convincing material for recording holograms to be used in HI, mainly because of low resolution and some other practical considerations. Therefore electronic hologram recording is preferred due to the recent development of various thermal focal plane array technologies, which is in constant evolution in terms of performances and resolution increase, while cost decreases.
The very first evidence of such LWIR electronic recording was provided by Løkberg and Kwon in 1984[8] which showed
ESPI with CO2 lasers associated with pyroelectric vidicon cameras. The vidicon image capture requires variable image
intensity. Therefore only variating speckle patterns could be recorded which limited the application of ESPI on vibrating objects. In 2003 Allaria et al.[9] proposed LWIR digital holography (DH) with a modified pyroelectric sensor array which
allows imaging of static objects. Since then that group showed numerous applications and advantages of LWIR DH. One advantage of LWIR DH is the possibility of reconstructing numerically objects larger than in visible DH (for a given distance between the object and the sensor) because the ratio of the wavelength and pixel size is generally 5 to 10 times larger in LWIR[7][10]. Recently it was demonstrated that lensless LWIR DH can capture laser light reflected by humans
illuminated through smokes and flames and reconstruct numerically images of sufficient quality to recognize the presence of people located beyond[11]. An up-to-date review of applications based on specific features of LWIR DH can
be found in [12].
In the metrology and nondestructive testing domain, we have shown various developments and applications. Our preliminary LWIR ESPI results concerned in-plane ESPI[13], out-of-plane ESPI[14] and out-of-plane lensless digital
holographic interferometry (DHI)[14]. In these methods one observes the optical phase differences that are related to the
object displacement or deformation between two object states. The advantages of LWIR are the displacement measurement range which is 20 times larger in the LWIR than in the visible and the relaxed stability constraints[13][14].
We pursued these studies by the development of LWIR DHI for the deformation metrology of large aspheric space reflectors under space simulated environment[7], with various types of illuminations for dealing with the specularity of
surfaces[15] and we have demonstrated its application to exotic shapes like off-axis elliptic reflectors[16].
The work presented here is related to developments in LWIR digital holography in view of nondestructive testing of aeronautical composites in the frame of the European Union funded project FANTOM (Full-field advanced non- destructive testing technique for online thermo-mechanical measurement on aeronautical structures). We already showed
achievements of LWIR DHI[17] and comparison of different LWIR interferometric techniques and optimization of an
ESPI setup [18]. These works resulted in the development of a mobile ESPI head which included the CO
2 laser and a
thermographic camera based on a microbolometers array. We demonstrated that the use of such long infrared wavelengths allows working in nondestructive testing applications in industrial environment. In particular large composite structures were examined in hangar conditions[19]. The nondestructive testing of large structures in industrial
perturbated environments is a hot topic and various works propose alternative solutions to LWIR ESPI [19].
We will recall first the basic principle of digital holography and describe the combination of temperature and deformation measurement. Then we describe the set-up and present a series of applications, from the thermo-mechanical measurements on composites to defect detection performed on-site.
2. BASIC CONCEPT
Digital hologram or specklegram recording consists in illuminating an object with a laser and realize interference between the object and reference beams on a camera array. Their interference produces, at instant t and in every pixel( , )x y , an intensity pattern IH( , )x y given by
(
, ,)
(
, ,)
(
, ,)
2(
, , .) (
, ,)
cos(
(
, ,)
)
H R O R O
I x y t =I x y t +I x y t + I x y t I x y t φ x y t (1)
where IR
(
x y t and , ,)
IO(
x y t are respectively the intensities of the reference and object beams at the sensor level, , ,)
the phase φ(
x y t, ,)
=ϕR(
x y t, ,)
−
ϕO(
x y t, ,)
is the difference of ϕR(
x y t, ,)
and ϕO(
x y t, ,)
which are respectively the phases of the reference and object beams. We have omitted in (1) the contributions of incoherent noise sources and which would have added an intensity term on the right-hand side.When holographic recording is applied at thermal wavelengths, the total intensity pattern of the hologram can be expressed as the superposition of the interference pattern IH
(
x y t given by (1), and an incoherent thermal , ,)
background term ITh(
x y t : , ,)
( , , ) H( , , ) Th( , , )
I x y t =I x y t +I x y t (2)
Our aim is to obtain a simultaneous image of the object thermal background (so-called thermogram) and a recording of
the phase, moreover in every pixel( , )x y . In order to produce such a thermal image, we cannot use a lensless DH
recording configuration. Indeed the thermal background being incoherent, it cannot be reconstructed and propagated at an arbitrary distance through the usual DH reconstruction principle. Conversely, by using an image-plane holographic configuration, the image is focused optically by a lens onto the camera array. Such digital image-plane holography has
(a)
Thermal hologram /specklegram
1(x, y)
= ITh(X,Y) + Iy(X,Y)
(b)
(c)I Th (x Y)
Thermal image Interference pattern
X
(d)
II I I, II IIII'll
I I ILI X been compared to lensless classical DH[21]. In these imaging conditions the intensityTh
I represents the emitted radiation related to the temperature of the surface of the object which is imaged on the camera sensor array.
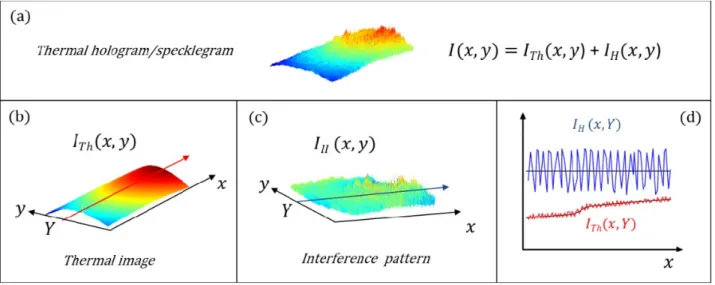
The combination principle is depicted in Figure 1: Figure 1(a) shows a typical simulated holographic pattern recorded at thermal wavelength, Figure 1(b) shows the thermogram that would be recorded if the thermographic camera was used without the laser. When the holographic part of the setup is used (i.e. the laser beam is present), the interference pattern is a high spatial frequency pattern represented in Figure 1(c). Figure 1(d) shows the profiles of both thermal and interference components on a line y=Y, respectively the red and blue plots.
Figure 1. Principle of combination: (a) hologram or specklegram recorded at thermal wavelengths, (b) thermal part of the former, (c) interference part of the former, (d) line profile along line y=Y
3. DEVELOPMENT OF THE INSTRUMENT
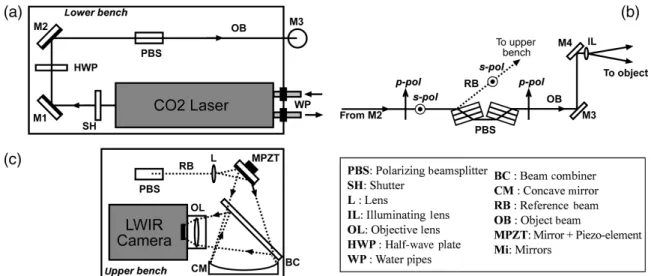
In addition to develop a technique which is able of simultaneous holographic and thermographic acquisition, the FANTOM project aimed at developing a mobile interferometer for nondestructive testing to be used in industrial premices, out of laboratories. At first the consortium focused on the interferometric part of the setup and on the development of a high resolution high end cooled thermographic camera to be used in the setup. The development of the interferometer has been presented already in several papers. Various techniques were considered and compared but only one was kept for building the mobile instrument. These techniques are the off-axis DHI with a frontal lens, the ESPI with phase-shifting and the shearography, which were investigated and compared in [18]. The best results were obtained by ESPI, despite some advantages of DHI which offers the possibility of single shot measurements and direct phase extraction, whereas ESPI requires 4 phase-shifted specklegram acquisitions. Although much simpler than the former, shearography was discarded. Indeed since it provides derivative of displacement and not displacements directly, we need spatially integrating interferograms, what could lead to errors. Observing the derivative of displacements is extremely interesting for flaw or damage detection, but for pure metrology of thermo-mechanical phenomena, ESPI is better suited. Also the LWIR shearography set-up is by far more cumbersome than its visible equivalent. Finally, LWIR shearography provides a double image of the object scene with transversal shear, both in holographic part and thermal part of the signal. Extracting the thermogram from the measurement would be a more difficult task due to this specificity of shearography, whereas in ESPI we have a single image directly. Figure 2, from (a) to (c), illustrates the big steps of this study.
(a) (c) To upper bench s -pol: 1 RB .® P Pol OB Upper bench PBS (b) M3 To object PBS: Polarizing beamsplitter SH: Shutter L : Lens
IL: Illuminating lens OL: Objective lens
HWP : Half -wave plate WP : Water pipes
BC : Beam combiner CM : Concave mirror RB : Reference beam
OB : Object beam
MPZT: Mirror + Piezo- element
Mi: Mirrors
(a; 4aboratm set-up
(b) Labor-atop/ compact prototype (c) mobile instrumentFigure 2. Various steps of the development of the set-up: (a) laboratory set-up, (b) compact prototype, (c) mobile instrument
The interferometric studies and developments were performed on the basis of an uncooled thermographic camera (Jenoptik Variocam hr, with 640x480 pixels). In parallel Infratec GmbH (FANTOM partner) developed a new cooled LWIR camera with a 640x512 MCT sensor (HAWK sensor from Selex Galileo). Such cooled IR sensor technology allow signal-to-noise ratio and frame rate higher than uncooled ones. Usually cooled cameras are used for thermography NDT and it was initially planned to incorporate such camera into the FANTOM instrument. However the cooling system is based on an active Stirling cooler which provokes small vibrations on the sensor. Although this is not a problem for pure thermography acquisition, we found that the small residual vibrations were still a problem for using it in our prototype, such as the one displayed in Figure 2(b). It was then decided to keep the uncooled camera for the remaining of the project. Nevertheless the new cooled camera (ImageIR 8300) has been used for active thermography in view of flaw detection in composites[22].
The compact prototype shown in Figure 2(b) was the necessary step for studying the main functionalities of the future instrument. Initially the laser was placed outside of the optical bench and its light was sent directly through mirrors. However this is not practical if one wishes a transportable set-up. Therefore we studied the possibility of using IR fibers. The hollow silica fibers technology proved to be efficient in transmission but the curvature radius smaller than 20 cm induced strong losses and damages the fiber cladding[19]. Consequently we discarded this possibility and moved to a
design which incorporates the CO2 laser onboard the instrument. The final mobile instrument is shown in Figure 2(c).
Figure 3 shows the scheme of principle of the instrument which is composed of a lower bench (Figure 3(a)) containing mainly the laser (Access Laser Co, model Merit S, 8 Watts) and reference/object beams separation assembly (Figure 3(b)), made by polarizing beamsplitter. The upper bench (Figure 3(c)) contains the beam combiner, the uncooled thermographic camera (Jenoptik Variocam hr, 640x480 pixels). More details on the different parts can be found in [19].
Figure 3. Scheme of principle of the mobile LWIR speckle interferometer: (a) lower bench, (b) separation of beams in the lower bench, and (c) upper bench.
100 95 90 85 80 75 70 7.0 Polarization P 12 11 10 9
g
8 8 0 6 Cl 5a 4
3 2 1 0 70 7.5 80 85 90 95 10.0 10.5 11.0 11.5 12.0 12.5 13.0 13.5 140 7.5 8.0 8.5 9.0 9.5 10.0 10.5 11.0 11.5 12.0 12.5 13.0 13.5 14.0 Wavelength (µm) S PNM
-.
1
-=11IM_
_
-,
-Wavelength (µm) (a) (b)
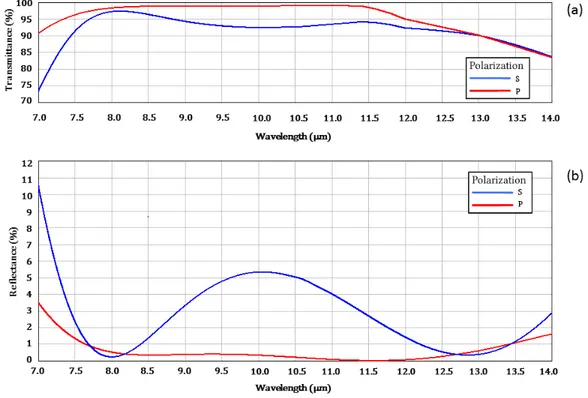
A particular attention has been paid on the design of the beam combiner (BC). One important requirement for the instrument was that the thermal background must not be disturbed, or the less possible, by the holographic part of the setup. With respect to this, the most problematic element is the beamsplitter used as BC. Indeed if we choose for example a beamsplitter with a reflectance of 50% and transmittance 50% (R50/T50) over the entire LWIR spectrum, this means that only half of the object thermal radiation will reach the camera. This in turn would strongly increase the uncertainty on the surface temperature measurement. For overcoming this, a specific BS had to be developed for the application. LWIR beamsplitters are made of coatings on ZnSe substrate. We specified the coating to be most transmitting over the LWIR spectrum and the less reflecting on the same extent, except for the laser wavelength, say around 10 µm. An ideal BC should have a 100% reflectance at the laser wavelength and 0 % elsewhere. The BC was built by II-VI Company and the most suitable coating that was obtained for us has the spectral properties shown in Figure 4 (these graphs are the computed values provided by the manufacturer, not actual measured ones).
Figure 4. Spectral properties of the beam combiner for s- and p-polarizations: (a) transmittance, (b) reflectance
Since the thermal background is not polarized, the global transmittance is a combination of both s and p ones and the loss will remain limited to a few percents. This impacts the infrared irradiance on the camera array, i.e. ITh
(
x y t , , ,)
hence the temperature measurement. Temperature measurement assumes a calibration process, e.g. by using a blackbody at a precise temperature. The camera has been calibrated in factory prior delivery. A proper calibration could have been performed with the BC. However we have not considered such recalibration here. Indeed in our nondestructive testing applications, only temperature variations are needed and not the actual temperature. Therefore we will not pay attention to the small transmittance loss which will be considered as almost constant between two close temperatures.,Ilthl} ,Ilt,/}
0000
010
time
4. DECOUPLING THE THERMAL AND HOLOGRAPHIC SIGNALS 4.1 Principle
One important step of the FANTOM project was the study of decoupling the two signals. The users generally require that the temperature variations and deformations are measured during a specific load and that both are provided in separate data sets. One important part of the work was then to find procedure(s) allowing a separation of the two components contained in the intensity (2) at several instants during loading of the object monitored. Therefore we need to compute, on the one hand, the difference of the thermograms ITh
(
x y t captured at different instants , , i)
t and, on the i other hand, the difference of phases φ(
x y t, , i)
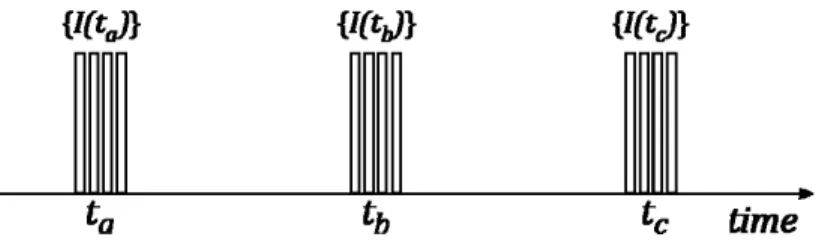
contained in the interference term of (1). The latter will lead us to consider quantification of phase methods, in particular the phase-shifting technique. In this section we present some procedures for separating the two signals.The separation method is based on the shifting. The phase of the object state can be calculated through the phase-shifting process [1] which is recalled hereafter. This situation is depicted in Figure 5. Let us call t , a t , b t ,… different c instants at which one wants to record the temperature and shape state of the evolving object. During the acquisition of the intensity patterns (2) the camera is synchronized with the piezo-element which moves the mirror MPZT in the reference beam and a sequence of n phase-shifted intensity patterns
{
I t( )
a}
is recorded at instant t , a second similar a sequence{
I t( )
b}
is recorded at instant t , and so on. The duration of one sequence is limited by the stepped movement b of the MPZT which is set to 100 ms per step, giving an overall duration of typically 400 ms, considering the 20 ms recording time for each frame.Figure 5. Typical temporal sequence of operations for simultaneous thermogram measurement.
In our case we apply the 4-bucket algorithm which consists of acquiring a set of four holograms/specklegrams with a π/2 phase shift between each acquisition. Let us suppose that neither the reference nor object beam intensities, resp. IR a, and
,
O a
I ,nor the thermogram ITh a, and the phase φa have varied during the sequence at time t . Omitting a
the( , )x y dependency for simplicity, we can write that the nth image of the sequence is:
, , , , , , ( ) 2 cos ( 1) 2 n a a n Th a R a O a R a O a a I t ≡I =I +I +I + I I
⎛
⎜
φ
+ n−π
⎞
⎟
⎝
⎠
(3)with n = 1,2,3,4. The phase is computed as [1]
(
) (
)
1 ,4 ,2 ,1 ,3 tan a Ia Ia Ia Ia φ = −⎡
− −⎤
⎣
⎦
(4)The determination of the thermogram ITh a, could be deduced by substituting the phase calculated by (4) into (3) and knowing one of the measurement Ia n, as well as preliminary recording of IR a, and IO a, . However a simpler way is to compute the sum of the 4 phase-shifted intensitiesIa,1,Ia,2,Ia,3and Ia,4 and it comes
(
)
, 1, 2, 3, 4, , ,1
.
4
Th a a a a a R a O a I=
I+
I+
I+
I−
I−
I (5)ITh(t
d
{I(ta)}
'nod
{Tb)}
I{I(td}
I
fl 0 fl flta
tb
tc
time
At a subsequent moment t a new sequence of 4 phase-shifted intensity patterns b
{
I t( )
b}
is captured. The phase φb can be computed similarly to φa.The quantity of interest in the displacement measurement application is the phase difference Δ =φ φa
−
φb which is related to the displacement d of each object point, imaged in each point of the camera( , )x y . This relationship is given by [1]:2
φ
π
λ
Δ = s.d
(6)
where the sensitivity vector defined by s=k1−k is determined by the geometry of the set-up, 2 k and 1 k are the unit 2
vectors of illumination and observation respectively. In our case, the object is globally perpendicular to the observation and illumination directions. As a result the displacement d is out-of-plane.
Similarily, we are interested in temperature difference which is simply obtained by
4 4 , , 1 1 1 4 Th i i a i i b R O I = I = I I I Δ =
⎡
⎣
∑
−∑
⎤
⎦
− Δ − Δ (7) where ΔIR=
IR a,−
IR b, and ΔIO=
IO a,−
IO b, .In practice we consider the case where the reference and object beams intensities have not varied (ΔIR
=
ΔIO=
0
), what simplifies the procedure in omitting preliminary recordings of separate beams intensities.4 4 , , 1 1 ( ) 1 4 i i a i i b r Th I = I = I Δ =
⎡
⎣
∑
−∑
⎤
⎦
(8)However if the intensities of the beams varies between t and a t , an error on b Δ , hence on temperature variation, will ITh occur. In order to avoid this, an alternative procedure can be followed and is explained hereafter.
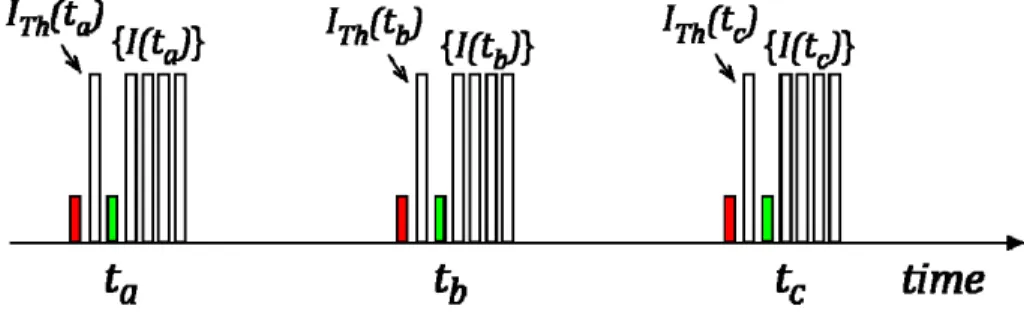
For cases where the phenomena observed are slow, we can consider the recording of a thermogram preliminarily to the recording of the interference pattern, as is shown in Figure 6 which represents the temporal sequence of operations. We need a shutter at the laser output which is closed prior to this preliminary acquisition (red rectangle). Then the thermogram ITh
( )
ta is captured (first white rectangle). Shortly after the shutter is opened (green rectangle) and asequence of 4 phase-shifted intensity patterns
{
I t( )
a}
is recorded. The duration of one sequence is typically 500 ms,considering the MPZT stepped movement, the duration of the different frames captures and the shutter operation.
Figure 6. Typical temporal sequence of operations for separate initial thermogram measurement.
At a subsequent moment t a new sequence of 4 phase-shifted intensity patterns b
{
I t( )
b}
is captured, with a preliminary thermogram recording ITh( )
tb as depicted in Figure 6. In this procedure, the temperature variation is simply obtained by subtracting the preliminary thermograms captured at the beginning of each sequence:( )
( )
( )p .
Th Th a Th b
I I t I t
We designate it by ΔITh( )p to not confuse it with (9), where ΔITh( )r is obtained by reconstruction from the phase-shifting
approach. The computing of (9) is much simpler than (8) and ( )p
Th I
Δ is not subject to potential errors related to the
assumption ΔIR =ΔIO = which led to (8). 0
In some of the next sections devoted to applications, we will present a series of phase maps Δφ( , )x y and temperature variations ΔITh( , )x y which were obtained when composite samples undergo thermal loads.
4.2 First demonstration
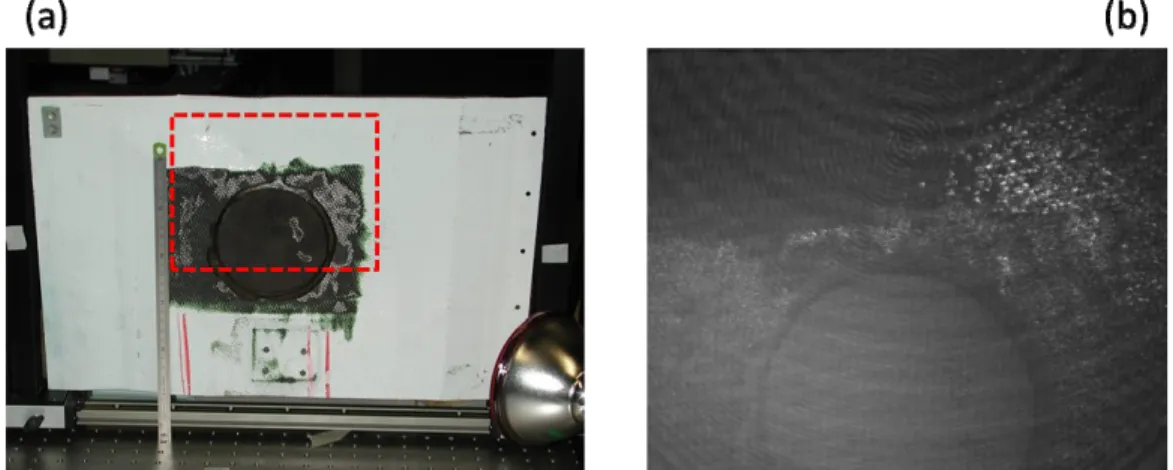
The first example uses a sample shown in Figure 7(a) and which consists of a helicopter panel constituted by sandwich made of honeycomb and carbon fiber reinforced polymer (CFRP) skins. The sample had a circular repair in its center and the zone observed (22 × 18 cm2) is marked by a rectangle in red dots. The sample was not covered with any scattering
removable powder, as is sometimes the case in holography. Indeed the roughness was sufficiently high and close to the wavelength that we were able to generate speckle from the surface itself, as is sometimes the case with CFRP composites[23]. A typical interference pattern between the reference and object beams is shown in Figure 7(b).
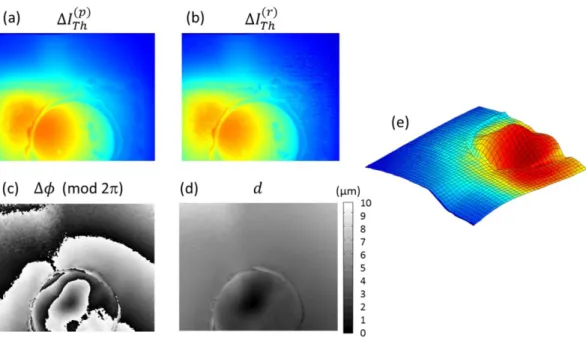
The sample is heated by a halogen lamp placed at a certain angle for not blocking the field-of-view, as shown in Figure 7(a). Figure 8(a) shows the temperature variation ΔITh( )p obtained by the alternative approach explained in the previous section (see Figure 6), while Figure 8(b) shows the temperature ΔITh( )r obtained by reconstructing the thermograms through the phase-shifting (see Figure 5). The blue color represents the lower temperature variations, whereas the red color represents the higher ones. Figure 8(c) shows the phase variation modulo 2π obtained by calculation of (4) for two different object states and computing the phase differenceΔφ. This allows obtaining the out-of-plane displacement d through (6) after phase unwrapping, as can be seen in Figure 8(d). Figure 8(e) shows a hybrid representation consisting of the 3D plot of the deformation which is colored with the temperature difference value obtained in each pixel. This example illustrates well the potentiality of our technique which allows obtaining both types of information in every pixel and simultaneously or quasi-simultaneously depending on the procedure followed.
It can be seen that some noise is present in the reconstructed thermograms ΔITh( )r , (Figure 8(b)). This noise looks like speckle and is probably due to the variation of laser beam irradiances during the phase-shifting process. For that reason we prefer the preliminary capture approach (Figure 8(a)) which provides better quality results. Nevertheless in this case we don’t have the perfect simultaneity between temperature and deformation.
Figure 7. (a) Sandwich panel with circular repair in the centre. The zone observed in marked by red dots. (b) Interference between reference and object beams.
(a)
1(P)
Th (c) AO (mod 2n) (b) AITh(r) (d) d (µm) 10 9 8 7 6 5 4 3 2 1 0Figure 8. (a) Temperature variation obtained by preliminary thermogram capture, (b) temperature variation obtained by reconstruction through the phase-shifting approach, (c) phase variation (modulo 2π), (d) grey level deformation map corresponding to (c), (e) hybrid representation of the deformation and temperature variation
The resolution in deformation measurements was already discussed in previous papers and we found typical values of 1
µm[14]. Concerning temperature, with the Jenoptik VarioCAM hr camera of our combined system, the manufacturer
announces a thermal resolution better than 30 mK and an accuracy of +/- 1.5 mK. In the case of the procedure with preliminary thermogram measurement (Figure 6), we consider that these are the performances of our system in term of temperature measurement capabilities, although affected by a few percent due to the beam combiner, as already mentioned. In terms of temperature variations measurement, we double these measurement errors since we have two measurements. By taking linear profiles in Figure 8(a) and Figure 8(b), we have found typical 5 % variations between both methods. However in the case of the temperature variation determination, we rely on ΔITh( )r which is affected by any potential variations of reference and object beam irradiances between two sequences (see Eq. 7) and which are difficult to predict.
5. APPLICATIONS IN NONDESTRUCTIVE TESTING 5.1 Measurements in mechanical testing facilities
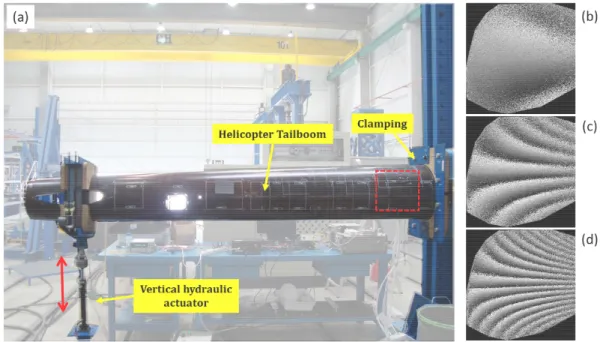
A series of demonstration tests were performed at the Centro de Tecnologías Aeronáuticas (CTA) situated in Miñano (Spain). Several structural testing facilities are running in large hangars and the thermo-mechanical behavior of aeronautics structures are analyzed under various loading conditions. They were presented in details in [19]. As an example, Figure 6 shows a test that was performed at CTA on a helicopter tailboom, typically 4 meters long and clamped at one side, while a vertical hydraulic actuator attached at the other side allowed displacing the free edge by a few centimeters. This test rig is placed in a large hangar with other test rigs working simultaneously to our experiments with operators around. Our instrument was placed in such a way to observe the area surrounded by the red dot lines close to the clamping point. It must be mentioned that Figure 9(a) shows the convex external part of the specimen while we observed this zone from the internal concave side.
Figure 9(b) to (d) show phase maps obtained the loading of the tailboom at different instants of a load cycle. While the mechanical solicitation is applied mainly vertically the important curvature of the tailboom induces strong out-of-plane
deformation close to the clamping zone. In the figures the clamping is located on the left-hand side of the pictures and far on the right (out of the observed field) is located the actuator. We have not compared these measurements with other techniques. Also no thermal variation was observable because they are probably too small compared to the temperature resolution of our camera. However the aim of this experiment was to analyze the ability of the detector to provide exploitable interferograms during measurement campaign in field conditions and, in that sense, it was considered successful.
Figure 9. (a) Test rig for mechanical actuation of a helicopter tailboom, (b)-(d) Phase maps showing the of the tailboom deformation at different instants during a load cycle.
5.2 Thermo-mechanical measurements on composites
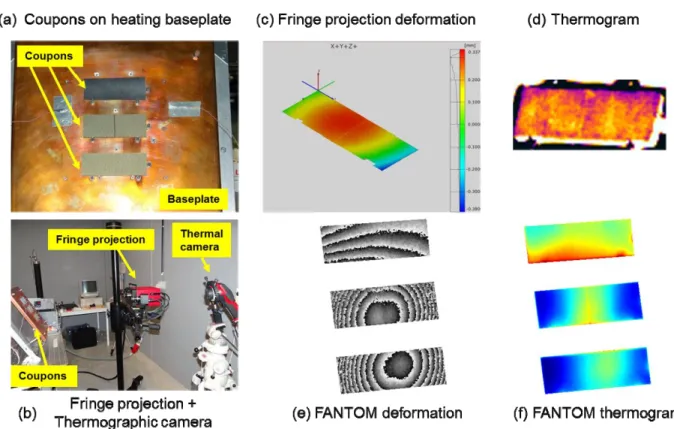
The following example shows the advantage of the combined system with respect to separate thermal and deformation measurements. The application consists of measuring the deformation of three CFRP coupons which are heated at gradually increasing temperature steps. One coupon is made only of CFRP, both others have an additional metallic layer. The coupons are set on a Copper baseplate (Figure 10(a)) which can be heated from ambient temperature up to 150°C. The heat is transferred to the sample mainly by conduction. Conducting grease is also applied to improve contact and help further conduction. Such high temperatures usually prevent performing holographic or speckle interferometry in the visible, due to the air turbulences. In LWIR we are less sensitive to displacements measured, as well as perturbations of the environment. For further limiting the effect of turbulences, the baseplate is set almost vertically (Figure 10(b)) and the coupons are kept in place on the baseplate by two screws on which they are simply in contact. The coupons are allowed to expand freely under the effect of heating. Contrarily to the previous example, the coupons and the baseplate were sprayed with a removable scattering powder (not shown on the figure). Indeed the baseplate was highly specular, which could cause potential damages to the microbolometer array from back reflections of the laser illumination[14]. This
experiment was requested by an industrial composite manufacturer who required measurement of deformation by dimensional measurement (by fringe projection) and local temperature (by thermocouples) at different temperature steps. This was the ideal case to test the interest of our combined technique. Figure 10(b) shows the dimensional measurement system which is the ATOS sensor manufactured by the company GOM. It allows measuring the coordinate of surface points with an out-of-plane resolution here of 10 µm (depends on the volume measured), while our technique has a typical 1 µm resolution[14] (one tenth of the wavelength). A calibration of the temperature measurement on the sample
was made in a preliminary experiment, by thermocouples. We added a counter-measurement with thermographic camera, which allowed observing the temperature homogeneity of the sample. The additional thermographic camera is a FLIR Infracam (based on microbolometer array with 120 × 120 pixels) and it is shown in Figure 10(b).
444.
OOPCoupons
F11rige projection Therrriograpi'ti+C camera
TAM
(e) FAN TOFdf. deformation FANTOM ram Figure 10(c) is the out-of-plane deformation computed by the GOM ATOS software, after capture of the coordinates of surface points at two different temperatures. The amplitude of deformation is coded in color. Figure 10(d) shows the full-field temperature of a coupon obtained with the FLIR Infracam camera. Both systems have their own characteristics (magnification, lateral resolution,…), they observe the same scene at different viewing angles, and data formats are different. In order to correlate both types of data, complicated data fusion is needed. Figure 10(e) and Figure 10(f) show respectively the phase maps (modulo 2π) and temperature variations obtained by our combined technique on the three coupons, where the baseplate has been masked out.
It can be easily seen from this example the gain of the combined technique in term of correlation both in space and time of the deformation and temperature variation measurements. Moreover only one measurement system has to be set up instead of two.
Figure 10. (a) Heating baseplate with three coupons, (b) Setup with separate measurement techniques for deformation through dimensional measurement by fringe projection and temperature by thermographic camera, (c) Deformation measurement by fringe projection, (d) temperature measurement by separate thermographic camera, (e) phase map showing deformation of the three coupons (baseplate is masked), (f) simultaneous temperature variation.
5.3 Nondestructive inspection of large composite structures in field conditions
For demonstrating the advantages of the lower sensitivity of LWIR ESPI, we have tested it in the facilities of a leading aircraft manufacturer. Figure 11(a) shows the mobile FANTOM system in inspection position in front of a large composite fuselage with the inspection area covered with removable white powder to allow backscattering into the camera, necessary for ESPI. It must be noted that we have shown that carbon fiber based composites do not usually need this powder, because of their sufficient roughness to provide speckle at this wavelength [23]. However the powder was
used here because of the presence of metallic inserts which can produce back reflections. We have already discussed that the latter can be dangerous for the microbolometers array of the camera [14]. We have investigated and successfully
detected defects on composite structures in the presence of air conditioning fans, air disturbances due to the frequent opening and closing of the hangar door, as well as usual traffic and activities in industrial plants. The quality of the interferences observed where slightly decreased, but they were still good enough for defect detection, as can be seen at
° ^ ' u °~~ ~
911111111111111117
Figure 11(b), while Figure 11(c) shows the difference in temperature field at the same time of interferogram observation. In this example, the defect (surrounded in red) is clearly visible in both the deformation and the temperature variation.
Figure 11. Observation of a delamination in CFRP structure in workshop condition with the FANTOM system. (a) the instrument in typical working position in the testing facility, (b) Phase difference image showing the deformation, (c) Thermal difference image.
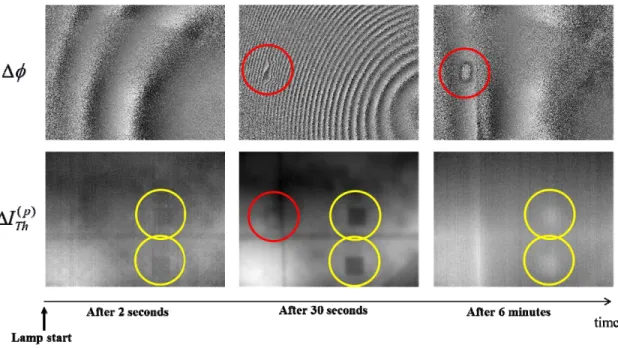
Another zone was inspected and showed the interesting result which is illustrated in Figure 12. A halogen lamp heated an area containing several defects at different depths. A reference state was recorded before the lamp starts. The figure displays the variation after 3 instants as indicated. The top line shows 3 phase maps and the bottom line shows the temperature variation taken from the same image and after the separation of signals explained previously. From this example, it is clear that some defects are easily detected by ESPI (surrounded in red) and other ones only by thermography (surrounded in yellow). From this example it can be concluded that the FANTOM technique can be used for an improved probability of detecting defects.
Figure 12. Series of time interferograms and thermograms showing the complementarity between thermography and ESPI for detecting different defects
6. CONCLUSIONS AND PERSPECTIVES
In this paper, we have presented a new technique consisting of long wave infrared ESPI using CO2 laser emitting at 10
µm and a microbolometer array camera sensitive in the 8-14 µm range. The interference pattern (specklegram) recorded by the infrared camera is affected advantageously by an uncoherent background coming from the thermal radiation of the observed object. This makes possible the simultaneous capture of two types of information, related to shape and temperature of the object. Therefore it is possible to deduce the deformation and temperature variations of objects when the latter is undergoing a deformation which is accompanied by temperature change. This was the central idea of the European funded FANTOM project. We have presented the main development steps of the instrument which led to a mobile speckle interferometer that can be used outside laboratory. We have also discussed various procedures for decoupling the thermal information from the holographic information contained in interferograms.
We have presented a series of applications in nondestructive testing experiments. A first one was the measurement of large deformation during mechanical tests in structural tests facility. A second one was the thermo-mechanical assessment of composite coupons which allow seeing the interest have simultaneous capture of, one the one hand phase map for deformation metrology, and, on the other side, temperature variations. At last, we have shown an application in the hangar of a major aircraft manufacturer, where the system was used in industrial working conditions for defect detection on a large composite fuselage. It was demonstrated that some defects are observed by one technique and not necessarily the other one, and vice versa. At the end we have improved the probability of detecting defects by this natural data fusion between holography and thermography.
Currently we investigate the technique in other applications. One of them is the possibility of vibration analysis in which large displacements are observed [24]. Also the possibility of observing temperature variations during vibrations will be
analyzed, mainly in the case of fatigue tests.
All these experiments prove that holographic/speckle techniques at such long wavelengths can be exported outside laboratory and lead to unique features in a wide variety of applications. In the future, the system could gain in compactness if new fibered laser sources like Quantum Cascade Laser are used[25].
ACKNOWLEDGEMENTS
This work was funded by the FP7 European project FANTOM (ACP7-GA-2008-213457). The author would like to greatly thank the different partners of the project who have substantially contributed to the results presented in the paper: Dr Igor Alexeenko, Dr Giancarlo Pedrini and Prof Wolfgang Osten of the Institute für Technische Optik of Universität Stuttgart (Germany), Dr Jean-François Vandenrijt and Cédric Thizy of the Centre Spatial de Liège of Université de Liège (Belgium), who mainly studied various interferometric techniques and the decoupling algorithm; Dr Birgit Vollheim and her team of company InfraTec GmbH in Dresden (Germany) who developed a new cooled thermographic camera and provided expertise in thermography necessary for the combination; Iagoba Jorge and Ion Lopez and their team at Centro de Tecnologias Aeronauticas of Miñano (Spain) who defined and contributed in the different testing activities and developed reference samples for supporting the study, Jonathan Rochet from company Optrion in Liege (Belgium) who designed and built the mobile setup and, finally, Jan Depauw of InnovSupport company from dissemination activities. As coordinator of the FANTOM project, the author would also like to thank Pablo Perez-Illaña of the European Commission, who followed the project both critically and enthusiastically.
REFERENCES
[1] Kreis, T., [Handbook of Holographic Interferometry: Optical and Digital Methods], Wiley-VCH Verlag GmbH | Co. KGaA, Weinheim (2005).
[2] Maldague, X., [Theory and Practice of Infrared Technology for Nondestructive Testing], Wiley-Interscience (2001). [3] Burleigh, D., "Portable combined thermography/shearography NDT system for inspecting large composite
[4] Feligiotti, M., Hack, E., Lampeas, G., Siebert, T., Pipino, A., and Ihle, A., "Assessment of impact damage in CFRP by combined thermal and speckle methods,” Proc. SPIE 7387, 73870H (2010).
[5] Sfarra, S., Ibarra-Castanedo, C., Santulli, C., Sarasini, F., Ambrosini, D., Paoletti, D., and Maldague, X., "Eco-friendly laminates: From the indentation to non-destructive evaluation by optical and infrared monitoring techniques,” Strain 49, 175-189 (2013).
[6] Sfarra, S., Theodorakeas, P., Ibarra-Castanedo, C., Avdelidis, N.P., Paoletti, D., Hrissagis, K., Bendada, A., Koui, M., and Maldague, X., "Evaluation of defects in panel paintings using infrared, optical and ultrasonic techniques,” Insight: Non-Destructive Testing and Condition Monitoring 54(1), 21-27 (2012).
[7] Georges, M.P., Vandenrijt, J.-F., Thizy, C., Stockman, Y., Queeckers, P., Dubois, F., and Doyle, D., “Digital
holographic interferometry with CO2 lasers and diffuse illumination applied to large space reflector metrology
[invited]," Appl. Opt.52 (1), A102-A116 (2013).
[8] Løkberg, O.J., and Kwon, O., “Electronic speckle pattern interferometry using a CO2 laser,” Opt. Las. Tech.,
187-192 (1984).
[9] Allaria, E., Brugioni, S., De Nicola, S., Ferraro, P., Grilli, S., and Meucci, R., “Digital holography at 10.6 µm,” Opt. Comm. 215, 257-262 (2003).
[10] Paturzo, M., Pelagotti, A., Finizio, A., Miccio, L., Locatelli, M., Gertrude, A., Poggi, P., Meucci, R., and Ferraro, P., "Optical reconstruction of digital holograms recorded at 10.6 μm: route for 3D imaging at long infrared wavelengths," Opt. Lett. 35, 2112-2114 (2010).
[11] Locatelli, M., Pugliese, E., Paturzo, M., Bianco, V., Finizio, A., Pelagotti, A., Poggi, P., Miccio, L., Meucci, R., and Ferraro, P., “Imaging live humans through smoke and flames using far-infrared digital holography,” Opt. Exp.
21(5), 5379-5390 (2013).
[12] Georges, M., "Long-Wave Infrared Digital Holography," in New Techniques in Digital Holography (ed P. Picart), John Wiley & Sons, Inc., Hoboken, NJ, USA, (2015)
[13] Vandenrijt, J.-F., and Georges, M., “Infrared electronic speckle pattern interferometry at 10 µm,” Proc. SPIE 6616, 66162Q (2007).
[14] Vandenrijt, J.-F., and Georges, M.P., “Electronic speckle patter interferometry with microbolometer arrays at 10.6 µm,” Appl. Opt. 49, 5067-5075 (2010).
[15] Vandenrijt, J.-F., Thizy, C., Queeckers, P., Dubois, F., Doyle, D., and Georges, M.P., "Long-wave infrared digital holographic interferometry with diffuser or point source illuminations for measuring deformations of aspheric mirrors,” Opt. Eng. 53(11), 112309 (2014).
[16] Georges, M.P., Vandenrijt, J.-F., Thizy, C., Stockman, Y., Queeckers, P., Dubois, F., and Doyle, D., "Digital holographic interferometry with CO2 laser applied to aspheric space reflector testing," in Digital Holography and Three-Dimensional Imaging, OSA Technical Digest (online) (Optical Society of America, 2013), DW3A.4.
[17] Alexeenko, I., Vandenrijt, J.-F., Georges, M.P., Pedrini, G., Cédric, T., Osten, W. and Vollheim, B., “Digital
holographic interferometry by using long wave infrared radiation (CO2 laser),” Applied Mechanics and Materials
24-25, 147-152 (2010).
[18] Alexeenko, I., Vandenrijt, J.-F., Pedrini, G., Thizy, C., Vollheim, B., Osten, W., and Georges, M.P., “Nondestructive testing by using long-wave infrared interferometric techniques with CO2 lasers and microbolometer
arrays," Appl. Opt. 52(1), A56-A67 (2013).
[19] Vandenrijt, J.-F., Thizy, C., Alexeenko, I., Pedrini, G., Rochet, J., Vollheim, B., Jorge, I., Venegas, P., Lopez, I., Osten, W., and Georges, M.P., "Mobile speckle interferometer in the long-wave infrared for aeronautical nondestructive testing in field conditions," Opt. Eng. 52(10), 101903 (2013).
[20] De la Torre Ibarra, M.H., Flores Moreno, J.M., Aguayo, D.D., del Socorro Hernandez-Montes, M., Perez-Lopez, C., and Mendoza-Santoyo, F., “Displacement measurements over a square meter area using digital holographic interferometry,” Opt. Eng. 53(9), 092009 (2014).
[21] Karray, M., Slangen, P., and Picart, P., “Comparison between digital Fresnel holography and digital image-plane holography: the role of imaging aperture,” Exp. Mech. 52(9), 1275-1286 (2012).
[22] Jorge, I., Venegas, P., Vega, L., Lopez, I., Vollheim, B., Krausz, L., & Georges, M., "Review of thermal imaging systems in composite defect detection", Infrared Physics & Technology 61, 167-175 (2013)
[23] Vandenrijt, J.-F., Thizy, C., Alexeenko, I., Jorge, I., Lopez, I., De Ocariz, I.S., Pedrini, G., Osten, W., and Georges, M., “Electronic speckle pattern interferometry at long infrared wavelengths. Scattering requirements,” in Fringe 2009- 6th International Workshop on Advanced Optical Metrology, 596-599 (2009).
[24] Vandenrijt, J.-F., Thizy, C., and Georges, M., "Vibration analysis by speckle interferometry with CO2 lasers and
[25] Ravaro, M., Locatelli, M., Pugliese, E., Di Leo, I., Siciliani de Cumis, M., D’Amato, F., Poggi, P., Meucci, R., Ferraro, P., De Natale, P., "Mid-infrared digital holography and holographic interferometry with a tunable quantum cascade laser," Optics Letters 39 (16), 4843-4846 (2014)