Rural Communities on the Cambodian Central Plain:
A Comparative Analysis Based on Five Communes
Jean-Christophe Diepart1, Dr. Thomas Dogot2, Ly Viboth3, Loeung Chanthy4 and Bora Kathy5T
Bibliographic note: Diepart, J.C., Dogot, T., Ly V., Loeung C., Bora K, (2006). Rural Communities in the Cambodian Central Plain, a comparative analysis from five communes, in Dufumier, M., Ed., The Agriculture in Southeast Asia: An Update, Special Issue No 9-10, Moussons, Social Sciences Research on Southeast Asia, CNRS-University of Aix-en-Provence, Paris-Aix, Edisud, pp. 325 – 354.
1. Introduction
1.1 Rural development in Cambodia in transition
With nearly 85 percent of its population living in rural communities, it is obvious that rural development issues occupy a prominent place in the overall development of Cambodia. As the country’s population rapidly increases, people in rural areas depend upon agriculture as their means of subsistence. In parallel, agriculture must meet the growing and diversifying urban food demand, while generating resources for export. The complex problems and uncertainties faced by rural communities are therefore a key focus in the dynamics of national development and in Cambodia’s integration into Southeast Asia.
Following the civil war that raged from 1970 to 1975 and the Democratic Kampuchea regime that held power from 1975 to 1979 (identified hereinafter by the acronym DK), Cambodia adopted a Vietnamese style of socialism as a means of reviving the national economy, with emphasis placed on productive structures in the sectors of agriculture and industry. In the area of agriculture, it can be objectively stated that the constraints linked to reactivating the
1,2
Department of Economics and Rural Development, University Faculty of Agricultural Sciences, Gembloux, Belgium
3,4
Department of Biology, Royal University of Phnom Penh, Cambodia
5
country were very serious, and the collective structures (Krom Samakis) set up from 1979 onward by the People’s Republic of Kampuchea (PRK) to cope with the challenges of national reconstruction were generally justified from an ethical and socio-economic point of view. Nevertheless, conscious of the trauma endured by the people during the years of Democratic Kampuchea, the PRK leaders opted for a non-invasive collectivization of agricultural land and from the outset recognized the family unit as a pillar of the national economy.
In 1989, the weight of the international political context, a revamping of regional alliances and resistance on the part of Khmer farmers to these new arrangements led the country’s leaders to acknowledge the failure of the collectivist system and to advocate the merits of private ownership and free enterprise. Nevertheless, by then, Cambodia was already experimenting with certain forms of markets due to the fact that starting in 1980 the economy had become polarized between a national State-run sector based on a socialist modernization project and a more informal private sector that allowed households to market some of their field and animal produce. The sector actually became quite prosperous in zones where the economic potential was high.
In the early 1990s, the country moved into a crucial phase of development as it began what can be called its “transition into a market economy.” Overall, this transition was in keeping with a modernization vision that aimed to integrate the country into a healthy development cycle in which enhanced production and productivity would contribute to improved social well being. In this regard, the transition period in Cambodia, international development standards advocated by international organizations were invariably looked to as a benchmark. The more or less urgent recommendations from this source came to influence basically all areas of rural life—conditions for organizing agricultural production, strategies to enhance soil productivity, structures for marketing inputs and products, central and local levels of government, as well as land ownership institutions.
However, the Cambodian context is very unique and this has made the transition period also very unique in its own way. A number of paramount considerations are to be highlighted in this regard:
− The social upheaval caused by the civil war and DK regime resulted in social and psychological trauma hitherto never experienced by the people, and triggered a demographic imbalance that is still directly impacting the country’s labor force today;
− The gradual break up of the PRK collectives has taken place at a very slow pace, and this situation has allowed many current leaders at different levels of authority to hold on to a number of privileges;
− The new institutional provisions are encouraging a form of decentralization in which some areas of central government authority are being transferred to regional levels, but the technical terms and conditions for this transfer of jurisdictions (i.e. financial decentralization) have not yet been clearly established;
− The reemergence of markets for produce and agro-inputs has enabled a fairly significant fringe of Khmer farmers to find supply sources and outlets for their outputs. Yet such markets remain segmented and are governed by commercial go-betweens who occupy a strategic position in rural communities;
− The reappearance of traditional socio-economic practices that characterized the pre-collectivist era, such as loan sharking, along favoritism and cronyism in many forms, are also commonly seen in the transformations taking place (Kim S., 2002; Legderwood J, 2003).
Given these considerations, it is obvious that the transition to a market economy in rural communities cannot be envisioned in an exclusively economic framework, one which would
divorce the structural changes of agrarian economics from the institutional changes taking place in society as a whole.
1.2 Research background and objectives
In the framework of project initiative undertaken by francophone universities in Belgium, a rural development research and training project was initiated in 1999 by the Royal University of Phnom Penh and the Royal University of Agriculture, in partnership with the Gembloux University Faculty of Agricultural Sciences (Faculté Universitaire des Sciences
Agronomiques de Gembloux) and the Catholic University of Leuven, with the intention of
setting up a semi-permanent observatory involving a number of rural community realities in Cambodia today.
This article aims to make a contribution to the study of the farmer society in the specific context of agriculture in transition. Its purpose is to characterize the variability of production and replication conditions in Cambodian farmer families in various agro-ecological zones on the central plain. This identification of farming approaches and strategies is intended to input the formulation of rural development policies in Cambodia. In a comparative perspective of agro-ecological zones, we have the following specific aims:
1. To understand the modes of access to and use of agricultural and non-agricultural resources in rural communities as well as their distribution among households. 2. To focus especially on ways in which farmer families coordinate with the product
and input markets.
3. To identify how such modes of access to and use of resources initiate or reinforce the dynamics of social differentiation.
2. General methodology
2.1 Agro-ecological zoning and selection of the study zones
The semi-permanent observatory was designed and set up to include the broad agro-ecological diversity of the central plain. This ambition itself rests on the basic assumption that the prevailing local agro-ecological conditions have a strong influence on farming strategies. Firstly, zoning out of the central plain based on agro-ecological factors made it possible to juxtapose various cartographic strata, highlighting topographical, hydrographic and pedological elements. The Geographic Information System and its cartographic representation was then enhanced by analysis of the key agrarian systems on the central plain. For each zone identified, one representative province was selected (see figure 1).
Ecological zones Agricultural features
Selected representative provinces Lowland plains Mekong River lowlands
Wet season rice, irrigated rice and flood recession rice (rice growing specialization)
Takeo
Tonle Sap Lake lowlands
Rain-fed rice, deep water or floating rice, water buffalo husbandry
forests and pastureland fishing Kampong Thom Highland plains Former alluvial terraces of the Mekong
Wet season rice
market gardening and agricultural diversification (sugar palm) cattle husbandry
Kampong Speu
Rivers
Complexes of banks and
backland
Diversified agricultural systems
(chamcar mixed farming) Kampong Cham Uplands Low basaltic
uplands
Diversified agricultural systems and industrial crops
Figure 1. Agro-ecological zoning of the Cambodian central plain
A cluster sampling was then taken successively from the province to the commune. To ensure consistency, the choice of administrative subunits (districts and communes) was based on the same criteria that were used in selecting the provinces. Within the communes, the household was used as the preferred observation unit for the quantitative and qualitative diagnostic phase. This approach took the form of a socio-economic survey yielding quantified data that
could be analyzed statistically and enable conclusions to be drawn that fell within specified confidence limits. Based on counts made by all village chiefs in the commune, a simple random selection of 15 percent of households was used in each village in the selected communes. A database of 1,443 households was thus established (see figure 2).
Figure 2. Representation of the study zones on the Cambodian central plain
2.2
A conceptual analytical framework
A conceptual model was built in order to represent a rural household in Cambodia as an open system that ends with agricultural and non-agricultural production, partially directed towards agro-input and produce markets. This model has the advantage of revealing the means by which the households are linked to the markets, as both suppliers and consumers of products or labor. It also attempts to integrate a vital feature of farmer households, i.e. they are “production/consumption units as well as replication units of the family work force on both a daily and generational basis.” (Deere C. and de Janvry A., 1979).
With regard to internal dynamics, four key processes characterize the way production systems operate: management of agro-inputs, processes of agricultural and non-agriculture production, replication processes (financial, demographic and nutritional) and processes of differentiation that take place among farmer households. Indeed, the fast-track exposure of farmers to markets after a period during which their roles were considerably stifled is not without meaning in farmer societies as a whole. The very aggravation of differences among farmers stands out as the key feature in the transformations now taking place (Haubert M., 1997). This differentiation is itself reinforced by the fact that the replication conditions of Cambodia’s farmer society depend increasingly on factors that are beyond its control.
3. The agro-input management system
3.1 Socio-demographic dynamics in perspective
All communities in the five communes are characterized by three demographic features that are typical of Cambodia (Desbarat J., 1995): an exceptionally young population resulting from the very high birth rate of the 1980s, a major imbalance tilting the « sex ratio » in favor of women and a reduced population for the 25 to 30-year-old group due to the events of the years 1974–1979 (drop in the birth rate and absolute drop in the male population).
Furthermore, the fall of Democratic Kampuchea prompted a long process of family migrations throughout the country. To the extent that most of these migrations involved families going back to their home villages, it is quite important to understand this in order to grasp the local development dynamics. In this regard, a significant number of households in all the communes studied returned to their villages in 1979, which shows that the migration effect spared no one. In Kampong Cham, a larger proportion of households stayed put despite the population shifts ordered by the leaders of Democratic Kampuchea. This substantiates what historians have stated, namely that life in the “eastern zone” was less demanding than elsewhere during the Khmer Rouge regime (Kiernan B., 1996; Vickery M., 1984).
The demographic upheavals caused by the conflicts of the 1970s and 80s have had major side effects on many rural families. The outright population drop from 1970 to 1979 and the conflicts of the 1980s were particularly damaging as far as the male population is concerned.
The effects of this demographic upheaval are still having a major impact, even now, as is apparent from the fact that 17 percent of households are headed by widowed mothers who are quite often marginalized in their home villages. All five communes are confronted with this problem.
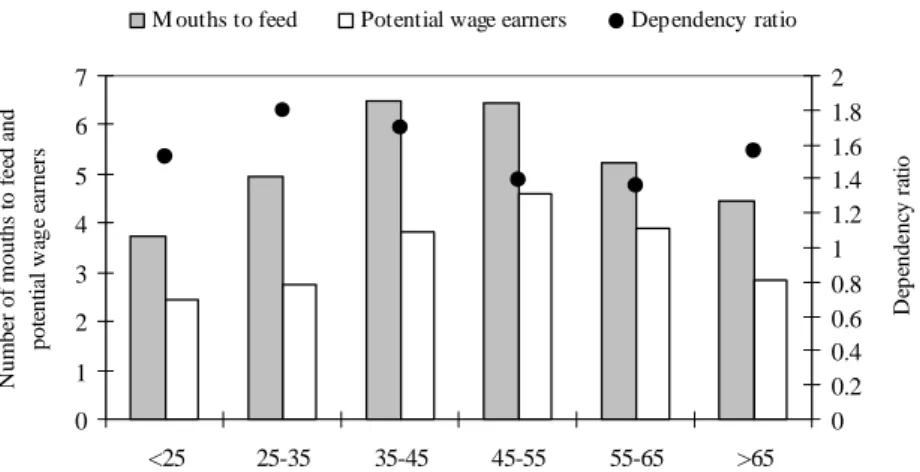
3.2 Ratio of dependency and demographic differentiation
Figure 3 outlines the relationship between the food dependency of the households (number of
mouths to feed / number of potential members in the labor force) and age categories for heads
of households. It highlights a fundamental element in the dynamics of rural households in Cambodia, namely the demographic differentiation linked to the life cycle of the household. During the first years of its life cycle, the size of the household grows in parallel with the number of births, thus bringing the average consumption level and food dependency ratio up to a maximum point observed for households wherein the head is between 25 and 35 years of age. Thereafter, the children contribute more to the household labor force, thereby reducing the dependency ratio. The adult children eventually move into a pattern of independent living as they establish their own households and set up their own farming operations. This reduces the parental household labor force and brings the dependency ratio back up. This Chayanovian demographic differentiation process was observed in the five communes, but it is more pronounced in zones where subsistence economy is more prevalent. Where production systems are to a greater extent driven by market forces, where there is less land available, or where greater opportunities exist for non-agricultural work, other mechanisms become the basis on which the differentiation dynamics operate.
0 1 2 3 4 5 6 7 <25 25-35 35-45 45-55 55-65 >65 Age categories for heads of households (years)
N u m b er of mout hs t o f ee d a nd p o ten ti al w ag e ea rn er s 0 0.2 0.4 0.6 0.8 1 1.2 1.4 1.6 1.8 2 D ep ende nc y r at io
M ouths to feed Potential wage earners Dependency ratio
Figure 3. Changes in the dependency ratio per household based on age of head of household
3.3 Land structures
3.3.1 Demographic pressure and land concentration
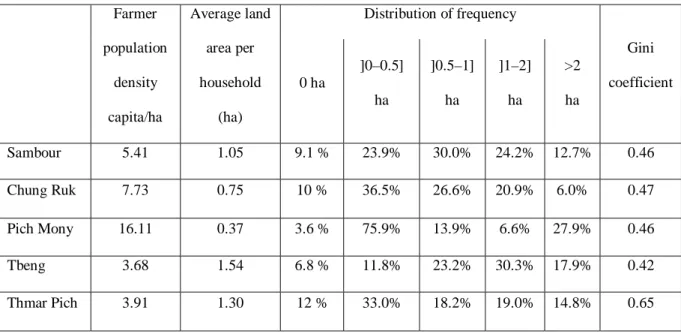
In Cambodia, the average farming area per household is small, although it varies considerably from commune to commune depending on demographic pressure on the land (see figure 4). At an average rate of 0.37 ha/household for Pich Mony commune (Kampong Speu), the average land area per household reaches 1.54 ha in Tbeng commune, Kampong Thom. However, although the demographic weight has a direct impact on the average farmland area per commune, it does not alone explain the tremendous heterogeneity of land distribution among the households. To fine-tune the study of land structures, two phenomena merit particular attention.
The first is the development of a large class of landless farmers (from 3.6 to 12 percent of households depending on the area). Some observers predict that the problem could even become critical in Cambodia (Biddulph R., 2000). The issue of landless farmers has specific causes relating to the current context of a market-driven agrarian transition. Our findings show that the rate of landless farmers is not a function of demographic pressure on land. The highest incidence of “landlessness” is in Thmar Pich and Chung Ruk, where land availability
is not the lowest. There is, therefore, no significant link between limited availability of land and the incidence of the process. The phenomenon is more frequent in provinces where land is in greater demand (and where agriculture has a greater commercial orientation), as well as in zones where there are more job opportunities outside of agriculture.
Figure 4. Land structures in the five communes studied
The second phenomenon to be highlighted is the high level of land concentration noted in the five communes (see figure 4). The process takes on greater proportions and the average population growth rate of 2.4 percent (NIS, 1999) could actually be a factor conducive to this incidence. Obviously, this is a major problem in contemporary Cambodia. Gini coefficients, mathematical interpretations of the Lorenz concentration curves, show high values for all of the communes. The phenomenon does not spare any zone, but when we take a close look, the generative power of this differentiation is particularly difficult to explain.
Farmer population density capita/ha Average land area per household (ha) Distribution of frequency Gini coefficient 0 ha ]0–0.5] ha ]0.5–1] ha ]1–2] ha >2 ha Sambour 5.41 1.05 9.1 % 23.9% 30.0% 24.2% 12.7% 0.46 Chung Ruk 7.73 0.75 10 % 36.5% 26.6% 20.9% 6.0% 0.47 Pich Mony 16.11 0.37 3.6 % 75.9% 13.9% 6.6% 27.9% 0.46 Tbeng 3.68 1.54 6.8 % 11.8% 23.2% 30.3% 17.9% 0.42 Thmar Pich 3.91 1.30 12 % 33.0% 18.2% 19.0% 14.8% 0.65
3.3.2 Ways in which land is acquired
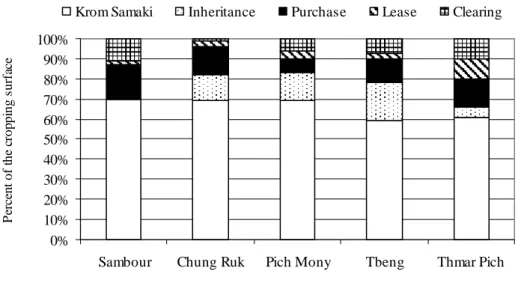
There are many ways in which people acquire land in Cambodia. Five methods of achieving land ownership have been noted: distribution of land from the Krom Samakis6 (collectives put in place by the People’s Republic of Kampuchea), inheritance, the land market represented by purchases, leasing of land and, finally, deforestation. Figure 5 shows that the pattern of land acquisition is similar from commune to commune. The majority of land available to families comes from the Krom Samakis7(between 69 and 59 percent). Inheritance and purchase of land also make up two widely observed means of acquisition. Land acquisition through clearing varies according to the geographic location of the commune and the forest area available within it. Finally, although very dynamic, leasing is the fifth means of land acquisition.
0% 10% 20% 30% 40% 50% 60% 70% 80% 90% 100%
Sambour Chung Ruk Pich Mony Tbeng Thmar Pich
P er ce n t of t h e c rop pi ng su rf ac e
Krom Samaki Inheritance Purchase Lease Clearing
Figure 5. Comparison of land acquisition methods
3.3.3 Distribution of Krom Samaki land
A large majority of households received their land base at the time when Krom Samaki land was distributed during the 1980s. Officially, the de-collectivization of agriculture was enacted in 1989, but in reality, the distribution of land in the villages had already been taking place on
6
The policy of Krom Samakis (solidarity groups) was to put between 10 and 15 households together in a production group in which the means of production were used collectively and work was salaried according to the hours of labor provided by its members. Each Krom belonged to a village (Phum), which was part of a commune (Khum). In fact, three levels of Krom Samakis existed depending on their degree of collectivization. These collectives were officially dismantled in 1989.
7
For Sambour commune, the database does not make a distinction between land acquired through the distribution of Krom Samakis and land acquired through inheritance.
its own for several years. Based on a principle of distributive justice, the terms and conditions for land distribution aimed to provide families with a land area proportionate to their labor force (an equivalent surface area for each potential labor force participant). Each Krom chief also was supposed to ensure that the different types of land (fields close to the village, rice paddies, hill land, irrigated land, fields on which dry season crops could be grown and fields suitable for industrial crops) were distributed fairly among the Krom households. But in fact, during the period of confusion that ensued after the fall of the Khmer Rouge regime and the gradual setting up of the Krom Samakis, many households had re-appropriated de facto the means of animal draft power that they had had during the pre-collectivist period and maintained use of it. When the land was redistributed, a draft team was generally the equivalent of a complete asset. This arrangement therefore allowed the dynamics of differentiation among farmer families to resume on a basis similar to that which prevailed during the pre-collectivist period.
Furthermore, the Krom chiefs played a key role in this distribution because they were very familiar with each of the families, their work output and composition. They played an important role in the redistribution of land and production means because of their position of responsibility as well as the authority they represented. The transfer of land ownership was a quite complicated process, which varied form region to region. It combined the reestablishment of former property rights (restorative justice) with forms of distribution based on an egalitarian principle (distributive justice). The families of former large landowners (land estates that existed during the pre-collectivist period) and families related to the provincial authorities thus enjoyed significant advantages during the redistribution.
3.3.4 Land concentration and land markets
Early in the 1990s, the land market was recognized as an institution for the management of land transfer and acquisitions that set in motion a spontaneous, unregulated land transaction boom. The new legal provisions (ratified under the new 2001 land law) are based on the
assumption that the transfer of land through market mechanisms will result in the improvement of land productivity while ensuring an equitable distribution of land among the households.
Market-driven land transactions have undergone constant increase since 1993 for a number of reasons: the land liberalization made possible by the 1992 land law, the relative social and political stability that followed the 1993 elections creating a climate conducive to foreign and national investments, along with a rural exodus which saw a number of households leave the countryside for the city in search of jobs. Furthermore, during the 1993 election campaign some political parties had promised former large-scale landholders that they would restore the land estates that existed prior to the 1970 coup d’état. Given the uncertainty, a number of households opted to sell their land rather than run the risk of having it expropriated if those parties came into power.
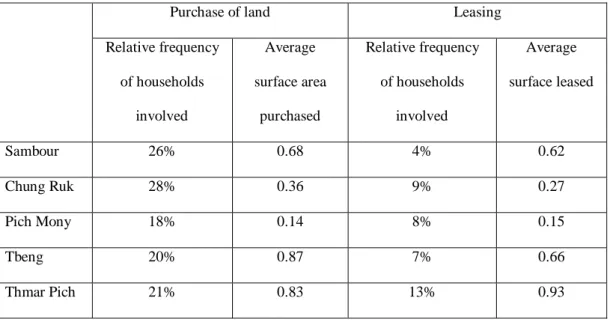
The percentage of households that were involved in a monetary land transaction are given in Figure 6. The average surface area purchased was 0.63 hectare. An ANOVA average comparison test shows that the overall area owned by the households that bought land is significantly higher than that of the others (1.71 ha compared to 0.89 ha). The number of households involved in a land leasing arrangement is lower than that for purchase. The qualitative surveys revealed that leasing land is very frequently a matter of transference of personal property to a creditor as collateral for a debt (precipitated by the household debt cycle) and merely amounts to a transitional means leading to purchase of the land. A specific observatory study was conducted in Chung Ruk in 2001 to take a critical look at the operation of land markets and to qualify this quantitative information.
Purchase of land Leasing Relative frequency of households involved Average surface area purchased Relative frequency of households involved Average surface leased Sambour 26% 0.68 4% 0.62 Chung Ruk 28% 0.36 9% 0.27 Pich Mony 18% 0.14 8% 0.15 Tbeng 20% 0.87 7% 0.66 Thmar Pich 21% 0.83 13% 0.93
Figure 6. Structure of land markets
The area of land plots purchased by households in the commune is clearly higher than the area sold. Notwithstanding the sample error that could distort this observation, it can be assumed that some households bought land outside of the commune. Thus, land transactions are not limited to the boundaries of the commune. The restructuring of farmland as a result of buying and selling takes place on a larger scale, beyond the traditional boundaries of the villages that are commonly viewed as socially homogenous units.
Figure 7 makes a distinction between land transactions made as a matter of choice or due to pressure. In 52 percent of cases, the sale of land was caused by a need for cash due to a situation of distress (sickness or food shortage). Observation shows however that these considerations are not really what make people sell their land. The families involved are in a desperate financial situation (major indebtedness) and what we are seeing is something more akin to a catalyst in a pauperization process.
Reparcelling of land 19% Change in activity 19% Sickness 28% Food shortage 24% Marriage 10%
Figure 7. Main reasons leading to the sale of land in Chung Ruk
While the new legal provisions purport to increase land productivity and ensure a more equitable land distribution, these findings show that, in reality, land markets are operating according to shut-out mechanisms that are pauperizing a growing number of farm households.
3.4 Financial credit and household indebtedness
The use of financial credit is an integral part of rural life in Cambodia. Credit is variously used to pay for expenses involved in the purchase of agriculture inputs, starting up a business, daily living costs, food, school fees or holding a family celebration. Very commonly, households in Cambodia do not take out credit for just one thing (Chan S. et Acharya S., 2002). Credit is multipurpose. Credit systems are expensive because the risks involved in using them are great; historically, there is no arbitrage or referee system to discourage debt overload. Cambodia has two major credit schemes in coexistence.
The first one is made up of institutionalized credit systems that came into being in the early 1990s through the development of private business activities, or that were put in place by certain non-governmental organizations or international institutions. To the extent that formal
systems set strict terms and conditions for credit use, they are a deterrent as far as the poorest households are concerned. The inflexibility of procedures for credit approval, the obligation to invest the money in a cost-effective revenue generating activity, the requirement to make loan payments at set times, as well as the need for collateral, are factors that tend to restrict access to such credit to well-off families only. Some have even pointed out that there is a measure of automatic exclusion that tends to keep the poorest out of the system (Bousso P. et al., 1998).
The second network is made up of informal financial systems (often very old) that have never been institutionalized. Sino-Khmer loan usurers are the backbone of this type of network. They have always played a central role in the history of agriculture in Cambodia. During the 1960s, they were key figures in an extensive process of chronic indebtedness affecting rural households, and this set off the significant dynamics of land concentration, leading to the pauperization of part of the farming community. Although farmers are increasingly aware of what is happening, these concerns are still an everyday reality. The informal credit systems nevertheless do offer some advantages: they are more widespread and therefore more readily available; access to them is flexible, with no prerequisites regarding productive use, and the credit can be available quite quickly.
3.4.1 Operation of the formal and informal financial systems
Informal credit is by far the most widely used loan system among rural households. Figure 8 shows that from 30 to 57 percent of households make use of it. It is available through various channels that we have put into three different categories: businesspeople (43 percent of transactions), families (32 percent) and neighbors (26 percent). The position of Sino-Khmer businesspeople is therefore crucial to an understanding of the financial systems in rural Cambodia. They create de facto situations of monopoly in rural communities, restricting the availability of credit, and now charge exorbitant rates (their monthly interest rates range from 15 to 50 percent). The part played by the extended family circle is also significant, and
interest rates are much lower (often 0 percent). Informal credit is generally used for non-productive activities: 47 percent of the volume is intended to cover health expenses or to deal with food shortages. These observations support and confirm the very strong link between the issues of public health, household indebtedness and land concentration.
0% 10% 20% 30% 40% 50% 60%
Sambour Chung Ruk Pich M ony Tbeng Thmar Pich
R el at iv e f re q ue n cy of h ouse hol ds
Exclusive formal credit Exclusive informal credit Formal and Informal credit
Figure 8. Frequency of households using the different types of credit
The use of formal credit is of secondary importance in the communes studied. The extent to which it is used depends on the presence and intervention of a local recognized institution. This geographic factor is a leading factor in the segmentation of financial credit markets inasmuch as throughout Cambodia there is still little coverage by formal networks. The interest rates charged remain relatively high: from 2 to 5 percent a month. A significant amount of the volume (60 percent) is invested in agricultural activities (34 percent) and for the purchase of a means of transportation for business purposes (26 percent).
Figure 8 also shows that the two credit systems are decoupled inasmuch as very few households will use both credit systems simultaneously. Households that take out double credit are in a situation of debt overload and thus have to take out informal (or formal) credit to pay off their formal (or informal) credit.
3.5 Animal draft power
Traditionally, animal husbandry as an economic activity has not really caught on among farmers and there are two main reasons for this. Firstly, farmers on the plain view themselves as people of the rice paddies, not livestock raisers. Secondly, market avenues are scarce, combined with the fact that very extensive freshwater fishery resources are available in Cambodia, which means that there has been little incentive to develop commercial livestock. Thus, animal husbandry is essentially restricted to the family and is secondary to rice growing, which requires a large number of draft animals while satisfying the basic pasture requirements for the animals. Animal draft power in Cambodia is counted in pairs: it takes two water buffalo or bullocks to pull a plow or harrow. Given the very low rate of farm mechanization, animal draft power enables farmers to care for the most labor-intensive jobs of plowing and harrowing. Buffalo and cattle are also used to haul the harvested produce from the rice paddies to the farmstead or to transport seedlings from nursery plots out to the rice paddies.
3.5.1 Ways of acquiring animal traction power
The study of the ways in which the sample households acquired animal traction power also made a distinction in the various types of access. Indeed, households have three different ways of obtaining a draft animal: owning it, renting it or by barter. The difference between these three approaches provides a good opportunity to highlight the market or traditional solidarity mechanisms (exchange of draft animal work for farm labor) that come into play, enabling Cambodian farmers to cope with a lack of draft animals or manage labor at peaks in the work cycle. These informal arrangements are an integral part of the social cohesion mechanisms that underpin agriculture production activities.
3.5.2 Ownership of draft animals and land concentration
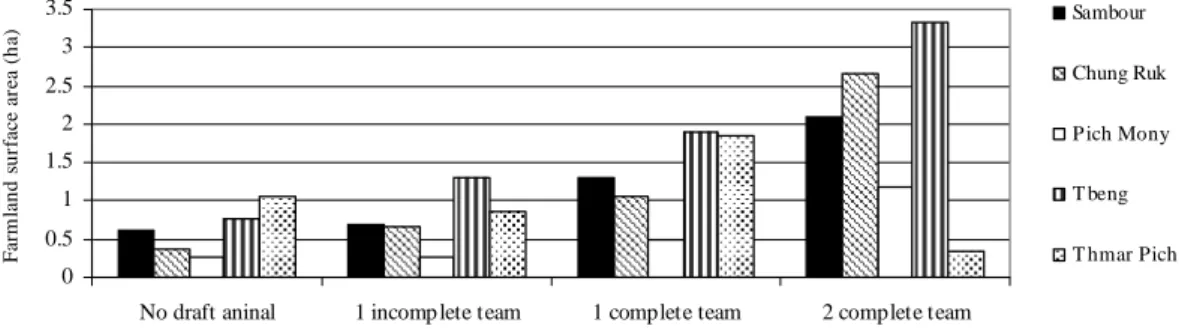
Much like the situation regarding farmland, draft animals are unequally distributed among households (figure 9). A proportion varying from 24 to 64 percent of households actually own draft animals, while the others have to acquire use of such animals in other ways.
Figure 9. Distribution of frequency of households based on ways of acquiring draft animals We note a strong relationship between the fact of having draft animal power and the farmland area per household (figure 10). This makes it possible to distinguish significantly different classes of farmland depending on the kind of draft animal power that is owned: part of a team (1 draft animal), one or two complete teams. This shows the interrelationship between the processes of land concentration on the one hand and operating capital on the other.
0 0.5 1 1.5 2 2.5 3 3.5
No draft aninal 1 incomp lete team 1 complete team 2 complete team
Type of draft animal team owned
F a rm la n d s u rf ace ar ea ( h a) Sambour Chung Ruk P ich Mony T beng T hmar Pich
Figure 10. Relationship between the types of draft animal power owned and farmland area Communes
Water buffalo Cattle
Own Rent Barter Own Rent Barter
Sambour 5% 0% 1% 55% 16% 35%
Chung Ruk 0% 0% 0% 64% 17% 62%
Pich Mony 0% 0% 0% 57% 16% 67%
Tbeng 15% 0% 4% 62% 4% 32%
3.5.3 Customary exchanges of draft animals
Farmers who do not have a draft animal may get hold of one in various ways, most commonly by barter. Labor is exchanged for the use of draft animals. Using a team for half a day of plowing is equivalent to two days of transplanting or harvesting work in the team owner’s rice paddies. When the household owns one draft animal, the exchange is generally done with another household in the same situation. In this case, the households involved are in a position to offer their draft animal but in turn require the use of another animal. The exchange of draft animals is a major factor in the management of working time among the households. It makes it possible, among other things, to get labor from outside of the family at peak labor times (plowing, preparation of seed lots, transplanting of seedlings and harvesting the paddy). However, the terms of the exchange are quite unfavorable as far as the non-animal household is concerned. Constraints relating to customary exchanges of draft animals are the delays that may be encountered in land preparation and, consequently, in getting the rice seedlings transplanted. Those who own draft animals have control over their own work schedules, whereas those who do not own animals have to fit their production plans around the schedules of the former. Such arrangements may result in a situation where the fields are only plowed once, whereas a second plowing is advisable and would normally be done.
4. Cropping systems based on rice growing
4.1 Agro-ecology and diversity of rice-growing systems
Rice growing in Cambodia is not very intensive. Rice paddies are rarely structured in such a way as they can be flooded using a dual system of water inflow and drainage. Only in very rare instances is there control over the water flow, and this can be explained largely due to natural conditions (rainfall regime, hydrography and topography). The rice paddy is generally used for only one rice crop per year, even though there are a great many systems for growing rice, each one adapted to particular agro-ecological conditions. The selection of paddy rice varieties is totally adapted to these different situations, the purpose being to spread out the
risks involved in growing in a relatively unstable agro-ecological environment. Figure 11 provides a breakdown of the land area devoted to rice growing in the communes studied. It underscores the extraordinary adaptability of rice growing systems to the agro-ecological conditions, which is the fruit of an age-old body of knowledge that Cambodian farmers have skillfully built up over the centuries.
0% 10% 20% 30% 40% 50% 60% 70% 80% 90% 100% Sambour Chung Ruk Pich Mony Tbeng Thmar Pich R ice g ro w in g area ( as a % of t o ta l r ice gr o w in g area ) Flood recession rice
Dry season rice
Chamcar rice
Floating rice
Rain-fed rice
Figure 11. Typical pattern of rice-growing systems for the 5 communes surveyed
Flood plain wet season rice is sometimes also referred to as seasonal rice. In the upland areas, a type of rice that has a very short growing season and is well adapted to the conditions of extensive cropping in a slash-and-burn setting is grown. This rice is referred to as upland or
chamcar rice. During the wet season, when there is sufficient lowland and the floodwater is
between 2 and 3 meters deep, farmers grow a type of deep water or floating rice. During the dry season, when access to water is possible using water storage reservoirs or remnants of water still flowing in rivers, dry season irrigated rice is grown. Dry season rice may also be a type of flood recession rice, which is replanted in flooded zones as the water recedes.
In order to fine-tune the analysis, two composite indices are used to grasp the land use processes. First of all there is the rice cropping land use rate8 which provides a measure of the intensity with which a household develops its rice cropping land, and secondly the crop diversification index,9 the value of which reflects the level of crop diversification within a household. Figure 12 gives the values for these two indexes for the five communes. It also highlights the relative importance of the two types of land that are conventionally distinguished based on their normal use. Rice cropping land is used for at least one crop of rice per year and chamcar land is not used for rice or exclusively for other crops (annual or perennial). Except for Thmar Pich, rice cropping lands occupy a leading place in the rotational cropping system.
Figure 12. Agro-ecology of land and land use processes
8
The rice cropping land use rate or rice index is calculated using the ratio between the total area sown in rice and the physical agricultural surface area that is used in order to achieve that sown area. An index higher than the unit (rice index>1) indicates that a fraction of the land lot had two crops of rice grown on it during the growing season.
9
The formula for the crop diversification index is as follows: 1−
∑
( )2 N niwhere ni is the actual
surface under crop i and N is the total growing area. Values for the index range from 0 to 1. If the number of crops increases, the index moves towards 1. But where there is low crop diversification, the index is close to 0 (Dao The Tuan et al., 1995).
Average surface area per household
Agro-ecology of the land plots
Rice index Crop diversification index Including rice-growing land Including chamcar land Sambour 1.05 99% 1% 1.12 0.005 Chung Ruk 0.75 87% 13% 1.13 0.253 Pich Mony 0.37 89% 11% 1.06 0.099 Tbeng 1.54 90% 10% 1.03 0.074 Thmar Pich 1.30 38% 62% 1.19 0.285
Agricultural land use processes appear to vary greatly from commune to commune. These differences are due to the various agro-ecological environments. Sambour commune has a very low average crop diversification index, but a relatively high rice cropping land use rate (12 percent of the rice cropping area is planted twice during a growing year). Agriculture production strategies are therefore focused on intensification of rice production. Chung Ruk and Thmar Pich communes have two noteworthy features: both the rice cropping land use rate and crop diversification rate are high. Also, Pich Mony and Tbeng communes have a low rice intensification index and a limited degree of crop diversification. As we shall see, these differentiated land use processes will also translate into different economic rationalities.
4.2 Rice production results10
Inasmuch as the rice production strategy depends to a considerable degree on the purpose for which the product is used, we must first of all clarify the main orientation of rice production. Households producing rice as a commercial undertaking will be more sensitive to the relationships between production costs and product yield, for which they will endeavor to maximize their profit margin. On the other hand, farmers who grow rice only for their own use will try to minimize production costs by making greater use, wherever possible, of low-cost production inputs such as family labor. With a proportion of 62 percent if its rice sold on the market, Sambour commune clearly outstrips the others in which the proportion of rice sold is 16, 18 and 5 percent respectively (Chung Ruk, Tbeng and Thmar Pich).
4.2.1 Rice yields and intensification of family labor
The findings regarding rice production are outlined in a dual perspective in order to identify regional differences and seasonal variations. There are two distinct growing seasons: fry season rice (short-season irrigated rice or flood recession rice) and wet season rice (traditional
10
The information collected in order to perform this analysis belongs to a sub-sample of 80 households interviewed in the framework of additional surveys taken during the project’s concluding year (2003).
rainfed rice). Firstly, we will take a look at the relationship between the yield and the amount of family labor supplied on the plots of land.
For seasonal rice, we see an inverse relationship between the amount of labor supplied and the area put into crop (figure 13). This means that in small farms there is a tendency to input a greater amount of labor per hectare. However, as figure 13 also shows, these small surface areas are precisely those in which the best yields of rainfed rice are obtained. There is therefore a positive relationship between the labor supplied per hectare and the rainfed rice yields.
Figure 13. Relationship between yield and farming and family labor. Note : p.-d. = person-day
This inverse relationship between intensification of family labor and area under cultivation is less obvious for dry season rice. Labor has less impact than for wet season rice. The use of fertilizers, the short growing season and improved water control have a greater impact on the yield of pre-season rice.
Surface area
Dry Season rice (irrigated or flood recession)
Wet season rice
Paddy rice yield Family labor Productivity of family labor Paddy rice yield Family labor Productivity of family labor (ha) (kg/ha) (p.-d./ha) (kg/p.-d.) (kg/ha) (p.-d./ha) (kg/p.-d.)
0-0.5 3,663 126 28 2,248 229 18
0.5-1 4,596 42 108 1,835 161 34
1-2 2,232 98 22 1,452 88 27
>2 5,878 36 163 1,064 61 26
4.2.2 Production costs
As is true of the labor supplied on the land plots, the cash costs of production11 vary according to the areas studied and according to the growing season. The average costs calculated for a growing season and per hectare are much higher for Sambour commune, on the Mekong flood plain, where they reach 1.1 million riels/hectare (US$284/ha). An increase in inputs is observed for the two rice growing seasons, and this is particularly high for flood recession rice. We are attributing this sharp difference to the commercial purpose of rice cropping in this commune, which requires a commercial approach that maximizes cost-effectiveness and increases inputs. For this commune, the seasonal rice that is used to a greater extent for internal household consumption costs quite a bit less to produce (701,138 riels/ha [or US$175.28/] ha).
Thmar Pich commune (a basaltic upland zone) had average costs per growing season of 327.589 riels/hectare (US$81.90/ha), which differs considerably from the costs recorded at Sambour. We then find in Chung Ruk commune (old alluvial terraces) and to a lesser extent in Tbeng commune (Tonle Sap Lake plain) that the annual average cash investment is only 115,957 riels/ha, or US$28.90/ha. Nevertheless, for both of these communes, the production approaches are quite different, depending on the surface of cropland available per household. In Chung Ruk, the available cropland area is quite limited and the main intensification factor in rice growing is family labor (figure 13). In Tbeng, on the other hand, surfaces under cultivation per household are significantly larger and, although there is really no expansion of agricultural activity, households are not confronted with the same need to intensify using labor or production inputs.
11
The cash costs of production covered in this study are the variable costs that fluctuate depending on
the production volume. They are expressed as riels/hectare. Seven expense headings have been identified: outside labor, fertilizer, pesticide, seed, energy, equipment rental and organic fertilizer. Family supplied labor was not factored in. The two main expenditure items are fertilizer and outside labor, which include only the wages paid to farm workers.4.2.3 Cost prices
Cost prices are indicators of economic competitiveness. They are a reflection of the combined effect of yields and costs of production (Lebailly P. et al., 2000). The database developed in the framework of the observatory made it possible to calculate the cost price of paddy rice for the different growing seasons. It also enables us to come up with an accurate figure for the production costs necessary to produce a determined amount of paddy rice. Figure 14 shows the major differences that exist from season to season and from region to region.
Dry season rice Wet season rice
Yield kg/ha Production costs riels/ha Cost price riels/kg Yield kg/ha Production costs riels/ha Cost price riels/kg Sambour 3,625 1,140,559 309 4,343 701,138 214 Chung Ruk 2,769 402,222 144 2,396 207,016 103 Tbeng - - - 896 115.957 158 Thmar Pich 1,400 226,001 146 1,279.1 321,373 171
Figure 14. Yields, production costs and cost price for paddy rice by agro-ecological zone and by season (family supplied labor not included)
While the previous analyses showed that Sambour commune was specializing in the commercial production of paddy rice, its cost price figures were higher (for the two seasons covered). This is no doubt due to the fact that a large amount of agricultural inputs were used in order to achieve fairly respectable yields, but this put a squeeze on the economic competitiveness at the production end of things. The cost price became particularly high for the dry season rice, which entailed the greatest use of inputs (figure 14). Conversely, Chung Ruk and Tbeng communes had cost prices that were much more competitive, even though the
amount of the production actually marketed was small. The production of rice for sale therefore follows a better thought-out approach in Chung Ruk, Tbeng and Thmar Pich, either because family labor was used as an intensification factor (Chung Ruk) or the cash costs of production (Tbeng) were reduced. In the areas under study, the rural households have rice production strategies that are clearly different and that are the result of decisions rationally made that take the overall production environment into account.
5. Non-agricultural activities
There is no doubt that diversification of rural household activities to include the non-agricultural sphere is one of the most notable aspects of the farmer strategies that we had the opportunity of studying. Indeed, heads of households are very interested in activities that, strictly speaking, lie outside the scope of farm operations.
The structure and operation of such non-agriculture labor markets are quite different from one region to the other, depending on their agricultural potential and the non-farm-related job opportunities that they offer. In Chung Ruk commune, for instance, because they have a good location on National Route 3 along the way to Kampot province, many households can readily travel to Phnom Penh and be actively involved in the transportation of goods and persons. In Sambour, there is less involvement in non-agricultural activities due to the fact that farm strategies are specialized. The economic history of Thmar Pich commune, in Kampong Cham province, is strongly influenced by commercial activities with Vietnam, both upstream and downstream from agriculture. Tbeng commune is undergoing a gradual structuring of its non-agricultural sector because it lies on National Route 6, which links Siem Reap and Phnom Penh. To illustrate these differences, figure 15 shows the distribution of the frequency of households based on the number of persons involved in a non-agricultural activity.
29% 59% 29% 33% 71% 21% 49% 48% 31% 48% 18% 8% 18% 13% 6% 0% 10% 20% 30% 40% 50% 60% 70% 80% 90% 100%
Sambour Chung Ruk Pich Mony Tbeng Thmar Pich
R e la ti ve f re que nc y o f hous e hol ds 3-4 persons 2 persons 1 person 0 person
Figure 15. Distribution of frequency of households according to the number of persons involved in a non-agricultural activity
Although the opportunities afforded by the socio-economic environment play a crucial role in whatever non-agricultural activities are carried on, this is in response to an economic approach incidental to each household. The performance of a non-agricultural activity may therefore involve two different approaches; an economic motivation first, inasmuch as a great majority of households grow nothing but rice, which considerably cuts down on the occupational structure of farmer households. Under-employed labor during the dry season may be directed to temporary or permanent jobs in areas outside of farm operations. Also, there is a ‘survival’ motivation due to the fact that some households (landless or nearly so) have no choice but to look for income from work not related to their operation simply to ensure the replication of their domestic unit.
Non-agriculture labor markets are greatly segmented. Five activities are particularly common: business, transportation, handicraft work and construction work, along with a large number of young women taking on jobs as textile workers in Phnom Penh (see figure 16). They account for 5 percent of the non-agricultural workers in our sample (essentially in Chung Ruk, Pich
Mony and Thmar Pich) and the cash inflow that they generate provides overall a major financial input for their home households.
Figure 16. Characteristics of a few non-agricultural activities
Furthermore, no inverse relationship is observed between the land area and the number of days of labor devoted to non-agricultural activities. This is a matter of greater concern for landless households, but it is difficult to say, in the final analysis, if there is such a negative correlation between non-agricultural activities and the household’s land holding. On the other hand, there is a fairly definite relationship between the number of potential laborers in the household and the number of persons actually performing a non-agricultural activity. This phenomenon of family labor diversification into non-agricultural activities is illustrated in figure 17. We thus conclude that the search for a fulltime job is what actually motivates households to take on work in the non-agricultural labor market. T
Activities Length of employment (months/year) Daily income (riels/day) Handicraft 7.2 3,003 Textile worker 11.4 5,338 Business 8.1 2,872 Construction 5.4 3,588 Transportation 3.7 5,257 Average 8.1 3,655
0 50 100 150 200 250 <25 25-35 35-45 45-55 55-65 >65
Age groups of heads of households (years )
A v e ra g e num be r of da ys pe r hous e hol d sp e n t in non -a gr ic ul tu ra l a c ti v it ie s
Figure 17. Relationship between the number of potential laborers and the number of persons involved in non-agricultural markets
6. Multidimensional aggregation of the data
A multidimensional analysis using the principal components method makes it possible to fine-tune our examination of the quantitative data. It takes into account the links that exist between each variable and includes the construction of a system of axes (principal components), enabling a maximization of the initial data variance. Altogether, 17 structural variables have been used in the discriminant function.12
The results of the analysis indicate that 64 percent of the variance of the initial scatter diagram can be explained by only three main components. The interpretation of these components is done by a graphic representation of the correlations between variables in the new system of axes (figure 18). The first two components (49 percent of the initial variance) clearly distinguish two groups of explanatory variables:
12
age of head of household (a) – number of potential laborers (b) – total number of persons with a primary education (c) – total agricultural surface (d) – rice cropping area (e) – chamcar area (f) – rice index (g) – agricultural diversification index (h) – dey phum surface area (i) – irrigated surface (j) – number of draft oxen owned (k) – number of items of tillage equipment owned (l) – size of poultry flock (m) – size of swine herd (n) – size of cattle herd (o) – amount of formal credit (p) – amount of informal credit (q) – number of wage earners from agriculture (r) – income from wages (s) – number of persons performing a agricultural activity (t) – number of days household performs non-agricultural activities (u).
h q f i s n t u r a c e b d j o m p g k l Principal component 1 P ri n c ipa l c o m pone nt 2
Figure 18. Correlation circle for the 17 variables of the discriminant function
1. The first principal component, which in itself is sufficient to explain 30 percent of the initial variance, is an axis that describes the agricultural production volume and capacity of the households. The variables that describe the land surface, agricultural equipment and livestock capital are indeed very well correlated at the level of this first component.
2. The second principal component, which in itself is sufficient to account for 18 percent of the initial variance, is an axis that describes the capabilities for diversification of the household’s activities. The descriptive variables of agricultural diversification (irrigated surface area and agricultural diversification index), but especially diversification outside of agriculture (number of days of non-agricultural activities and agricultural wage earners), are very well correlated at the level of this component.
It is indeed noteworthy that the analysis of principal components has highlighted these two groups of structural variables; it thus confirms the descriptive analyses given above. It therefore appears that the key challenges of the communes studied are articulated around these two axes.
7. The cash circulation process
7.1 Diversification of income
In Cambodia, diversification of cash income13 is an integral part of farmer strategies. Traditionally, Cambodian farmers have always diversified their range of income generating activities. Such a strategy enables increased opportunities to use family labor, generate income from sources complementary to those of the agriculture sector, and reduce the risks inherent in having just one activity. Cash incomes are partial indicators of social differentiation inasmuch as they do not take into account the extent to which households are consumers of their own products.
The highest average was found in Thmar Pich (1,691,075 riels/year/household, or US$422/year/household) and the lowest average was in Pich Mony (1,023,274 riels/year/household, or US$255/year/household). The distribution of income sources varies from one commune to another (figure 19). Chung Ruk commune appears to have developed quite a “non-agricultural” pattern. The farmland area is relatively small, which limits opportunities to market agricultural surpluses. A similar situation prevails in Pich Mony. In Tbeng, where cropping areas are considerably larger, the income component from agricultural activities (especially rice cropping) is likewise considerably higher. And Thmar Pich commune has the most diversification, as its cash income comes from both agricultural
13
To outline the process of cash circulation, the gross cash income classification was broken down into 8 categories: income from common property resources (fishing and forestry), income from rental (renting out a piece of equipment), income from agriculture wage earners, non-agriculture income, external subsidies (money sent home by a family member living in the city or abroad) and agriculture income (rice, chamcar and animal husbandry). The income mentioned is gross cash income calculated in Cambodian riels (US$1 = 4,000 riels). The database set up in the framework of the project is such that it is not possible to arrive at an accurate estimation of cash income for Sambour commune.
sources (fruit production and yearly cropping of chamcar land), as well as from other-than-agriculture activities. 29% 24% 47% 60% 0 200,000 400,000 600,000 800,000 1,000,000 1,200,000 1,400,000 1,600,000 1,800,000 Chung Ruk (368$/year) Pich Mony (255$/year) Tbeng (296$/year) Thmar Pich (422$/year) G ro ss an nu al cas h i n co me ( R iels /y ear ) Animal husbandry Other crops Rice External subsidies Non-agricultural activities Agricultural wage Equipments rental Common property
Figure 19. Average annual gross cash income
What is outstanding is the preponderance of income from non-agricultural sources in the overall cash income. Non-agriculture activities in the strict sense (business, transportation, construction, civil service, etc.) generate a large amount of cash income in comparison with agricultural activities (rice, other crops and animal husbandry). Obviously, this sector, albeit still very informal and segmented, constitutes an axis around which the major challenges facing rural communities in Cambodia in the future will be articulated.
Furthermore, supply and distribution channels for agricultural produce are not yet sufficiently structured for agricultural specialization to really become an incentive at a household level. The role played by business go-betweens and the lack of training in agriculture are factors that, for the time being, are major obstacles to development as far as small-scale farmers are concerned. Income diversification seems to be the ideal way to enhance people's living conditions, either through expanded replication or simple replication.
7.2 Cash income concentration
The relationship between the land surface area and cash income sheds further insight on cash circulation processes. Landless households are not necessarily those with the lowest incomes (figure 20). For households that have land, a positive relationship exists between the cash income and the cropping area. Figure 20 also shows the decreasing importance of the agricultural wage earner component as a function of the cropping area. Overall, the agricultural wage earner component fits into a limited period (the average length of time spent on other farm operations varies from 1 to 365 days, the average being 25 days). However, it seems that this is one of the corollaries of the land concentration process discussed earlier. The structure of this activity suggests that this is the starting point for a process of agricultural proletarianization, in other words, the polarization of land and capital on the one hand, and labor on the other. This process results from the differentiation of the conditions for replication of production inputs of the households.
0 500,000 1,000,000 1,500,000 2,000,000 2,500,000 Landless 0-0,5 0,5-1 1-2 >2
Agricultural land (classes of area in ha)
Y ear ly g ro ss cach i n co m e (r iels /y ear )
Common property resources Equipment rental
Agricultural wage Non-agricultural activities
External subsidies Rice
Other crops Animal Husbandry
Figure 20. Relationship between gross annual cash income and cropping surface
A distribution of household frequency for five categories of cash income (figure 21) clearly shows the effect of income concentration. Between 34 and 70 percent of households earn less
than US$200 a year. Conversely, barely 16 percent (between 10 and 20 percent) of households have a cash income in excess of US$600 a year.
Cash income levels
Chung Ruk Pich Mony Tbeng Thmar Pich
Below US$200/year 53 % 70 % 46 % 34 % US$200–400/year 15 % 13 % 31 % 32 % US$4001600/yeaer 14 % 4 % 13 % 14 % US$600–800/year 8 % 4 % 5 % 8 % Over US$800/year 10 % 9 % 5 % 12 % Total 100 % 100 % 100 % 100 %
Figure 21. Distribution of households according to 5 levels of cash income
An analysis of concentration using Lorenz curves and Gini coefficients confirms and clarifies this phenomenon. The following reasoning will be based essentially on cash income from agriculture (rice, chamcar and animal husbandry combined) and aggregate cash income. The first observation is the very strong concentration of cash income from agriculture (Gini coefficient of 0.62). It is, however, noteworthy that the Lorenz curve calculated from the aggregate cash income shows a lower level of concentration (Gini coefficient of 0.53). To some extent, we are seeing, therefore, a rebalancing of the disparities in agriculture-sourced cash income by income originating from non-agriculture activities (see figures 22 and 23).
0 0.1 0.2 0.3 0.4 0.5 0.6 0.7 0.8 0.9 1 0 0.1 0.2 0.3 0.4 0.5 0.6 0.7 0.8 0.9 1
Cumulated relative frequency of HH
C u m u la te d r ela tiv e f re q u en cy o f a g ri cu ltu re s o u rc ed in co m e Gini coefficient = 0.62 0 0.1 0.2 0.3 0.4 0.5 0.6 0.7 0.8 0.9 1 0 0.1 0.2 0.3 0.4 0.5 0.6 0.7 0.8 0.9 1
Cumulated relative frequency of HH
C u mul at ed r el at iv e f re que nc y of gr o ss i n co m e Gini coefficient = 0.53
Figure 22. Concentration curve of agriculture sourced cash income
Figure 23. Concentration curve of total cash income
The numerical estimate of the concentration of aggregate cash income, however, reveals a situation that remains relatively elitist. It seems rather that a dual phenomenon of polarization is occurring among the households as a function of their economic orientation. The first polarization phenomenon is driven by operations focusing strongly on agriculture markets from which they are deriving a sizable cash income. The enlarged replication base for these households is land, of course, but also the capital enabling them to invest each year in crop inputs. The second polarization trend is driven by households that are essentially non-agricultural and whose replication base is capital. Such households are more or less extraneous to the agriculture sector and stable, non-agriculture jobs constitute the basis for their replication strategy.
8. Socio-economic differentiation processes: by way of conclusion
The analysis shows that farmers in the communes studied are not producing according to a linear production mode by casting aside commercial exchanges and differences resulting from competition. Nor are they totally integrated into the markets; they continue to produce on the basis of non-paid means of production, such as family labor. Farmer rationalities are
complex syntheses of these two experiences and are broken down along a continuum that ranges from the virtually self-sufficient household to the household that is fully market integrated. The nature of the differentiation processes is integral to this polarization.
An initial differentiation process, demographic in nature, is related to the life cycle of the households. This refers to changes in the availability of family labor and in the dependency ratio, and affects the overall productivity of the operation. These range from households headed by young adults with no capital to those whose children have gone to live on their own, as well as those that have a more or less strong and diversified labor force and who have greater labor capacities. However, this demographic differentiation process is quite different from the Chayanovian model inasmuch as it is expressed mainly outside the agriculture sector. The occupational basis of households in agriculture is indeed reduced (constraints to rice intensification or crop diversification) and family labor diversification will mainly be directed to non-agriculture activities.
The second differentiation process is linked to the capacity of households to articulate around farmer markets (inputs and outputs). It is the cause of conspicuous economic differences in cash income from agriculture sources and productive investments. There are high levels of land and operating capital concentration and these differences impact on opportunities for agricultural innovation and market insertion. Access to formal financial credit networks intended for productive investments in the agriculture sector is also crucial. Inasmuch as conditions for access to and use of these networks are quite strict, these networks are only accessible to high-performance households and aggravate the polarization of households engaging in enlarged replication strategies and those mainly concerned with the replication of their own production system.
These differentiation processes operate in a social replication context that tends to split the farmer community into distinct strata due to the game of inheritance and favoritism. Yet,
there is nothing new about the way things are dealt out in this new game. It favors those households that, back in the pre-collectivist era, were already in a position to accumulate and who now find themselves with better financial capabilities than the others. This has been observed in the five communes studied. The reintroduction of money in 1980, membership in a Krom Samaki that was more market-oriented, and access to positions of responsibility in a
Krom or to some level of the village administration, are factors that enabled some households
to continue their accumulation of capital during the collectivist era and that have engendered disparities, the visible expression of which, in economic terms, is now being reinforced.
Bibliographical notes
Biddulph, R. (2000). Landlessness: a Growing Problem, Cambodia Development Review, Volume 4, Issue 3, page 1–2.
Biddulph, R. (dir.) (2000). Interim Report on Findings of Landlessness and Development
Information Tool (LADIT) research, Oxfam GB: Cambodia Land Study Project, Phnom
Penh, Discussion paper, 27 pages.
Bousso, P., Daubert, P., Gauthier, N., Parent, M. and C. Zieglé (1998). The micro-economic
impact of rural credit in Cambodia, Paris, Editions du GRET, 61 pages.
Chan, S. and S. Acharya (2002). Facing the Challenge of Rural Livelihood, a Perspective
from Nine Villages in Cambodia, Cambodia Development Resource Institute, Phnom Penh,
Working Paper No. 25, 122 pages.
Dao The T. and Dao The A. (1995). Situation de l’économie familiale paysanne à Nam Thanh (Hai Hung), in Dao The Tuan (ed.) (1995). L’agriculture du delta du Fleuve Rouge à
Deere, C. Diana, and de Janvry, A. (1979). A conceptual framework for the empirical analysis of peasants, American Journal of Agricultural Economics, Vol. 61, No. 4, pages 601–611.
Desbarats, J. (1995). Prolific Survivors: Population Change in Cambodia 1975-1993, Arizona State University, Program for Southeast Asian Studies, Tempe, 234 pages.
Haubert, M. (1997). Sociétés paysannes et développement, in Haubert, M. (dir.) (1997), Les
paysans, l’Etat et le marché, Publication de la Sorbonne, Paris, pages 9–16.
Kiernan, B. (1996). The Pol Pot Regime, Race, Power and Genocide in Cambodia under the
Khmer Rouge, 1975–79, Yale University, Chiang Mai, Silkworm books, 477 pages.
Kim, S. (2002). Agrarian Situation in Contemporary Cambodia: Overview of Case Studies in Cambodian Villages, Cambodia Development Review, Volume 6, Issue 2, pages 5–8.
Lebailly, P., Dogot, T., Pham V. B., and Tran T. K. (2000). La filière rizicole au Sud
Viêt-nam : un modèle méthodologique, Gembloux, Les Presses Agronomiques de Gembloux,
pages VII–XII.
Ledgerwood J., ed. (2003), Cambodia Emerges From The Past : Eight Essays, Center for Southeast Asian Studies, Norther Illinois University, Southeast Asian publications, DeKalb, 305 pages.
MRC (Mekong River Commission) (1998). Digital Land Cover of 1993 and 1997. Phnom Penh.
Kingdom of Cambodia, Ministry of Planning, National Institute of Statistics (1999). General
Population Census, Phnom Penh, CD-ROM data.
Vickery, M. (1984). Cambodia 1975-1982. Chiang Mai, Silkworm Books, 369 p. List of Figures
Figure 1. Agro-ecological zoning of the Cambodian central plain ...5
Figure 2. Representation of the study zones on the Cambodian central plain ...6
Figure 3. Changes in the dependency ratio per household based on age of head of household ...9
Figure 4. Land structures in the five communes studied... 10
Figure 5. Comparison of land acquisition methods ... 11
Figure 6. Structure of land markets ... 14
Figure 7. Main reasons leading to the sale of land in Chung Ruk ... 15
Figure 8. Frequency of households using the different types of credit ... 17
Figure 9. Distribution of frequency of households based on ways of acquiring draft animals ... 19
Figure 10. Relationship between the types of draft animal power owned and farmland area ... 19
Figure 11. Typical pattern of rice-growing systems for the 5 communes surveyed ... 21
Figure 12. Agro-ecology of land and land use processes ... 22
Figure 13. Relationship between yield and farming and family labor. Note : p.-d. = person-day ... 24
Figure 14. Yields, production costs and cost price for paddy rice by agro-ecological zone and by season (family supplied labor not included) ... 26
Figure 15. Distribution of frequency of households according to the number of persons involved in a non-agricultural activity ... 28
Figure 16. Characteristics of a few non-agricultural activities ... 29
Figure 17. Relationship between the number of potential laborers and the number of persons involved in non-agricultural markets ... 30
Figure 18. Correlation circle for the 17 variables of the discriminant function ... 31
Figure 19. Average annual gross cash income ... 33
Figure 20. Relationship between gross annual cash income and cropping surface ... 34
Figure 21. Distribution of households according to 5 levels of cash income ... 35
Figure 22. Concentration curve of agriculture sourced cash income ... 36