HAL Id: tel-01341063
https://tel.archives-ouvertes.fr/tel-01341063
Submitted on 4 Jul 2016
HAL is a multi-disciplinary open access
archive for the deposit and dissemination of sci-entific research documents, whether they are pub-lished or not. The documents may come from teaching and research institutions in France or
L’archive ouverte pluridisciplinaire HAL, est destinée au dépôt et à la diffusion de documents scientifiques de niveau recherche, publiés ou non, émanant des établissements d’enseignement et de recherche français ou étrangers, des laboratoires
Mechanisms of central nervous system nodes of Ranvier
assembly
Sean Freeman
To cite this version:
Sean Freeman. Mechanisms of central nervous system nodes of Ranvier assembly. Neurons and Cog-nition [q-bio.NC]. Université Pierre et Marie Curie - Paris VI, 2015. English. �NNT : 2015PA066425�. �tel-01341063�
1
Université
Pierre et Marie Curie
École Doctorale 158 : Cerveau-Cognition-Comportement
L’Institut du Cerveau et de la Moelle/ UMR_S 1127Mechanisms of Central Nervous System Nodes of
Ranvier Assembly
Par : Sean Anthony FREEMAN
Thèse de doctorat de Neurosciences
Dirigée par Mme. Catherine LUBETZKI et Mme. Nathalie SOL-FOULON Présentée et soutenue publiquement le 2 juillet 2015
Devant un jury composé de :
M. Peter J. BROPHY - Examinateur
M. François COURAUD - Président du jury
Mme. Bénédicte DARGENT - Rapporteur
Mme. Catherine LUBETZKI - Directrice de la thèse
Mme. Nathalie SOL-FOULON - Co-directrice de la thèse
3
Table of Contents
Abbreviations ... 4
Part I: Introduction ... 13
Chapter I: The myelinated nerve ... 14
1.1 Historical perspective of the nerve fiber ... 14
1.2 Structure and molecular composition of myelinated nerve fibers ... 17
1.2.1 The myelin sheath ... 17
1.2.1.1 Myelinated regions and structure ... 18
1.2.1.2 Myelin composition ... 20
1.2.1.2.1 Lipid composition... 20
1.2.1.2.2 Protein composition ... 21
1.2.1.3 Oligodendrocyte differentiation and myelination ... 23
1.2.2 The nodes of Ranvier (Nodes) ... 26
1.2.2.1 Nodal ultrastructure ... 28
1.3 Molecular composition of excitable and axo-glial domains ... 33
1.3.1 Voltage-gated ion channels ... 35
1.3.1.1 Voltage-gated sodium channels (Nav) ... 35
1.3.1.2 Voltage-gated potassium channels (Kv) ... 45
1.3.2 Cellular adhesion molecules of the immunoglobulin superfamily ... 48
1.3.2.1 L1-CAMs ... 48
1.3.2.2 GPI-anchored CAMs ... 57
1.3.2.3 Neurexin-related CAMs ... 60
1.3.3 Cytoskeletal scaffolding proteins ... 64
1.3.3.1 Spectrins ... 66
1.3.3.2 Ankyrins ... 70
1.3.4 Other scaffolding molecules ... 72
1.3.5 Schwann cell microvilli and extracellular matrix (ECM) proteins ... 73
1.3.5.2 ECM ... 76
1.3.6 Signaling molecules ... 78
Chapter II: Action potential conduction along myelinated fibers in healthy and diseased states ... 82
2.1 Signal conduction along unmyelinated axons ... 82
2.2 Signal conduction along myelinated axons ... 86
2.3 Factors affecting conduction velocity in nyelinated axons ... 90
2.3.1 Paranodal junctions ... 90
2.3.2 Nodes of Ranvier ... 90
2.4 The transition to saltatory conduction along myelinated axons ... 93
2.5 Action potential conduction in the diseased state ... 94
2.5.1 Multiple sclerosis (MS) ... 94
2.5.2 Disruption to the nodal architecture alters axonal conduction ... 95
Chapter III: Mechanisms of nodes of Ranvier assembly and transport of nodal components in the PNS and CNS ... 100
3.1 Mechanisms of PNS nodes of Ranvier assembly ... 100
3.1.1 Heminodal clustering mechanism ... 101
3.1.2 Paranodal-junction dependent mechanism ... 104
3.2 Mechanisms of CNS nodes of Ranvier assembly ... 107
3.2.1 Extrinsic mechanisms of CNS nodes of Ranvier formation ... 107
3.2.1.1 Paranodal junctions ... 107
3.2.1.2 ECM ... 110
3.2.1.3 Oligodendroglial secreted proteins ... 111
3.2.1.4 Nodal CAMs and Nav ß-Subunits ... 114
3.2.2 Intrinsic mechanisms of CNS nodes of Ranvier formation ... 115
3.2.2.1 Cytoskeletal Scaffolds ... 115
3.2 Trafficking and targeting of neuronal nodal components ... 120 3.2.1 Mechanisms for the transition of voltage-gated channels at the nodes of
5
3.3 Aim of the dissertation ... 129
Part II: Results ... 132
Acceleration of conduction velocity linked to clustering of nodal components precedes myelination ... 133
Study of the trafficking of nodal components by live imaging in dissociated hippocampal cultures ... 153
Part III: Discussion ... 178
1.1 Prenodes form along GABAergic interneurons in the absence of myelination: Developmental function and beyond ... 179
1.2 Do prenodes determine where myelination takes place? ... 180
2.1 Prenodal assembly requires extrinsic and intrinsic factors ... 181
2.1.1 What is the nature of the oligodendrocyte secreted factor(s)? ... 182
2.1.2 The action of the oligodendrocyte secreted factor(s) ... 183
2.2 The role of ankyrinG ... 185
2.3 The transition of ion channels at prenodes ... 186
3.1 The roles of prenodes in action potential conduction ... 189
3.1.2 Would conduction speed increase when myelination occurs and do prenodes permit saltatory conduction? ... 191
3.1.3 Prenodes in the pathological state ... 193
Conclusion ... 197
References ... 199
Summary ... 237
7
Table of Figures
Figure 1: Ultrastructure and overview of myelinated domains ... 19
Figure 2: Oligodendrocyte lineage and myelination ... 25
Figure 3: Louis-Antoine and his drawings of the “étranglements annulaires” ... 27
Figure 4: Ultrastructure of the nodes of Ranvier ... 31
Figure 5: Overview of the molecular architecture of the CNS and PNS excitable domains and perinodal domains ... 34
Figure 6: Structure and distribution of mammalian voltage-gated sodium channel α-subunits ... 36
Figure 7: Immunolocalization of Nav subunits at the AIS and nodes of Ranvier .... 39
Figure 8: Structure, expression, and localization of voltage-gated potassium channels ... 44
Figure 9: General Structure of L1-CAMs ... 49
Figure 10: Neurofascin isoforms. ... 49
Figure 11: Neurofascin186 at the AIS and nodes of Ranvier ... 52
Figure 12: Paranodal localization of Nfasc155 in the PNS and CNS ... 54
Figure 13: Expression of contactin in the CNS and PNS ... 58
Figure 14: Expression of TAG-1, and loss of TAG-1 results in aberrant Kv1 localization ... 58
Figure 15: Caspr is a molecular marker for paranodal junction formation ... 61
Figure 16: Expression of Caspr2 and the juxtaparanodes ... 63
Figure 17: General structure of the spectrin family of scaffolding proteins ... 65
Figure 18: General structure of the ankyrin family of scaffolding proteins ... 65
Figure 19: Immunolocalization of spectrin scaffolding proteins at excitable and perinodal domains ... 67
Figure 20: AnkyrinG maintains AIS components ... 69
Figure 21: AnkyrinG is a nodal and paranodal component. ... 69
Figure 22: Gliomedin structure, cleavage sites, and immunolocalization in the PNS ... 74
Figure 23: Summary of the molecular architechure of CNS and PNS excitable
domains and perinodal domains ... 79
Figure 24: Action potential conduction along unmyelinated axons ... 83
Figure 25: Action potential conduction along myelinated axons ... 87
Figure 26: Conduction is altered when the paranodes and nodes of Ranvier are disturbed ... 91
Figure 26: Changes in nodal architecture during demyelination. ... 96
Figure 27: Heminodal clustering mechanism in the PNS ... 102
Figure 28: Role of paranodal junctions in forming PNS nodes of Ranvier ... 105
Figure 29: Role of paranodal junctions in forming CNS nodes of Ranvier ... 108
Figure 30: Oligodendrocyte secreted factors induces node-like clustering in the CNS ... 112
Figure 31: Cre-lox systems utilized to study the roles of ankyrinG in CNS nodes of Ranvier assembly ... 118
Figure 32: Overview of the trafficking pathways axonal proteins to be delivered to specific axonal domains ... 121
Figure 33: Neurofascin186 is selectively retained at PNS nodes of Ranvier ... 124
Figure 34: Transition from Nav1.2 to Nav1.6 in the developing optic nerve ... 126
Figure 35: Summary of the assembly mechanisms governing prenode formation and the functional role of nodal clusters prior to myelination ... 195
9
Abbreviations
2’,3’-cyclic-nucleotide 3’phosphodiesterase: CNPase
A disintegrin and metalloproteinase: ADAM
Action potential: AP
Adenomatous polyposis coli: APC
Adenosine triphosphate: ATP
Ankyrin-binding domain: ABD
Axon initial segment: AIS
Brain-specific hyaluronan-binding link protein: Bral1
Calmodulin kinase II: CaMKII
Casein kinase 2 CK2
Cell adhesion molecule: CAM
Central nervous system: CNS
Cerebroside sulfotransferase: CST
Chondroitin sulfate proteoglycans: CSPG
Close homolog of L1: CHL-1
Contactin associated protein: Caspr
Days in vitro: DIV
Dorsal root ganglion: DRG
Extracellular matrix: ECM
Ezrin/Radixin/Moesin: ERM
Fibronectin type III: FNIII
Galactocerebroside: GalC
Galactosyltransferase: CGT
Glutamate decarboxylase: GAD
Glycophorin, Neurexin IV, Paranodin: GNP
Glycosylphosphatidylinositol: GPI
Green fluorescent protein: GFP
Heparin sulfate proteoglycan: HSPG
Human influenza hemagglutinin: HA
Immunoglobulin: Ig
IQ Motif Containing J-Schwannomin
Interacting Protein 1: IQCJ-SCHIP-1
Kinesin-like protein KIF
Membrane associated guaylate kinase: MAGUK
micro RNA: miRNA
Microtubule-associated protein 2: MAP2
Multiple sclerosis: MS
Myelin basic protein: MBP
Myelin-associated glycoprotein: MAG
Neural/glial antigen 2: NG2
Neurofascin: Nfasc
Neuron conditioned medium: NCM
Neuron-glia CAM related: NrCAM
Oligodendrocyte OL
Oligodendrocyte conditioned medium: OCM
Oligodendrocyte precursor cell: OPC
Peripheral nervous system: PNS
Platelet derived growth factor receptor alpha: PDGF-alpha
Proline, alanine, threonine: PAT
Proteolipid protein: PLP
11
Retinal ganglion cell: RGC
Short Hairpin RNA: shRNA
Transient axonal glycoprotein-1: TAG-1
Vesicular glutamate transporter: VGAT
Voltage-gated potassium channel: Kv
Introduction: Chapter I
Chapter I: The Myelinated Nerve
1.1 Historical Perspective of the Nerve Fiber
In the early 19th century, the first drawings of the nervous cell came to light
through the observations of the German anatomist Gabriel Gustav Valentin (1810-1863). Before this time, microscope instrumentation and histological tools were too crude to detail the fine structure of nervous system cells; however, it was through the very development of the achromatic lens in compound microscopes coupled with improvements in histological tools that the drawings of Valentin and those of his contemporaries saw the light of day. Great improvement of Valentin’s work was followed by beautifully detailed studies in the cerebellum from the Czech anatomist Jan Evangelista Purkinje (1787-1869). In his observations, he described tear-like shapes in rows with short processes emanating towards the outside grey matter surface, which we now call the Purkinje cell.
Another pioneering anatomist during this time, Robert Remak (1815-1865), first described, unintentionally, the axon. He observed, nearly at the same time by the German physiologist Theodor Schwann (1810-1882), that there were fibers that were myelinated and those that were unmyelinated, which he called “Remak bands” and “Remak fibers”, respectively. However, it was not until 27 years later that drawings by the young German neuroanatomist Otto Friedrich Karl Deiters (1834-1863) would produce the clearest observations yet of the nervous cell. With the help of better microscopes and better histological techniques, he was able to describe branches radiating from the cellular soma and a long cylindrical process emanating from the cell body. What Deiters referred to as “protoplasmic processes” and “axis cylinder” were renamed in 1889 by Wilhelm His (1831-1904) to be “dendrites”, and by Rudolph Albert von Kölliker (1817-1905) as the “axon”. Furthermore, he was
Introduction: Chapter I describe as the axon initial segment (AIS). In between the time of renaming the neurite processes, the German anatomist Heinrich Wilhelm von Waldeyer (1836-1921) also put a name to the nerve cell itself, which he labeled as the “neuron”.
On the myelinating glia front, studies in the mid 1800’s by the German pathologist Rudolf Virchow (1821-1902) advanced the original work of his predecessors Remak and Schwann. At this time, he described a sheath around axons and labeled it, although misnamed, “myelin” since it resembled bone marrow, and “myelos” is Greek for “marrow”. It was not until 1871 with the work of Louis-Antoine Ranvier (1835-1922) that we would redefine the Remak bands as a specific myelinating cells in the peripheral nervous system as Schwann cells, and later on in 1878 the gaps in between the myelinating segments as nodes of Ranvier.
The next significant progress for neurons occurred with the development of a new stain by the Italian physician Camillo Golgi (1843-1926). This stain, which bears his name as the Golgi stain, was able to specifically impregnate neurons, and further improved the ability of anatomists to follow the trajectories of the neurite processes. Following this useful new technique, a convergence of ideas from some of the greatest European scientists took place to conceptualize the cellular basis of the nervous system. One school of thought called the reticular theory, led by Golgi, suggested that nerve cells were so densely packed together there could not be a possible way of transmission between nervous cells. Thusly, he argued, nervous tissue must be continuous.
The other school, advanced by the prodigious Spanish histologist Santiago Ramón y Cajal (1852-1934), stated that the neuron is the basic cellular and functional unit of the nervous system. This concept, which we currently hold today, would later take shape to be called the “Neuron Doctrine”. Ramón y Cajal came to this conclusion based on an improved Golgi staining technique, which allowed him to visualize more closely the fine structures of axonal projections and dendritic arborizations. He observed that axon terminals were located in the regions of dendritic arbors, and therefore this suggested to him that there was directionality in the flow of information from the cell body, down the axon, and into the dendrite.
Introduction: Chapter I These key anatomical observations led to the law of dynamic polarization, and in 1906, together with Golgi, a Nobel Prize in Medicine and Physiology.
It was not until the work of Cajal’s Spanish colleague Pio del Rio Hortega (1882-1945), along with the help of the Canadian neurosurgeon Wilder Penfield (1891-1976), that the myelinating cells of the central nervous system would be visualized. Utilizing a new staining method, Hortega was able to describe in 1921 cells called “oligodendrocytes”, which are derived from the Greek words “oligo” meaning “few”, “dendro” meaning tree, and “cyte” meaning cell. Yet, Hortega was unable to come up with a functional role for these cells.
Further developments, such as electron microscopy and electrophysiological
techniques, in the mid 20th century allowed us to understand the intimate
relationship between myelinating glia and the axon, and the functional proprieties of the neuron. Electron microscopy work by Richard and Mary Bunge allowed for visualization of the interaction between myelinating glia and the axon. Important electrophysiological work detailed the presence of voltage-gated ion channels along the neuronal membrane, and provided further information regarding the location of axon potential initiation and direction of electrical conduction (further discussed in chapter II).
Today, we now know that the myelinated fiber is indeed a highly specialized structure comprised of several subspecialized domains with important functions. The AIS is responsible for initiation of the electrical nervous signal called the action potential (AP) (Palmer and Stuart, 2006; Khaliq and Raman, 2006; Meeks and Mennerick, 2007; Shu et al., 2007; Hu et al., 2009; Popovic et al., 2011) and maintenance of neuronal polarity (Hedstrom et al., 2008; Sobotzki et al., 2009; Galiano et al., 2012), while nodes of Ranvier, together with the myelin sheath, are important for rapidly and efficiently propagating that signal down the nervous fiber (Poliak and Peles, 2003; Salzer, 2003; Sherman and Brophy, 2005).
Introduction: Chapter I 1.2 Structure and molecular composition of myelinated nerve fibers
1.2.1 The myelin sheath
One of the last evolutionary steps of the vertebrate nervous system was myelination of axons by glial cells nearly 420 million years before present in jawed fish (Zalc et al., 2008). The myelin sheath is a lipid rich multilamellar structure that wraps around axonal membranes. Originally described by Rudolf Virchow (1821-1902) in 1854 as a substance produced by neurons, we now know that myelin is produced in the central nervous system (CNS) and peripheral nervous system (PNS) by oligodendrocytes and Schwann cells, respectively. Oligodendrocytes are able to envelop several axons simultaneously, while Schwann cells wrap individually around one axon (for review see Sherman and Brophy, 2005).
The myelin sheath provides numerous functional benefits to the neuron. Firstly, one important specialized function of myelin is to provide vertebrates with a means to greatly increase neural conduction along axons through electrical insulation. The compacted myelin sheath allows vertebrate axons to conduct action potentials in the order of 50 to 100 times in magnitude faster than that of the non-myelinated invertebrate axon (Zalc and Colman, 2008). Indeed, this insulating function of myelinating glia has major implications, and will be revisited in chapter II.
Another important function of myelinating glia is that they provide trophic support to neurons. Since glial cells cover large portions of the axonal surface with myelin, the axonal surface has a very limited area only in the breaks between myelinating segments where it is able to interact with extracellular metabolites (Nave et al., 2010). Recent reports have made strides in uncovering the trophic support roles of myelinating glia (Funfschilling et al., 2012; Lee et al., 2012). Funfschilling et al. (2012) reported that oligodendrocytes are able to provide nutritional support to neurons via lactate transport, suggesting that myelinating glia impart an important role in meeting the metabolic demands of the neuron.
Introduction: Chapter I Finally, myelin also provides a protective covering around axons. In conditions where myelin destruction occurs, called demyelination, neurons are vulnerable to axonal damage. This further damage to the axon could be the result of lymphocytes or related cytokine-induced cytotoxicity or dysfunction of axonal ion channel homeostasis, which in turn leads to neurodegeneration (Friese et al., 2014).
1.2.1.1 Myelinated Regions and Structure
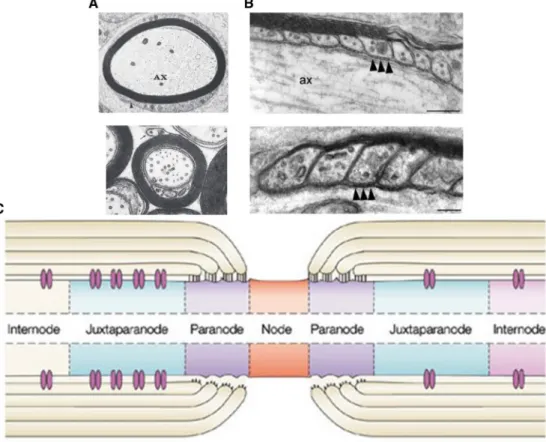
Several experimental advances, particularly those in electron microscopy, have advanced our knowledge of myelin structure. PNS Schwann cells and CNS oligodendrocytes wrap extensive spirally myelinating sheaths around axons that eventually become thinner through compaction (Fig. 1A). Compacted alternating double membrane leaflets of membrane with a periodicity of 12 nm that are electron-dense and electron-light are resolved through electron microscopy (Aggarwal et al., 2011). The thicker electron-dense region resulting from the apposition of two internal faces of the lipid bilayer is called the major dense line, while the thinner electron-dense layer resulting from the apposition of two external myelin wraps is the intraperiod line.
Specific regions along the internal myelinating segment, called the internode, remain uncompacted. In the PNS, Schmidt-Lanterman incisures are small regions of cytoplasm that remain during the Schwann cell myelination process. These regions are important because they allow for communication and exchange of metabolites between the superficial and deep layers of myelin with the Schwann cell cytoplasm. Additionally, an uncompacted portion at the extremity of each myelin lamellae, called a paranodal loop (Fig. 1B), in both CNS and PNS myelinating segments organize to form the paranode (Fig. 1C; Aggarwal et al., 2011).
Important to note is that the compacted myelin sheath and the internodal region of the axon are separated by a periaxonal space—but by looking at a
Introduction: Chapter I
Figure 1: Ultrastructure and overview of myelinated domains. (A) Cross section of a myelinated PNS axon (ax) in the top panel and a cross section of a myelinated CNS axon in the lower panel. Adapted from Quarles et al., 2006. (B) Ultrastructure of the paranodal junctions formed between the paranodal loops and the axon in both panels with a higher magnification observed in the lower panel. Of note are the septate-like junctions denoted by the black arrowheads. Adapted from Schaeren-Wiemers et al. 2004. (C) Overview of the myelinated domains along a CNS axon. The domains are similar in the PNS. Adapted from Poliak and Peles, 2003.
Introduction: Chapter I septate-like junctions form at paranodes between the cytoplasmic filled paranodal loops of the myelinating glial cell membrane and axolemma (Fig. 1B). While the paranodal junctions provide an efficient restriction barrier between the voltage-gated sodium channels at nodes of Ranvier and the voltage-voltage-gated potassium channels at the juxtaparanodes, these junctions are permeable to small metabolites and ions (Mierzwa et al., 2010). As we will discuss later, there are a number of cell adhesion molecules (CAMs) located at the paranodal junctions that are implicated in both the formation and maintenance of the macromolecular complex at the nodes of Ranvier.
The section separating the paranode and the internode is the juxtaparanode (Fig. 1C). This region is well defined as a passively excitable region enriched in voltage-gated potassium channels and various CAMs. Further description of these protein classes will be reserved for the section on molecular composition of excitable and axo-glial domains.
1.2.1.2 Myelin Composition
The composition of myelin is unique in that it is a poorly hydrated structure (40% water) that is more enriched in lipids than proteins. Indeed, the dry weight of myelin is between 70-85% lipid compared to 15-35% protein, while in most other cellular membranes it is the reverse. This is not surprising though considering the insulating functions of myelin that permit rapid action potential propagation, which would favor a membrane low in water content and rich in lipids. 1.2.1.2.1 Lipid Composition
The major lipids of the myelin membrane are separated into three groups: glycolipids, cholesterol, and phospholipids. The molar ratios between the three groups of lipids range from 2:4:3 to 2:4:4 (Baumann and Pham-Dinh, 2001). Our discussion, however, will only be limited to the most typical myelin lipids: glycolipids.
Introduction: Chapter I Glycolipids
One group in particular, the galactolipids, dominates the glycolipid family of myelin lipids. The galactolipids galactocerebroside (GalC) and its sulfated derivative sulfatide make up nearly one-third of the total mature myelin lipid mass (Dupree et al., 1998). Galactocerebroside is a lipid composed of galactose and ceramide, enzymatically linked to the first position hydroxyl group by ceramide galactosyltransferase (CGT), while sulfatide is formed from the sulfation of galactocerebroside via the enzyme cerebroside sulfotransferase (CST; Morell and Radin, 1969).
The galactolipids have been intensely studied due to their abundance and early expression in oligodendroglia. Utilizing CGT-null mice (therefore lacking galactocerebroside and sulfatide), several studies have shown that these mice have abnormal myelin ultrastructure, breakdown of the paranodal junctions, and reduction in axonal conduction velocity (Basio et al., 1996; Coetzee et al., 1996; Dupree et al., 1998). Looking more closely at the roles of sulfatide, Pfeiffer and colleagues reported through immunological perturbations that sulfatide has been found to be a key molecule for oligodendrocyte development (Bansal et al., 1988, 1989; Bansal and Pfeiffer, 1989) and it is seen to play a role in the enhanced rate of differentiation in cultured oligodendrocytes (Bansal et al. 1999). Since the studies utilizing CGT mutants could not differentiate the functions between galactocerebroside and sulfatide, a CST-deficient mouse was developed. Using this mouse, Honke et al. (2002) and Marcus et al. (2006) reported that sulfatide was necessary for proper paranodal junctions structure and maintenance. Together, these results suggest that sulfatide is an important regulatory molecule in OL development and in maintaining myelin structure.
1.2.1.2.2 Protein Composition
As stated earlier, proteins comprise a lower fraction of mature myelin dry weight; however, they are important because they are specific for myelin and glial
Introduction: Chapter I cells. In this context, the protein composition of oligodendrocyte myelin is mainly comprised of myelin basic protein (MBP) and proteolipid protein (PLP), while Schwann cell myelin is primarily composed of P0 and peripheral myelin protein 22.
While there are large variety of myelin proteins, the following section will be dedicated to four specific proteins: proteolipid protein (PLP), myelin basic protein (MBP), 2’,3’-cyclic-nucleotide 3’phosphodiesterase (CNPase), and myelin-associated glycoprotein (MAG). Other myelin protein components that are involved in axo-glial junction formation will be described in the section on molecular composition of excitable and axo-glial domains.
Proteolipid proteins (PLP and DM-20)
The largest proteinaceous component of CNS myelin is PLP. PLP is a low molecular weight glycoprotein with four hydrophobic alpha helical transmembrane segments, and both C- and N- termini localize at the intraperiodic lines of myelin (Baumann and Pham-Dinh, 2001). The mRNA can go through alternative splicing and gives rise to another isoform called DM-20. PLP is normally expressed in mature oligodendrocytes, but the DM-20 isoform has been observed to be expressed in a subpopulation of OPCs (Spassky et al., 2001). Through genetic ablation studies of the PLP gene, PLP and DM-20 do not appear to be necessary for either myelination or myelin compaction (Klugmann et al., 1997). However, these mutant lines show reduction in the physical stability of myelin, suggesting that PLP/DM-20 play a role in stabilizing the myelin membrane (Boison et al., 1995). Further studies also suggest that PLP/DM-20 play a role in neuronal integrity since in both mice and patients that lack PLP, axonal swellings and ultimately axonal degeneration occur (Griffiths et al., 1998; Garbern et al., 2002).
Myelin Basic Protein (MBP)
MBP, which constitutes 30% of protein, rounds out the second largest component of CNS myelin proteins. MBP has several isoforms through alternative
Introduction: Chapter I MBP protein family (Baumann and Pham-Dinh, 2001). MBP is located in the cytoplasmic region of the major dense line of compact myelin, and its localization to these regions is important since the MBP-deficient shiverer mouse display hypomyelination and absence of the major dense line in CNS myelin (Privat et al., 1979).
2’,3’-cyclic-nucleotide 3’phosphodiesterase (CNPase)
CNPase constitutes 4% of the myelin proteins in the CNS. In vitro, CNPase has been observed to hydrolyze 2’, 3’-cyclic nucleotides, an artificial substrate that does not exit in nature since in living species nucleotides are cyclized in 3’-5. The expression of CNPase is notably absent from compact myelin, but it is expressed in the cytoplasmic cell membrane of oligodendrocytes and in the paranodal regions of the myelinated sheath. Functions of CNPase remain elusive; however, oligodendrocytes overexpressing CNPase have aberrant myelin sheaths (Gravel et
al., 1996), and loss of CNPase has been shown to affect paranodal junctions
(Rasband et al., 2005) and axonal integrity without any obvious effect on myelination (Lappe-Siefke et al., 2003).
Myelin-Associated Glycoprotein (MAG)
At around 1%, MAG represents a relatively small fraction of the protein content found in CNS myelin. MAG is a transmembrane protein that contains a large extracellular domain with five segments of internal homology that resemble immunoglobulin domains (Salzer et al., 1987). In the CNS, MAG is enriched in the periaxonal domains of myelinating oligodendrocytes. Myelin appears to be normal in MAG-deficient mice; yet, MAG mutant mice have a slight delay in myelin compaction (Montag et al., 1994).
1.2.1.3 Oligodendrocyte differentiation and myelination
The differentiation of migrating and proliferating oligodendrocyte precursor cells (OPC) to myelinating oligodendrocytes (OL) can be defined
Introduction: Chapter I morphologically and through expression of specific antigenic markers that are either kept or lost throughout its lineage. Through the sequential expression of these biochemical markers, the oligodendroglial differentiation process is categorically subdivided into six defining stages: Oligodendrocyte progenitor, oligodendrocyte precursor cell (OPC), pre-oligodendrocyte, immature oligodendrocyte, non-myelinating mature oligodendrocyte, and myelinating oligodendrocyte (Fig. 2A).
Both in vitro and in vivo, early OPCs are morphologically defined by their
bipolar shape and are further defined by their surface expression of PDGFRα
(platelet derived growth factor receptor alpha; Pringle and Richardson, 1993), the chondroitin sulfate proteoglycan NG2 (neural/glial antigen 2; Nishiyama et al., 1999), and the ganglioside A2B5 (Raff et al., 1983). At this stage OPCs are highly proliferative and migratory. OPCs then progress into the pre-OL stage where they are morphologically defined by their multiple processes and surface expression of O4 (sulfatide; Bansal and Pfeiffer, 1989). The pre-OLs are less migratory, but remain proliferative at this stage since they are receptive to the mitogenic properties of PDGF (Barres et al., 1992, 1993). Once losing their proliferative capacities, the pre-OLs transition into the highly branched immature OLs. The immature OLs begin to express new markers such as O1 (GalC), CNP (Zalc et al., 1981), and the tumor suppressor protein APC (adenomatous polyposis coli; Bhat et
al., 1996). The maturation process of the immature OL then continues over the next days (3-5) where they become further arborized and begin to express specific myelin proteins such as PLP, MAG, and MBP (Martini and Schachner, 1986). The stage of the non-myelinating OL then begins, defined by their flat sheets of myelin membrane and establishment of axonal contacts. The final step is transitioning into myelinating OLs that wrap axonal processes and express the molecular marker MOG (Solly et al., 1996).
Once oligodendrocytes reach a mature state, they begin to myelinate several axons. Surprisingly, this process occurs very rapidly over a short period of
Introduction: Chapter I
Figure 2: Oligodendrocyte lineage and myelination. (A) Oligodendrocytes express several markers that define their lineage from an oligodendrocyte precursor to a myelinating oligodendrocyte. Adapted from Dr. Sarah Moyon. (B) Oligodedrocytes have a finite window in which that must initiate the myelination process. This is followed by retraction of some myelin sheaths and stabilization of the number of myelinated segments. Adapted from Czopka et al., 2013.
Introduction: Chapter I time (Fig. 2B, Watkins et al., 2008; Czopka et al., 2013). In fact, it is in the order of several hours (Czopka et al., 2013). Utilizing the zebrafish (Danio rerio) model system, Czopka et al. (2013) demonstrated that oligodendrocytes produce new myelin sheaths in a time window of around five hours, and afterwards oligodendrocytes change their behavior by stopping the production of new sheaths (Fig. 2B). Changes following this window are retractions of very few myelinated sheaths for about 1 to 2 days (Czopka et al., 2013). These results suggest that the time window for myelin production is an intrinsic feature to the oligodendrocyte. 1.2.2 The Nodes of Ranvier (Nodes)
The first studies laying the foundation for nodes of Ranvier began with Louis-Antoine Ranvier’s histological work in 1871. While working alongside Claude Bernard at Collège de France, Ranvier embraced Bernard’s approach in cellular nutrition. In Ranvier’s view, the impermeability of the myelin sheath prevented the exchange of nutrient materials between the nerve fiber and oxygenated blood, and therefore begged the question: How does nutritional exchange between the myelinated nerve and the blood occur? To Ranvier, it was through the short non-myelinated regions between myelinating sheaths called “étranglements annulaires”.
Meticulously detailed in one of his first pioneering histological manuals entitled, “Leçons sur l’histologie du système nerveux” (Ranvier, 1878), Ranvier showed that an aqueous solution of ammonium picrocarminate was able to first enter through discrete regions along rabbit sciatic nerves, which he called “étranglements annulaires” (or “annular constrictions”), and then diffused along the nerve fiber. Additionally, by using rat thoracic nerves stained with reduced sodium nitrate solution, Ranvier then further observed what he described as “small black crosses” located at the same regions as the “annular constrictions” (Fig. 3B and C; Ranvier, 1878). He postulated that these regions, which now bear his name as the nodes of Ranvier, could therefore be important for nutrition of the nerve cell (Ranvier, 1878).
Introduction: Chapter I
Figure 3: Louis-Antoine and his drawings of the “étranglements annulaires”. (A) Portrait of Louis-Antoine Ranvier. (B) and (C) Original drawings of sciatic nerves stained with silver nitrate by Ranvier’s talented artist, M. Karmanski. Adapted from Ranvier, 1878.
Introduction: Chapter I However, it was not until Ranvier’s later work on nerve degeneration where he interpreted their true main role in nerve conduction. Utilizing a living rabbit with
both sciatic nerves denuded, he exposed one nerve to pure water at 56oC and the
other with 1 to 200 concentration of salt water at the same temperature (Ranvier, 1878). He observed that in the nerve exposed to pure water, the myelin sheath swelled and the nodes of Ranvier disappeared, resulting in a loss of nerve function by either mechanical or electrical stimulation after 20 minutes. While he still observed similar histological changes to the nerve exposed salt water, the nerve was still excitable through mechanical or electrical stimulation after five hours, thus suggesting to Ranvier that the nodes of Ranvier may be implicated in nerve conduction (Ranvier, 1878; Barbara, 2007).
1.2.2.1 Nodal Ultrastructure
As mentioned previously in the introductory portion of this section, Ranvier’s description of the nodes of Ranvier was made through various chemical staining procedures, but the continual development of electron microscopy and the freeze-fracture technique have further allowed us to look more closely at both the ultrastructure of the nodal axolemma and its external axoplasm. Because the PNS and CNS nodes of Ranvier vary slightly in their overall ultrastructural architectures, the first section will highlight the similarities shared between the two nervous systems, and the second will discuss their dissimilarities, in particular at the extranodal space, in order to provide further clarity on their ultrastructural differences.
The Similarities in Nodal Ultrastructure
Typically, the size of the node of Ranvier itself ranges between 1.0-2.0 µm (Salzer, 2003). The axonal diameter at the nodes of Ranvier is reduced in size by around one half compared to the internode, but the nodal axonal caliber is slightly larger than that of the paranodal region (Landon and Williams, 1963). As the
Introduction: Chapter I Samorajski, 1970), this size difference mainly demonstrates the reduction in the mean number of neurofilaments found at the node of Ranvier, and also the reduced post-translational phosphorylation of lysine-serine-proline repeats that occurs extensively along the neurofilament chain (Pannese, 2015; Salzer, 2003). However, even though there are fewer neurofilaments, their number per unit area of axoplasm at both the nodes of Ranvier and internode are similar (Pannese, 2015), suggesting a higher order packing arrangement of neurofilaments at the nodes (Salzer, 2003). Interestingly, the number of microtubules increases at the node of Ranvier, and it has been furthermore observed that there are a number of fasciculated microtubules, which are notably observed at the AIS, at the proximal ends of nodes of Ranvier in sensory and motor axons in the spinal root (Nakazawa and Ishikawa, 1995). This latter result suggests that cross-linking proteins that are necessary for microtubule fasciculation are also transported to proximal nodes.
Along with the microtubule densities, there are a number of membranous organelles that are associated to the microtubule tracks, and elements of smooth endoplasmic reticulum (Pannese, 2015). Lysosomal vesicles have been observed near the nodal axolemma, where they are suggested to play a role in nodal protein turnover (Zagoren, 1984). Inversely to lysosomal vesicles, exocytotic vesicles are also observed at the node of Ranvier, and most likely play an important role for docking nodal proteins to the developing node of Ranvier (Wiley-Livingston and Ellisman, 1980). Furthermore, studies on the rhesus monkey occulomotor nucleus have also shown that there are synaptic vesicles present where nodes of Ranvier make synaptic contact with dendrites (Waxman, 1974).
Beneath and slightly separated from the nodal axolemma is an electron-dense granular cytoplasmic undercoating of around 25-35 nm that ends at the paranodal junction (Salzer, 2003). This osmiophilic layer, which is also present at the AIS, is thought to be specific to regions with excitable domains and speculated to play a role in neuronal excitability (Waxman and Quick, 1977). Additionally, as these regions are enriched in scaffolding proteins that anchor voltage-gated
Introduction: Chapter I channels to the actin cytoskeleton, this layer most likely corresponds to a dense cytoskeletal network of ankyrins and spectrins (Rosenbluth, 1983).
The development of the freeze fracture technique has furthered our understanding of the node of Ranvier axolemmal ultrastructure. Notably, Rosenbluth (1976) showed that a high density (in the order of 1200/µm2) of 20 nm
sized intramembraneous particles were accumulated on the E-face of the nodal axolemma in frog brain (Fig. 4A). As voltage-gated ion channels and ATPases are highly enriched at the nodal axolemma in both the PNS and the CNS, it was speculated that these particles corresponded to either voltage-gated sodium channels or Na+/K+-ATPases (Rosenbluth, 1976). However, in support of the former
conclusion, the concentration of these large particles is significantly higher at the nodes compared to the paranodal and internodal regions (which have a relatively low concentration in Nav channels; Rosenbluth, 1976), and that ATPases are mainly
found at the P-face of the nodal axolemma. This was partially confirmed through raising antibodies against the voltage-gated sodium channel and using either binding assays or immunocytochemistry to show that Nav is indeed enriched at the
nodes (Richie and Rogart, 1977; Ellisman and Levinson, 1982; Haimovich et al.,
1984), and the diffuse pattern of immunolabeling of all Na+/K+-ATPase subunits
along myelinated axons in the PNS and CNS (McGrail et al., 1991; Gerbi et al., 1999).
Differences in PNS and CNS Nodal Ultrastructure
Several defining ultrastructure features of the extranodal space differentiate the PNS and the CNS. In the PNS, the Schwann cell wraps around an axon in a one to one relationship and then forms a tight collar where they eventually meet at the nodes of Ranvier. As these two domains converge, it is easy to see through longitudinal sections that invaginated finger-like projections abutting from the ends of each Schwann cell protrude into the nodal axoplasm (Fig. 4B). These cytoplasm filled projections, called Schwann cell microvilli, vary in size between 50 and 80 nm
Introduction: Chapter I
Figure 4: Ultrastructure of the nodes of Ranvier. (A) Freeze-fracture of frog brain axon. Nodes of Ranvier contain large densities of intramembraneous particles (nR). Glial loops are denoted by (G). Adapted from Rosenbluth, 1976. (B) PNS nodal ultrastructure of a mouse sciatic nerve. Connective tissue and basement membrane (BM) covers the surface of a Schwann cell (SC). Microvilli (Pr) invade the nodal region. Myelin (My) covers the axon and SC form junctions (X) with the axon. The axoplasm contains neurofilaments (Nf), mitochondria (M), and endoplasmic reticulum (ER). Adapted from Porter and Bonneville, 1973. (C) CNS nodal ultrastructure of rat basal ganglion. Dense coating (D) is observed at the nodes of Raniver, which are flanked by paranodal loops (P) of the myelinating oligodendrocyte. The axoplasm contains neurofilaments (nf), mitochondria (m) and smooth endoplasmic reticulum (SR). Adapted from Peters et al., 1976.
Introduction: Chapter I in diameter (depending on species) and contain longitudinal filaments of around 10 nm (Landon and Williams, 1963). Typically, these Schwann cell microvilli are densely packed at the extranodal space, and are separated 3-5 nm away from the nodal axolemma (Zagoren, 1984). The functional significance of Schwann cell microvilli has only until recently been elucidated, and will be further discussed in chapter III. Another ultrastructural feature of the PNS node is a basal lamina consisting of proteoglycans that extends continuously along the axonal fiber (Landon and Hall, 1976). Importantly, this basal lamina does not impede the movement of ions across the nodal axolemma (Landon and Hall, 1976). Furthermore, between the basal lamina and the nodal axolemma is a filamentous matrix. Both this material and the basal lamina have been thought to play a role in buffering ions and acting as a cation reservoir (Landon and Langley, 1971). Indeed, there is an abundance of aggregated heparin sulfate proteoglycans (HSPGs) at the PNS nodes of Ranvier, and their identification and respective roles will be discussed later in the molecular composition of the AIS, nodes of Ranvier and outerlying domains.
Clearly differentiating CNS nodes from PNS nodes are the evident lack of Schwann cell microvilli and a basal lamina (Fig. 4C). The perinodal junctions between the axon oligodendroglial myelin wraps do not give rise to microvilli. Instead, occasionally replacing the microvillar processes are perinodal astrocytes (or otherwise called synantocytes; Butt et al., 2002), which have been shown through immunogold labeling to contact the nodes of Ranvier in rat optic nerve (Ffrench-Constant et al., 1986) and by confocal microscopy in the anterior medullary velum (Butt et al., 2002). Furthermore, the lack of basal lamina exposes CNS nodes to the extracellular space that is also occupied by a filamentous extracellular-matrix (ECM).
In further discussing the ultrastructural differences between the PNS and CNS nodes, it is worth revisiting the subject of organelles. A more debated subject regarding organelles is the presence and enrichment of mitochondria between the
Introduction: Chapter I are mitochondria located at PNS nodes (Berthold, 1978; Fabricius et al., 1993), and more recently it has been shown that the density of mitochondria at PNS nodes and paranodes is greater than the internodal region (Perkins and Ellisman, 2011). On the other hand, in the CNS, it has been described that there are either similar densities of mitochondria in the nodal, paranodal and internodal area (Edgar et al., 2008), or there is a notable absence of mitochondria at the nodes altogether (Edgar
et al., 2008; Kidd et al., 2011; Ohno et al., 2011). These differences may point to two different possibilities: 1.) The motility of these organelles—large mitochondria remain stationary at points of high-energy consumption such as paranodal regions enriched in Kv channels and Na+/K+ ATPases, while small motile mitochondria
freely move through the axon to regions where they may needed. 2.) An interesting hypothesis outlined in Zhang et al. (2010), and in relation to the aforementioned possibility, suggests that the differences in mitochondrial localization in the PNS and CNS is related to differential Ca2+ signaling along axons. CNS axons display
spatially uniform Ca2+ signaling, while in the PNS it is localized to the nodes of
Ranvier, and in turn, recruits mitochondria to the nodal region (Zhang et al., 2010). Nevertheless, as most of these studies were done through immunofluorescence/electron microscopy or short time-lapse imaging, the conclusions inferred from these studies may therefore only represent a “snap-shot” of the true distribution of these mobile organelles. This question may be partially resolved by looking at the distribution of mitochondria during developmental formation of PNS and CNS nodes through long time-lapse imaging.
1.3 Molecular Composition of Excitable and Axo-Glial Domains
Through the use of various biochemical tools, our understanding of the molecular composition of the excitable domains has expanded from just that of the voltage-gated ion channel. There exists a large repertoire of cell-adhesion molecules, cytoskeletal scaffolding proteins, and extracellular matrix proteins at the AIS, the nodes, and their surrounding regions (see Fig. 5 for a general overview). As these varying protein classes are located at multiple regions along the axon, this section
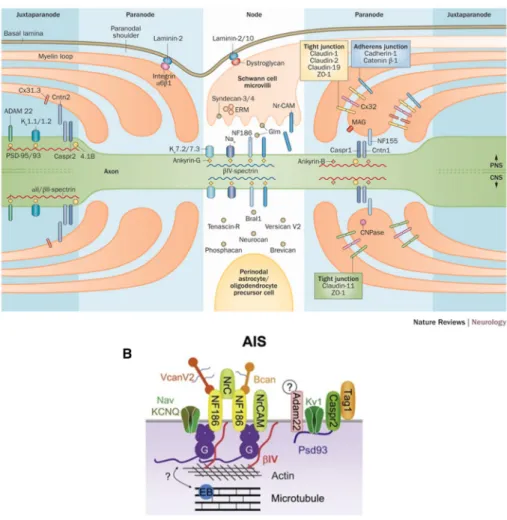
Introduction: Chapter I
Figure 5: Overview of the molecular architecture of the CNS and PNS excitable domains and perinodal domains. (A) Detailed schematic of PNS and CNS nodes of Ranvier. From Stathopoulos et al., 2015. (B) Detailed schematic of the axon initial segment (AIS). Adapted from Chang and Rasband, 2013.
Introduction: Chapter I will take an in depth look at each of these protein classes and detail their distribution at the AIS, and PNS and CNS nodes of Ranvier, paranodes and juxtaparanodes. Furthermore, where permitted, the roles of certain molecules with respect to the AIS, juxtaparanodal, and paranodal assembly or maintenance will be described. The main roles of paranodal, ECM, and nodal components in the assembly of PNS and CNS nodes of Ranvier will be reserved for chapter III.
1.3.1 Voltage-Gated Ion Channels
The first experimental studies detailing the presence of voltage-gated ion channels came in the 1930s by John Z. Young (1907-1997) on the squid axon. Later seminal work by Hodgkin (1914-1998), Huxley (1917-2012) and Katz (1911-2003) in the 1950s and Hille in the 1960s detailed a movement of sodium and potassium ions through axonal pores, affirming the presence of voltage-gated ion channels in nervous cells. Since then, a tremendous amount of effort has gone into elucidating the different voltage-gated ion channels, their subtypes, and their temporal and spatial distributions in the nervous system. At both the AIS and at nodes of
Ranvier, the expression of both voltage-gated sodium (Nav) and potassium (Kv)
channels has been observed. At these regions, Nav channels play an essential role in
action potential initiation and propagation, while Kv channels function to modulate
action potential initiation and alter axonal conduction. Interestingly, a subset of Kv
channels is restricted to the juxtaparanodal region where they regulate the internodal resting membrane potential. This section will outline the different ion channel subtypes, their subunits, and their temporal and spatial distribution at the AIS, CNS and PNS nodes of Ranvier, and juxtaparanodes.
1.3.1.1 Voltage-Gated Sodium Channels (Nav)
Alpha subunits
The SCNA family encodes for ten different sodium channel α-subunit
isoforms (Fig. 6B). Structurally, the α-subunit forms a pore containing four
homologous domains (I-IV), each consisting of six transmembrane α-helical
Introduction: Chapter I
Figure 6: Structure and distribution of mammalian voltage-gated sodium channel
α-subunits. (A) General structure of the voltage-gated sodium channel. Adapted
from Lai and Jan, 2006. (B) Table of the mammalian voltage-gated sodium channel
Introduction: Chapter I 6A; Catterall, 2012). The S4 segment of each homologous domain permits the activation of the α-subunit, while the intracellular loop connecting the III and IV
homologous domain is responsible for inactivation of the α-subunit during sustained
depolarization (Catterall, Goldin, and Waxman, 2005).
Six neurotoxin receptor sites have been found on the sodium channel
α-subunit, and thereby make them sensitive to pharmacological inactivation or activation with drugs such as tetrodotoxin, α- and β-scorpiotoxin, and saxotoxin.
These agents act upon various regions of the α-subunit, and some in particular act
in a stoichiometric 1:1 ratio (i.e. saxotoxin). Using these drugs has not only given us better understanding of sodium channel function, but has also been cleverly exploited in order to isolate and uncover the expression patterns of α-subunits. By
using 125I-labelled scorpion toxin, Beneski and Catterall (1980) isolated 260-kDa
and 30-40 kDa fragments from neuroblastoma cells. The larger fragment was later
found to correspond to the α-subunit of the sodium channel, while the smaller
fragment would be the ß-subunit (Hartshorne and Catterall, 1984; Messner and Catterall, 1985). Together, the voltage-gated sodium channels forms a heterotrimeric complex of α- and β-subunits, wherein one α- subunit is linked to two
different β-subunits (Messner and Catterall, 1985; O’Malley and Isom, 2015). A
summary of the expression of the 10 different sodium channels can be found in the table in Figure 6B. Discussion will be limited to the three main sodium channel
α-subunits shared between the CNS and PNS nodes of Ranvier: Nav1.1, Nav1.2 and
Nav1.6
Nav1.1
Nav1.1 has seen to be highly enriched at the AIS in the mammalian CNS, and
at nodes of Ranvier in the rodent CNS and PNS (Fig. 7A and C; Ogiwara et al., 2007; Van Wart et al., 2007; Duflocq et al., 2008; Lorincz and Nusser, 2008; O’Malley et al., 2009; Luo et al., 2014; Tian et al., 2014). Primarily, enrichment of Nav1.1 in the mouse spinal cord appears at P7 at the AIS and at P14 in CNS nodes
Introduction: Chapter I compartments in adulthood (Duflocq et al., 2008). In mouse PNS nodes of Ranvier, Nav1.1 is observed to be present at P2, peaks at P5, decreases rapidly at P7, and
then is absent at P21 (Luo et al., 2014). In rodent adult spinal cord and retinal ganglion cells, Nav1.1 is primarily enriched at the proximal region of the AIS (Fig.
7B; Van Wart et al., 2007; Duflocq et al., 2008; Lorincz and Nusser et al., 2008); however, Nav1.1 distribution is homogenous at the AISs of short axon cells of the
olfactory bulb (Lorincz and Nusser et al., 2008). Interestingly, Nav1.1 is enriched
exclusively in GABAergic interneurons at the AIS in both rodent and human cortex and at nodes in the rodent hippocampus (Ogiwara et al., 2007; Lorincz and Nusser
et al., 2008; Tian et al., 2014). Nevertheless, Nav1.1 AIS and nodal enrichment has
also been observed in adult mouse retinal ganglion cells and optic nerve, respectively (Van Wart et al., 2007; O’Malley et al., 2009).
Additionally, Nav1.1 is functionally involved in action potential initiation,
conduction and repetitive neuronal firing (Catterall et al., 2005). Mutations or deletions of the SCN1A gene have furthermore been observed to play a pathophysiological role in causing generalized epilepsy with febrile seizures plus and severe myoclonic epilepsy in infants (Catterall et al., 2005), in which the latter may be related to a reduction in sodium current or spike firing in GABAergic interneurons (Kalume et al., 2007; Ogiwara et al., 2007).
Nav1.2
Nav1.2 is expressed early at the immature AIS (Fig. 7A) and is preferentially
accumulated in a proximal-distal gradient in mammalian AISs (Hu et al., 2009, Tian et al., 2014). Due to its high-threshold and preferential enrichment at the
proximal AIS, Nav1.2 is believed to play a functional role in action potential
backpropagation towards the soma (Hu et al., 2009).
Beyond the AIS, axonal expression of Nav1.2 has been shown to be diffuse
along rat unmyelinated hippocampal mossy fiber and Schaffer collateral tracks, and along unmyelinated zones of rat retinal ganglion cell axons (Westenbroek et al.,
Introduction: Chapter I
Figure 7: Immunolocalization of Nav subunits at the AIS and nodes of Ranvier. (A)
Expression of Nav1.1, Nav1.2, and Nav1.6 at the AIS of cortical neurons in human
tissue. Adapted from Tian et al., 2014. (B) Nav1.1 (red) is restricted to the proximal
portion of the AIS, while Nav1.6 is present at the distal AIS. Adapted from Duflocq
et al., 2008. (C) Colocalization of Nav1.1 (red) and Pan Nav (green) at nodes of
Ranvier in adult spinal cord (yellow arrows). Of note, some nodes of Ranvier are Nav1.1-negative (green arrows). Adapted from Duflocq et al., 2008. (D) Nav1.2
immunolabeling (red) at the developing sciatic nerve. Arrowheads represent two heminodal clusters converging to form a node and the full arrow denotes a heminodal cluster flanked by Caspr (green). Adapted from Rasband and Trimmer 2001. (E) Immunolabeling of nodal Nav1.6 (red) flanked by Caspr (green) in the
Introduction: Chapter I 1992, Gong et al., 1999, Boiko et al., 2001). However, enrichment of Nav1.2 has been
observed in node-like clusters along rat retinal ganglion cell axons in vitro (Kaplan
et al., 2001). In the rodent PNS, Nav1.2 is first detected at nodes at P1 (Fig. 7D),
progressively disappears between P2.5-5, and then is rarely detected between P7-28 (Boiko et al., 2001; Luo et al., 2014). During rat optic nerve development, it has been observed that Nav1.2 is localized to immature nodes and then declines rapidly after
the second postnatal week (Boiko et al., 2001). This nodal Nav1.2 regulation
corresponds to the myelination time course in the rat optic nerve, suggesting that Nav1.2 is replaced at the nodes as CNS myelination proceeds (see chapter III; Boiko
et al., 2001). Conversely, in adult human tissue, Nav1.2 has been observed to be
enriched in a subpopulation of nodes of Ranvier in the cortex (Tian et al., 2014).
Similar to Nav1.1, Nav1.2 is functionally involved in action potential
initiation, conduction and repetitive firing (Catterall et al., 2005). Knocking out the
SCN2A gene in mice results in hypoxic perinatal death and a sharp attenuation of sodium channel currents in mouse hippocampal cultures (Catterall, Goldin, and Waxman, 2005; Planells-Cases et al., 2000). Point mutations of SCN2A have also been observed in a Japanese patient, which resulted in febrile and afebrile seizures (Sugawara et al., 2001)
Nav1.6
Axonal expression of Nav1.6 at the AIS appears to be late compared to its
Nav1.2 counterpart in the rodent (Boiko et al., 2003). Juxtaposing Nav1.2, Nav1.6 is
preferentially enriched at the distal end of the AIS in rodent and human AISs (Fig. 7B; Van Wart et al., 2007; Hu et al., 2009, Tian et al., 2014); however, Nav1.6 AIS
expression is uniform in rat layer 5 pyramidal neurons (Lorincz and Nusser, 2008). Electrophysiological experiments have reported that distal enrichment of low-threshold Nav1.6 is important for electrogenesis since its spatially enriched location
at the AIS determines action potential initiation (Hu et al., 2009).
Introduction: Chapter I (Fig. 7E; Caldwell et al., 2000; Krzemien et al., 2000; Tzoumaka et al., 2000; Black
et al., 2002; Luo et al., 2014). The time course of rodent CNS nodal Nav1.6 clustering
appears to coincide with myelination (Kaplan et al., 2001; Boiko et al., 2001). Indeed, Nav1.2 is localized to immature nodes of Ranvier in rat optic nerve, which
progressively gets replaced by Nav1.6 as myelination proceeds (see chapter III,
Boiko et al., 2001).
Functionally, Nav1.6 plays a central role in axon potential generation and
conduction, resurgent and persistent current in Purkinje cells, and tunes the spike timing of cerebellar granule cells (Catterall et al., 2005; Raman et al., 1997; Osorio
et al., 2010). Mutations to the gene encoding for Nav1.6 in mice result in disrupted
firing patterns of Purkinje cells, development of motor endplate disease, and causes cerebellar ataxia (Catterall et al., 2005).
Beta Subunits
Mammalian sodium channel ß-subunits form a family of five proteins (β1Nav,
β1BNav, β2Nav, β3Nav, and β4Nav) that are encoded by four SCNB genes. Each
isoform contains an N-terminal extracellular Ig-like fold similar to proteins of the Ig superfamily of CAMs, a single transmembrane-spanning segment, and a short
intracellular C-terminus (O’Malley and Isom, 2015). Of note, Nav β-subunits
interact with α-subunits through two different types of interactions: β1Nav and
β3Nav noncovalently interact with α-subunits through their N- and C-terminal
domains, while β2Nav and β4Nav interact with α-subunits through disulfide linkage
of Cys-26 (β2) and Cys-28 or 58 (β4) in the N-terminal Ig-like fold (Chen et al., 2012;
Gilchrist et al., 2013; Buffington and Rasband, 2013; O’Malley and Isom, 2015). Nav β-subunits are described as “auxillary” subunits, but they play critical
roles in regulating the rate of α-subunit activation and inactivation (Patton et al., 1994; Kazen-Gillespie et al., 2000), regulating the amount of resurgent sodium current and sodium current density (Isom et al., 1995; McEwen et al., 2004; Aman et
al., 2009), and trafficking α-subunits and regulating their plasma membrane
β-Introduction: Chapter I subunits have been shown to interact with voltage-gated potassium channels and modulate their activation (Nguyen et al., 2012; Marionneau et al., 2012). Therefore, Nav β-subunits are key players in ion channel functioning and sodium channel
recruitment to regions of excitability. So far, three Navβ-subunit isoforms have been
reported to cluster at the nodes of Ranvier (O’Malley and Isom, 2015): β1Nav, β2Nav,
and β4Nav. This section will discuss these isoforms in detail below.
β1Nav
β1Nav has been reported to be enriched in the mouse at the AIS and nodes of
Ranvier. At the AIS, β1Nav is highly enriched in both glutamatergic neurons and
GABAergic interneurons (primarily somatostatin and parvalbumin+ interneurons),
and associates with Nav1.1, Nav1.2, Nav1.6 in the mouse somatosensory cortex
(Brackenbury et al., 2010; Wimmer et al., 2015). At CNS nodes of Ranvier, β1Nav
has so far been observed in the mouse adult corpus callosum and ventral funiculi of the cervical spinal cord (Wimmer et al., 2015; Desmazières et al., 2014), while in the PNS it has been reported in mouse sciatic nerve nodes starting at P3 and continues into the adult (Ratcliff et al., 2000; Chen et al., 2004; Desmazières et al., 2014).
Like all Nav β-subunits, β1Nav contains an extracellular Ig-like fold domain
that allows it to act as a CAM, thereby permitting β1Nav to interact in trans
homophilic and cis/trans heterophilic interactions. Trans homophilic interactions of
β1Nav permit neurite outgrowth through fyn kinase (Davis et al., 2004;
Brackenbury et al., 2008). Heterophilically, β1Nav can interact with the
extracellular domains of various other nodal and paranodal CAMs such as neurofascin186 and 155 (Ratcliff et al., 2001; McEwen and Isom, 2004), contactin (Kazarinova-Noyes et al., 2001) and NrCAM (McEwen and Isom, 2004). As well,
β1Nav can interact with extracellular matrix proteins such as Tenascin-R (Xiao et
al., 1999), and with other Nav β-subunits such as β2Nav (McEwen and Isom, 2004).
β1Nav can increase the cell surface expression and gating of Nav and Kv
Introduction: Chapter I
depending on the genetic background, cell type, and ion channel α-subunit being
studied (reviewed in Calhoun and Isom, 2014).
β2Nav
In cultured rat retinal ganglion cells (RGCs) and hippocampal neurons,
β2Nav has been observed to be enriched at the level of the AIS (Kaplan et al., 2001;
Chen et al., 2012). Their localization has also been observed at node-clusters in rat hippocampal neurons associated to Nav1.2 (Kaplan et al., 2001), at nodes of Ranvier
in mouse sciatic nerve, and mouse white matter tracts of the cerebellum (Chen et
al., 2002).
β2Nav can be further processed through posttranslational modifications by
γ-secretase cleavage, thereby permitting the intracellular domain to enter the nucleus and increase transcription of Scn1a (Kim et al., 2007). Additionally, β2Nav increases
functional expression of sodium channels, modifies their gating, and increases plasma membrane surface area in Xenopus oocytes (Isom et al., 1995). Along with these reports, β2Nav-/- mice display increased seizure susceptibility, a reduction in
the amount of plasma membrane associated sodium channels and reduced optic nerve conduction, Extracellularly, β2Nav can interact with Tenascin-C (Srinivasan
et al., 1998).
β4Nav
β4Nav, the most recently discovered and least described Nav β-subunit, is
expressed in multiple regions in the adult rat brain and spinal cord (Yu et al., 2003). Subcellular enrichment of β4Nav has also been reported at the AISs of fast-spiking
GABAergic interneurons, and in a subset of rat PNS and CNS nodes of Ranvier (Buffington and Rasband, 2013). These immunohistological observations correlate
with functional electrophysiological studies since β4Nav has been shown to be
associated with resurgent sodium current, which aids in high-frequency repetitive firing (Khaliq et al., 2003; Grieco et al., 2005).
Similar to β2Nav, β4Nav requires a disulfide bond at Cys-28 in order to
Introduction: Chapter I
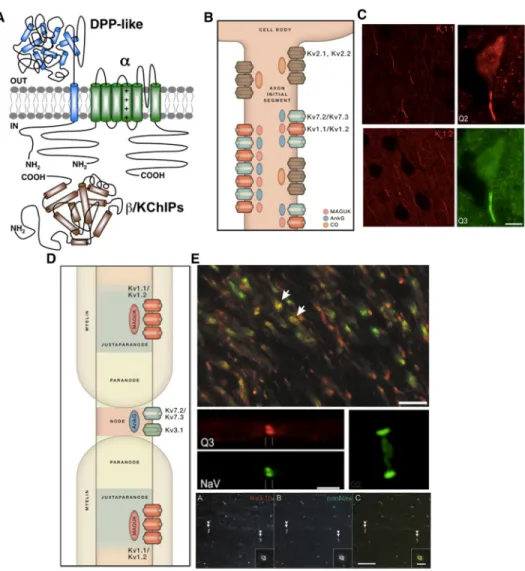
Figure 8: Structure, expression, and localization of voltage-gated potassium channels. (A) Structure of the voltage gated potassium channels. Adapted from Vacher et al., 2008. (B) Overview of the voltage-gated potassium channels at the axon initial segment alongwith their interacting partners. Adapted from Trimmer, 2015. (C) Kv1 and Kv7 localize to the AIS of various regions in the brain. Adapted
from Lorincz and Nusser 2008 and Pan et al., 2006. (D) Overview of the voltage-gated potassium channels at the nodes and juxtaparanodes. Adapted from Trimmer, 2015. (E) Kv1.1 (green) and Kv1.2 (red) are localized to paranodes in the optic nerve
(top panel). Kv7.2 (red, top middle panel) and Kv7.3 (green, middle right panel)
localize to the nodes of Raniver. Kv3.1b (red, bottom pannel) is also a component of
the nodes of Ranvier and colocalize (arrowheads) with Nav (green). Adapted from
Rasband, 2004 (E top panel), Pan et al., 2006 (middle panels), and Devaux et al., 2003 (bottom panels).
Introduction: Chapter I and sodium channel α-subunits are also necessary for β4Nav to localize to the AIS
(Buffington and Rasband, 2013).
1.3.1.2 Voltage-Gated Potassium Channel Alpha Subunits (Kv)
K+ channels comprise the largest and most diverse group of ion channels in
mammals (Trimmer, 2015). Indeed, ~90 genes code for K+ α- and ß-subunits, and
the heteromeric channel pore is often comprised of a combination of different α-subunits and various splice isoforms, thus leading to a wide diversity and complexity in the K+ channel family. Almost half of these 90 genes encode for
voltage dependent potassium channels, which allow for passage of K+ ions via
changes in membrane potential. In vertebrates, 41 genes encode for Kv1 through
Kv12, and each subfamily can be broken down further into a number of different Kv
isoforms (Trimmer, 2015).
The quaternary structure of the Kv channel ion pore is a tetrameric complex
of α-subunits, wherein each α-subunit is comprised of six transmembrane segments
(S1-S6) (Fig. 8A; Vacher et al., 2008). Kv channels are also composed of auxiliary
ß-subunits such as Kvß, KChIP, and DPP-like (Vacher et al., 2008). Of the large
family of Kv channels, only two subfamilies have been observed to be
compartmentalized at the nodes: Kv7 (KCNQ) and Kv3 (Fig. 8D and E).
Interestingly, other Kv channels have been observed (notably Kv1, and more
recently BK/Slo1 channels) at the AIS, paranode, and juxtaparanode (Fig. 8B-E). Our discussion will therefore focus on three families (Kv1, Kv3, and Kv7) in detailing
their subcellular distribution and roles at excitable axonal domains. Kv1
Kv1 is the Shaker-type family (name originated from Drosophila) of
voltage-gated potassium channels that is comprised of eight isoforms (Kv1.1-Kv1.8). Only
Kv1.1, Kv1.2, Kv1.4, and Kv1.5 have been reported to be enriched near or at
Introduction: Chapter I Kv1.1 and Kv1.2 have been extensively studied, and therefore this section will only
detail these two Kv1 subtypes.
Kv1.1 and Kv1.2 are highly enriched in the distal compartment of the AIS in
human neocortical pyramidal cells, and in both excitatory and inhibitory neurons of multiple rat brain regions (Fig. 8C; Inda et al., 2006; Van Wart et al., 2007; Lorincz and Nusser, 2008). Together, Kv1.1 and Kv1.2 are observed to be extensively
co-labeled at the AIS, suggesting that these channels most likely form heteromeric channels (Lorincz and Nusser, 2008). Localization of Kv1.1 and Kv1.2 to the AIS
depends on the interaction with the PDZ (PSD-95/disc large/zonula occludens-1) domain of the MAGUK (membrane associated guaylate kinase) PSD-93/Chapsyn-110 (Horresh et al., 2008; Ogawa et al., 2008).
Kv1.1 and Kv1.2 are both also clustered together as heteromultimers at the
juxtaparanodal regions of the mammalian CNS and PNS myelinated axon (Fig. 8E; Wang et al., 1994; Rasband et al., 1999; Howell et al., 2006). Clustered underneath the myelin sheath and spatially separated from the node by paranodal junctions, these channels most likely regulate the internodal resting potential and diminish repetitive firing (see chapter II; Arancibia-Carcamo and Attwell, 2014). Kv1.1 and
Kv1.2 appear first at the nodes and paranodes during the first postnatal week in
rat, but then subsequently become restricted to the juxtaparanodes between P14 and P28 (Vabnick et al., 1998).
Kv3
Kv3 are a family of four K+ channels isoforms: Kv3.1-Kv3.4. In the rat CNS,
Kv3.1b, one of the two splice variant isoforms of Kv3.1, clusters at nodes of Ranvier
(Fig. 8D and E) but is not enriched at the AIS (Devaux et al., 2003). Kv3.1b first
appears at a few nodes starting at P8 in the ventral column of the spinal cord, and then increases rapidly in expression to a point where it then reaches its adult levels by P12 (Devaux et al., 2003). Furthermore, Kv3.1b clusters at nodes of Ranvier prior
to Kv1.2 clustering at juxtaparanodes, and Kv3.1b appears to be mostly associated