F
INALR
EPORT PHASEI
TOWARDS AN INTEGRATED DECISION TOOL FOR ADAPTATION MEASURES
-
CASE STUDY:
FLOODS«
ADAPT»
SD/CP/02AE.GIRON,I.CONINX,B.J.DEWALS,M.EL KAHLOUN,L.DE SMET,D.SACRE, S.DETREMBLEUR,K.BACHUS,M.PIROTTON,P.MEIRE,R.DE SUTTER,W.HECQ
Climate
Promotors W. HECQ
UNIVERSITE LIBRE DE BRUXELLES (ULB) K. BACHUS
KATHOLIEKE UNIVERSITEIT LEUVEN (K.U. LEUVEN) M. PIROTTON
UNIVERSITE DE LIEGE (ULG) P. MEIRE
UNIVERSITEIT ANTWERPEN (UA) R. DE SUTTER
ARCADIS BELGIUM NV 15/12/06 to 14/12/07
Authors
E. Giron, D. Sacré & W. Hecq, CEESE-ULB I. Coninx & K. Bachus, HIVA - K.U. Leuven B.J. Dewals, HACH-ULG & F.R.S.-FNRS S. Detrembleur & M. Pirotton, HACH-ULG
M. El Kahloun & P. Meire, ECOBE-UA L. De Smet & R. De Sutter, ARCADIS BELGIUM NV
S
CIENCE FOR A SUSTAINABLE DEVELOPMENT
(SSD)
FINAL REPORT (Phase I)
TOWARDS AN INTEGRATED DECISION TOOL FOR
ADAPTATION MEASURES - CASE STUDY : FLOODS
«ADAPT»
SD/CP/02ARue de la Science 8 Wetenschapsstraat 8 B-1000 Brussels Belgium Tel: +32 (0)2 238 34 11 – Fax: +32 (0)2 230 59 12 http://www.belspo.be Contact person: Mrs Sophie Verheyden : +32 (0)2 238 36 12 http://www.ulb.ac.be/ceese//ADAPT/Home.html
Neither the Belgian Science Policy nor any person acting on behalf of the Belgian Science Policy is responsible for the use which might be made of the following information. The authors are responsible for the content.
No part of this publication may be reproduced, stored in a retrieval system, or transmitted in any form or by any means, electronic, mechanical, photocopying, recording, or otherwise, without indicating the reference:
E. Giron, I. Coninx, B.J. Dewals, M. El Kahloun, L. De Smet, D. Sacré, S. Detrembleur, K. Bachus, M. Pirotton, P. Meire, R. De Sutter, W. Hecq. Towards an Integrated Decision Tool for Adaptation Measures - Case Study : Floods «ADAPT». Final Report Phase 1. Brussels : Belgian Science Policy 2009 – 122 p. (Research Programme Science for a Sustainable Development)
TABLE OF CONTENT
List of figures ... 6
List of tables ... 7
I. Acronyms, abbreviations and units ... 8
II. Executive summary ... 9
A. Introduction... 9
B. Effects of climate change in Belgium: general study ... 10
C. Development of a methodology for guiding decisions about adaptation measures to climate change induced flooding ... 11
III. Introduction... 15
A. Context ... 15
B. Objectives ... 15
C. Scientific methodology... 17
IV. Effects of climate change in Belgium: general study... 19
A. Introduction... 19
B. Climate change in an international context ... 19
C. Evidence of climate change in Belgium... 19
D. Primary impacts of climate change ... 20
E. Secondary impacts of climate change... 24
1. Economic aspects ... 24
2. Social aspects ... 28
3. Ecological aspects... 30
F. Conclusions... 33
V. Development of a methodology for guiding decisions about adaptation measures to climate change induced flooding ... 34
A. Introduction and objectives ... 34
B. Overview of the methodology ... 35
1. Flood modeling... 35
2. Flood risk modelling ... 36
3. Identification and selection of adaptation scenarios ... 38
4. Evaluation of adaptation scenarios ... 39
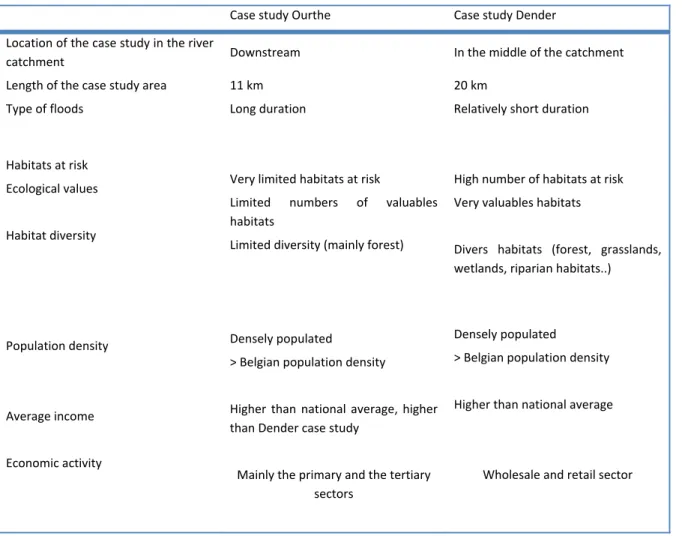
C. Choice and presentation of the case studies ... 40
1. General motivation of the choice of the different case studies ... 40
2. Case study of the Ourthe basin ... 41
3. Case study of the Dender basin... 42
D. Hydrodynamic modelling ... 43
1. Description of the models ... 43
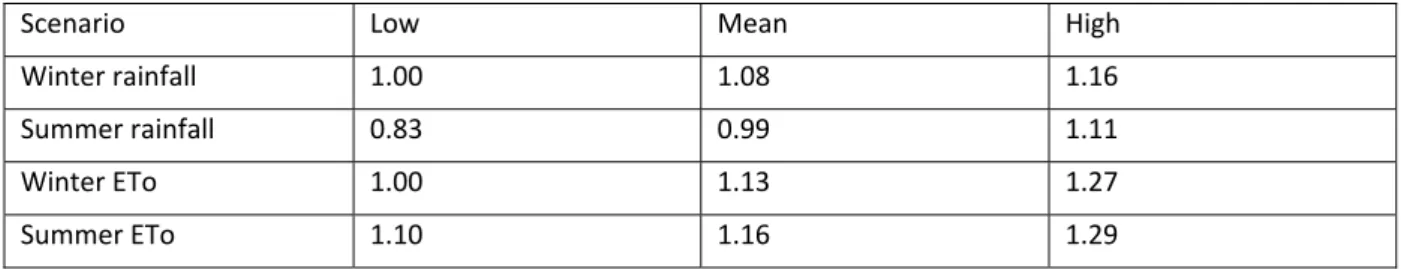
2. Climate change scenarios used ... 47
3. Results of hydrodynamic modelling ... 48
E. Translation of the hydrodynamic modelling results into input for the assessment of secondary impacts ... 50
F. Integration of the effects of adaptation scenarios in a general decision framework... 50
1. Advantages and disadvantages of CBA and MCA based decision frameworks... 51
2. Identification, organization and assessment of the effects of flooding... 52
3. Critical issues related to the integration of economic, social and ecological impacts... 53
4. Description of the method and related actions ... 55
G. Economic risk assessment methodology / Evaluation of economic impacts of climate change induced flooding... 56
1. Scientific methodology... 56
2. (Preliminary) results ... 59
H. Social risk assessment methodology / Evaluation of social impacts of climate change ... induced flooding [HIVA] ... 64
1. Scientific methodology... 64
2. (Preliminary) results ... 66
I. Ecological risk assessment methodology / Evaluation of ecologic impacts of climate change induced flooding... 68
1. Scientific methodology... 68
2. (Preliminary) results ... 71
J. Determining adaptation measures ... 73
1. Categorisation of measures... 74
2. Identification and development of measures ... 76
3. Characterisation of measures ... 77
4. Adaptation scenarios simulated for the case study of river Ourthe ... 78
VI. Preliminary conclusions and recommendations ... 79
A. Conclusions and recommendations on Working Package 1 ... 79
B. Conclusions and recommendations on Working Package 2 ... 79
1. Task 2.1 Evaluation of the impacts on river basins - primary impacts... 79
2. Task 2.2 Evaluation of the impact on river basins – secondary impacts... 80
3. Task 2.3. Determination of adaptation measures... 81
VII. Future prospects and planning... 82
A. Continuation of “Evaluating the primary impact of global change induced flooding on river basins”... 82
2. River Dender... 82
B. Continuation of “Evaluating the secondary impact of global change induced flooding on river basins” ... 82
1. Integration... 82
2. Economic risk assessment methodology ... 83
3. Social risk assessment methodology... 83
4. Ecological risk assessment methodology ... 83
C. Continuation of “Determining adaptation measures” ... 83
D. Evaluating costs of adaptation measures... 84
E. Cost-benefit analysis ... 85
F. Recommendations on adaptation measures ... 85
VIII. User committee... 86
A. Remarks:... 88
B. Summary of main comments made during the first Follow-up committee meeting: ... 88
C. Summary of main comments made during the second Follow-up committee meeting: ... 89
D. Discussion with the members of the follow-up committee during the third Follow-up committee meeting... 89
IX. References ... 91
X. List of publications... 96
A. Publications of the teams... 96
1. Peer review... 96 2. Others ... 96 B. Co-Publications... 97 1. Peer review... 97 2. Others ... 97 XI. ANNEXES... 98
List of figures
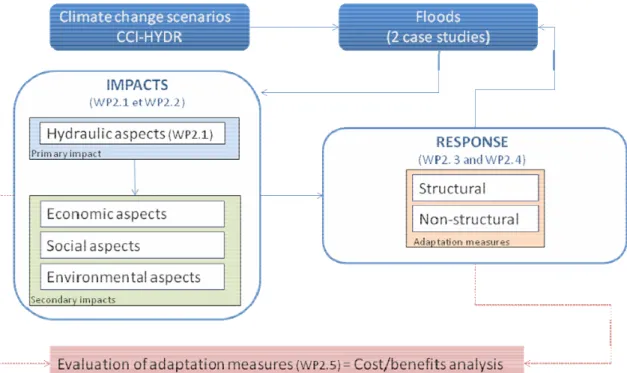
FIGURE 1: OVERVIEW OF THE WHOLE PROCESS... 18
FIGURE 2 EVOLUTION OF THE MEAN ANNUAL TEMPERATURE IN UCCLE OVER THE PERIOD 1833-2005(RMI, 2006)... 20
FIGURE 3: FLOW CHART OF THE ADAPT PROJECT AND ITS LINKS WITH THE CCI-HYDR PROJECT... 35
FIGURE 4: COMPONENTS OF THE FLOOD RISK ASSESSMENT FRAMEWORK... 37
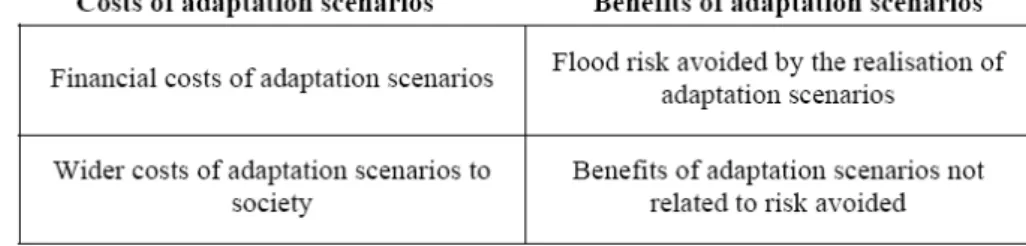
FIGURE 5: OVERVIEW OF COSTS AND BENEFITS OF ADAPTATION SCENARIOS... 39
FIGURE 6 INTERESTS OF THE RIVER OURTHE CASE STUDY FIGURE 7 INTERESTS OF THE RIVER DENDER RIVER CASE STUDY... 40
FIGURE 8 EXAMPLE OF HYDRAULIC MODELLING RESULTS: INCREASE IN WATER DEPTH (A, C, E) AND MAGNITUDE OF FLOW VELOCITY (B, D, F) FOR A 100-YEAR FLOOD IN THE TOWN TILFF FOR THREE DIFFERENT PERTURBATION FACTORS AFFECTING THE DISCHARGE, NAMELY AN INCREASE BY (A, B)5%,(C, D)10% AND (E, F)15%. ... 49
FIGURE 9: METHODOLOGY FOR MAPPING FLOOD AREAS... 58
FIGURE 10: MAP OF ESNEUX... 61
FIGURE 11: EXTRACT OF THE CADASTRAL MAP OF ESNEUX... 62
FIGURE 14 VULNERABLE PEOPLE IN THE CASE STUDY DEBDER ... 67
FIGURE 15 VULNERABLE PEOPLE IN CASE STUDY OURTHE ... 67
FIGURE 17: SCHEMA SHOWING THE BWK MAP IN THE POTENTIAL FLOOD AREAS (NOG-ROG-MOG) IN THE DENDER BASIN... 71
FIGURE 18: IMPACTS OF FLOOD ON THE BIODIVERSITY OF HABITAT IN NINOVE AND GERAARDSBERGEN AREAS (DENDER BASIN). ... 72
FIGURE 19: ECOLOGICAL VALUES OF HABITATS IN ESNEUX (OURTHE BASIN). ... 73
List of table
TABLE 1: OVERVIEW OF THE COMPLEMENTARITIES BETWEEN THE CASE STUDIES OF RIVER
OURTHE AND RIVER DENDER. ... 43 TABLE 2: RELATIVE COMPUTATION TIME NECESSARY FOR THE DIFFERENT PROCEDURES TO PROVIDE A STEADY STATE
SOLUTION... 46 TABLE 3: OVERVIEW OF THE MODELING APPROACHES USED FOR THE CASE STUDIES OURTHE AND DENDER... 46 TABLE 4: 4LOW, MEAN AND HIGH PERTURBATION FACTORS FOR PRECIPITATION AND EVAPOTRANSPIRATION... 47 TABLE 5: DISCHARGE AND AVERAGE CHANGE IN WATER DEPTH COMPARED TO THE BASE
SCENARIO... 48 TABLE 6: DAMAGE COSTS IN ESNEUX (*INCLUDING DAMAGE COSTS FROM AGRICULTURE
FOR 4.035,71€) ... 60 TABLE 7:DAMAGE FUNCTIONS (“C” IS THE COSTS OF DAMAGE AND “D” IS THE WATER DEPTH). ... 63
I.
ACRONYMS, ABBREVIATIONS AND UNITS
AMR Automatic Mesh RefinementBWK Biological Value Maps CBA Cost-benefit analysis
CC Climate Change
CCI-HYDR Climate Change Impact on hydrological extremes along rivers and urban drainage systems (BELSPO Project)
CEESE Centre for Economic and Social Studies on the Environment
COD Chemical Oxygen Demand: measures the amount of organic and anorganic pollution of water
DPSIR Driving force, Pressures, State, Impact and Response DWA Diffusive Wave Approximation
ECOBE Ecosystem Management Research Group EGS Ecological Goods and Services
FHRC Flood Hazard Research Centre
FI Fish Index
GCM Global Circulation Models
GEV Global score for Ecological Values
GHG Greenhouse Gas
GIS Geographic Information System
HACH Applied Hydrodynamics and Hydraulic Constructions HIVA Higher Institute for Labour Studies
HPM Hedonic Price Method
KUL Katholieke Universiteit Leuven MCA Multi-criteria analysis
MEA Millennium Ecosystem Assessment MOG Modeled Flooded Areas
NOG Natural Flooded Areas
POG Potential Flooded AreasRCM: Regional Climate Model RCM Regional Climate Model
ROG Recently Flooded Areas SIA Social Impact Assessment
SWE Shallow-Water Equations
UA University of Antwerp
ULB Université Libre de Bruxelles ULg University of Liège
II.
EXECUTIVE SUMMARY
A.
Introduction
Since the beginning of the Industrial Revolution the scale of human impacts on their natural environment has become increasingly more important, altering the balance in the climate system and thereby triggering effects on temperature and precipitation, and consequently also on heat waves, drought, flooding as well as sea level rise. Climate change is currently regarded as one of the most important threats to the environment and human well-being. If the observed evolutions of our climate persist climate change will put an increasing burden on society and natural systems.
Policymakers can respond to the consequences of climate change in two ways. First, by taking mitigation measures, which are developed to reduce emissions of greenhouse gasses, and thus aim to prevent or, at least, limit climate change. Secondly, by the development of adaptation measures in order to limit the impact climate change has on populations and ecosystems. In the framework of the ADAPT project the focus is on adaptation measures.
The ADAPT project consist of two working packages. The first working package (WP 1) is a synthesis report about the effects of climate change in Belgium, while the second working package (WP 2) is dedicated to the development of the practical methodology for guiding welfare maximising decisions about adaptation measures to increased river flood risk as a result of climate change.
Indeed, the project focuses on the particular problem of river flooding, which is expected to increase because of increasing frequency and intensity of heavy precipitation events. To develop the methodology, two case study areas are selected in the two main Belgian river basins (the Scheldt and the Meuse). One part of the project is devoted to the inventory and assessment of damages caused by floods, while another one concerns the analysis of the adaptation measures. Based on this information, the final task of the project consists in carrying out a cost-benefit analysis and/or a multi-criteria analysis in order to select the most appropriate adaptation measures in terms of integrated cost-effectiveness.
The evaluation of the primary impact of global change induced flooding on river basins is based on hydraulic modelling, which uses as input data either the results of hydrological modelling or directly hydrological data. The results of the hydraulic model are then used as input for the integrated risk assessment models for evaluating flood risk to economic, social and ecological systems.
The subject of climate change is vast and complex and so is the development of a comprehensive methodology for assisting policy makers in deciding about adaptation measures. Therefore, the project is approached in a multidisciplinary way, studying economic, social and environmental impacts as well as their interactions. The ADAPT team is composed of five partners of complementary scientific expertise, belonging to the three pillars of sustainable development, to meet the challenges the integrated analysis of complex problems impose. Besides, the ADAPT project works in close collaboration with the CCI-HYDR project. The output of the CCI-HYDR project, which studies climate change impacts on hydrological extremes along rivers and urban drainage systems in Belgium, serves as input for the ADAPT project.
B.
Effects of climate change in Belgium: general study
The elaboration and application of a methodology for the selection of adaptation strategies (flood protection measures) in the context of climate change must obviously rely on a proper knowledge of climate change effects on flooding. The general study of the effects of climate change in Belgium serves therefore as a key starting point for WP 2, by exploring the existing knowledge and facts on the issue.
During the 20th century the global average surface temperature has increased by about 0.74°C. The warming has been neither steady nor the same in different seasons or in different locations. The IPCC recognises that as mean temperatures increases the probability of extreme warm days increases too. It is also indicated that standard deviation of temperature is likely to change (IPCCa, 2001).
Although the size of Belgium is relatively limited to enable irrefutable projections about Belgian Climate, the warming trend for Belgium is well established. In Belgium, the last two decades were marked by very high yearly average temperatures. Projections for Belgium, which are only illustrative of the general trend that can be expected, predict an increase in winter temperature between 1.7°C and 4.9°C and an increase in summer temperature between 2.4°C and 6.6°C by the end of the 21st century (Marbaix and van Ypersele, 2004). In addition, more pieces of evidence that climate change is already happening in Belgium can be mentioned: earlier migration of birds have been observed and several species of southern dragonflies become more frequent as a result of increasing temperatures (MIRA, 2005); Belgium has beaten temperature records year after year and heat waves have threatened many lives; in particular the heat wave during summer 2003 caused social, economic and environmental effects.
As regards annual precipitation, historical records in Europe demonstrate very different regional evolutions (increase in the north and decrease in the south). In Belgium, projections for the evolution of winter precipitation during the 21st century show a moderate increase (5 to 20%), while summer precipitation is likely to decrease but quantitative results diverge (from status quo to a decrease by 50%). An increase in the number of very rainy days has already been observed in the north and centre of Europe. In Belgium, the frequency of heavy rainfalls is also expected to rise.
Consequently, the hydrology of river basins will be strongly affected by the changes in temperature, precipitation and evapotranspiration, resulting from climate change. As a result, across much of Europe, flood hazard is considered as likely to increase, along with substantial rises in flood risk in coastal areas. In particular, climate change will lead to increased winter floods in much of Europe (EEA, 2005a).
In Belgium, changes in mean river discharges are found to be either positive or negative, according to diverse climate change scenarios. The result depends on the balance between increased precipitation and higher evapotranspiration and is strongly catchment dependent.
Regarding extreme events, the frequency of recorded floods in Belgium has already increased during the last decades. Major inundations took place in 1995, 1998, 2002, 2003 and 2005. Land use planning is obviously partly responsible for those floods, but variations in winter precipitation and increased frequency of heavy rainfalls will still amplify flood risk. Though it remains difficult to quantify the potential changes in flood frequency various analyses provide already an insight into the most probable evolutions (FLOODSITE, 2006). For instance, a specific study on the river Meuse upstream of Borgharen in Belgium and France predicts a small decrease of average discharge but a clear increase in extreme discharges and variability (5-10%) (Booij, 2003).
C.
Development of a methodology for guiding decisions about adaptation
measures to climate change induced flooding
As climate change is expected to influence rainfall and evapotranspiration, both impacting river flooding, flood risk management strategies need to account for those effects of climate change on hydrological extremes. Currently, this is not a common practice in Belgium and abroad. (Grinwis M. and Duyck M., 2001; Boukhris et al., 2006). The ADAPT project aims to meet this challenge by the development of a practical methodology for assisting decision making about the selection of cost-effective flood protection strategies in the context of climate change, based on the integrated evaluation of economic, social as well as ecological effects. For the development as well as the illustration of the methodology, the study relies on two case studies located in the two major Belgian river basins: (1) part of river Ourthe (Meuse basin) and (2) part of river Dender (Scheldt basin).Those study areas have been selected for their flood history, for the interest of their hydraulic, economic, social and ecological characteristics, as well as for their complementarities.
The evaluation of adaptation scenarios for reducing the effects of flooding critically depends on the ex-ante modelling of flood chances and characteristics. This is done by means of hydraulic models which take the discharge into the river as an input and provide flood maps as an output. The hydraulic modelling approach is different for the two case studies: for river Ourthe, hydraulic boundary conditions are set; while for the Dender, hydrological modelling is performed as an input for the hydraulic model.
The flow simulations for the case study of river Ourthe are conducted by means of the two-dimensional numerical model WOLF 2D, based on the fully dynamic Shallow-Water Equations (SWE) and entirely developed at the University of Liege. For the floodplains along river Ourthe, topographic data are extracted from an aerial LiDAR (Light Detection And Ranging) Digital Surface Model (DSM), with a horizontal resolution of 1 meter and a vertical accuracy in the range of 15 cm (provided by the Ministry for Facility and Transport - MET-SETHY). The hydraulic simulations are all performed on a regular grid of 2m by 2m. The model outputs are dense 2D distributions of water depth and flow velocity in the inundated areas, which are the main input data necessary for the subsequent damage evaluation.
Although the hydrodynamic model is perfectly suited for dealing with unsteady flow simulations, including highly transient flows, the steady-state approximation is exploited in the present case. This hypothesis has been demonstrated to be valid as a result of the relatively long duration of the floods, combined with a limited possible storage in the floodplains of the rather narrow valley of river Ourthe. The computation time has been further reduced thanks to an automatic mesh refinement technique.
The study is performed for two different return periods, namely 25 and 100 years, for which the best flood protection strategies will be complementary. At the present stage of the research project, simple assumptions have been considered regarding the expected perturbations affecting the peak discharges of the river Ourthe as a result of climate change. Those assumptions will eventually be confirmed and refined by comparison with the outcomes of the parallel project CCI-HYDR.
For each return period and each modelling scenario of river Ourthe, the following three maps have been generated: water depth, flow velocity and increase in water depth. The whole set of results is now available for the partners to evaluate the secondary impacts of flooding. As confirmed by these
simulation results, the complexity of topography in the floodplains requires a two-dimensional flow model as the most credible approach to reliably represent the dynamics of inundation flows.
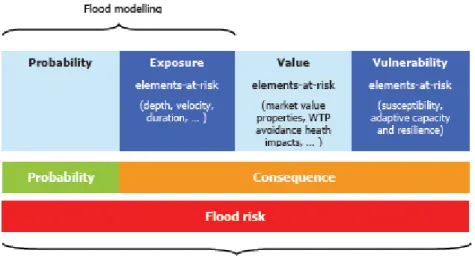
Flood risk modelling assesses the impact flooding has on society. In order to overcome the focus on the direct tangible effects of flooding to economic systems, as in conventional flood risk modelling practice, three complementary flood risk assessment modules are developed, respectively focussing on the effects of flooding to economic, social and ecological systems. The effects of flooding are best expressed in monetary terms, but only if doing so does not increase overall uncertainty. In case the monetisation of effects is not relevant, comprehensive quantitative indicators and/or indices are developed.
The central question when assessing flood risk is “What values derived from (well-functioning) economic, social and ecological systems will be lost as a result of flooding?” All relevant effects of flooding to economic, social and ecological systems have been identified, described, selected and attributed to one of the three risk assessment modules. The risk assessment methods for the three different effects covered greatly build on the same concept of flood risk, which is function of the probability that a flood event will occur and the consequence associated with that event. Practically, risk is made up of four major building blocks: the probability of flooding; the exposure of the elements-at-risk to a flood with certain characteristics; the value of these elements-at-risk and; the vulnerability of these elements-at-risk. The probability of flooding directly relates to the return period of foods. The exposure of the elements-at-risk is, to an important degree, obtained by hydraulic modelling. The assessment of the value of the elements-at-risk is generally less obvious. The elements-at-risk are not always of a direct tangible nature. Consequently, the value society holds for preventing elements-at-risk to be affected cannot always be easily determined. The vulnerability of the elements-at-risk is function of their susceptibility, adaptive capacity and resilience to the flood characteristics.
The objective of the flood risk assessment methodology is to come up with an estimate of the probable future flood risk on the one hand and to provide an insight in the distribution of flood risk and related causes on the other hand. This information is the crucial input for identifying adaptation measures.
The assessment of the economic impacts of flooding on the elements-at-risk, makes use of two methodologies: (i) the market prices method, based on the price of the losses in terms of market prices, and (ii) the hedonic price method (HPM), based on the analysis of existing markets. The later approach attempts to identify what price difference can be attributed to a particular environmental difference (inside/outside of the flood area) between properties.
The inventory of damages and their forecasting will be carried out with the help of damage functions. The vulnerability of the elements-at-risk (depending on their susceptibility, adaptive capacity and resilience) is introduced in the risk analysis by means of those damage functions. The object of the development of these damage functions is to represent direct damages caused by flooding on the individual habitat as a function of certain characteristics (characteristics of the built-up property (with or without basement) and characteristics of the flood (water depth, velocity, duration).
For the commune of Esneux (Ourthe case study), the analysis of the damage costs and the number of affected goods both indicate that the consequences were very different for each flood event and several trends were observed like the most importance of “housing” damages…
Social effects relate to the changes inundations have on the way people live, work, think and organise (Burdge, 1998). The vulnerability of people, and their social network, to flooding is many
times more complex than the vulnerability of tangible assets. People’s vulnerability can simply not be approximated via a simple depth-damage function. In the ADAPT project social vulnerability to flooding is being approximated by an index of a number of well-chosen personal characteristics. Based on an extensive literature review and expert judgement the seriousness, being a measure of the value potentially at risk, of various social effects has been determined and expressed by means of semi-quantitative scales. A limited number of effects e.g. the health effects of flooding can however be monetised via the use of monetary factors borrowed from valuation studies.
The ecological effects of flooding relate to ecosystem service provision, the benefits people derive from ecosystems, being affected by flooding. Just as the social flood risk assessment methodology, the ecological flood risk assessment methodology is experimental.
For each ecosystem function at risk a specific knowledge table has been drawn up. As for the social vulnerability assessment methodology these knowledge tables serve as a complex, multi-dimensional damage functions. The main problem for including the ecological impacts of flooding in a CBA based decision framework is that the impacts to ecosystems often cannot be quantified very accurately, let alone monetised as the corresponding services are not valued in markets. Alternatively, the likely value of ecosystem service provision is scored by means of a quantitative scale.
Based on the predicted flood risk and a thorough investigation of the causes of the flood problem in the two case study areas, adaptation scenarios will be identified. The wider costs and benefits of adaptation scenarios also impact on welfare. In many instances stakeholder involvement is of particular importance for the identification as well as the assessment of these costs and benefits. The procedure consists of a checklist for facilitating the identification of the effects. The assessment of related costs and benefits will be carried out on the basis of the guidelines for carrying out socio cost benefits analysis.
For the case study of river Ourthe, the hydraulic effects of several local technical adaptation strategies have already been computed by hydrodynamic simulations, showing the change (reduction) in flood characteristics as a result of the implemented flood defence measures. Those simulations have been run by HACH-ULg to demonstrate the feasibility of designing technical adaptation measures on the river Ourthe, in spite of the relatively limited storage capacity of the floodplains. The considered adaptation measures involve either pumping, topography modifications for locally reducing flow resistance and the transformation of passive floodplains into active ones. The latter measure consists in modifying the topography of a passive floodplain (low flow velocity) to enable the development of higher flow velocities beyond the main riverbed. As a result, the effective width (and thus section) of the river is increased and, consequently, the water level upstream is reduced. The best modelling tool to reliably simulate the effect of such a measure remains a fully two-dimensional model, faithfully reproducing the velocity cross-distribution and leading to a better understanding of the flow paths, which directly influences the optimal design of adaptation measures.
Finally all effects assessed will be combined in an extended CBA to enable the evaluation of adaptation scenarios. This decision framework prioritises the use of monetised effects but offers a MCA based framework for presenting and dealing with non-monetary information in a balanced way as to make sure decisions – to the extent possible – are made on all information available. Only those adaptation scenarios that are expected to contribute to welfare are worth implementing. Benefits of adaptation scenarios therefore should outweigh associated costs. In order to allow for the optimisation of adaptation scenarios the spatial distribution of flood risk, which will be visualised by
means of GIS, constitutes a crucial aid to the evaluation of adaptation measures in a CBA based decision framework.
III.
INTRODUCTION
A.
Context
Climate change is currently regarded as one of the most important threats to the environment and human well-being. This was recently confirmed by the release of the IPCC Working Group II Report on ‘impacts, adaptation and vulnerability’ (IPCC, February 2007). It is very likely that we will be confronted with an increase in temperature, changes in the quantity, intensity and patterns of rainfall, heat waves, incidences of drought, flooding and a rising sea level. If we do nothing to limit the threats, these phenomena will generate multiple damages that will put an increasing burden on our societies, as is demonstrated by the Stern Review (2006) and IPCC (April 2007).
Policymakers can respond to the consequences of climate change in two ways. First, by taking mitigation measures, which are developed to reduce emissions of greenhouse gasses, and thus aim to prevent or, at least, limit climate change. Secondly, by the development of adaptation measures in order to limit the impact climate change has on populations and ecosystems. In the framework of the ADAPT project the focus is on adaptation measures.
The development of adaptation policies is not an easy task due to the uncertainty about the extent, timing and the localisation of climate change impacts. In addition, it is difficult to select the most cost-effective adaptation measures as it is on the one hand difficult to identify and assess all effects and on the other hand it is hard to balance social, economic and ecological effects. The ADAPT project aims to meet the need to support decision-making in developing and selecting adaptation measures by the development of an integrated decision methodology for adaptation measures. In particular, the project focuses on the problem of river flooding, which is expected to increase because of increasing frequency and intensity of heavy precipitation events. To develop the methodology, two case study areas are selected in the two main Belgian river basins (the Scheldt and the Meuse). One part of the project is devoted to the inventory and assessment of damages caused by floods, while a second one concerns the analysis of the adaptation measures. Based on this information, the third task of the project is to carry out a cost-benefit analysis or a multi-criteria analysis in order to limit the choices and to select the most appropriate adaptation measures. The ADAPT project lasts four years (15/12/2005 -31/01/2010). This report concerns the work carried out during the half of the project and is therefore limited to the description of the intermediary results. This report consists of three major parts. The first part introduces the objectives and the scientific methodology of the project. In a second part, the research is described in greater dept; highlighting methodologies used and developed and presenting intermediary results. In the final part conclusions and recommendations are made.
B.
Objectives
The objective of the ADAPT project is twofold. First, a first aim is to provide a synthesis of the knowledge and facts concerning the effects of climate change in Belgium. This synthesis provides information on the intensity, probable progression in time and uncertainty limit concerning the effects discussed. This synthesis sketches out the context and expectations of climate change impacts in Belgium. Secondly, the core of the ADAPT project is to develop a practical methodology for
assisting policy makers in deciding about adaptation measures to climate change induced flooding. For this, the study is based on two case studies located in the two major Belgian river basins.
The synthesis report about the effects of climate change in Belgium is the subject of a first working package (WP 1), while the second working package (WP 2) is dedicated to the development of the practical methodology for guiding decisions about adaptation measures.
WP 1 has been executed during the first year of study and will be upgraded during the next years of the project when new insights arise. WP 1 focuses on the discussion of the primary impacts (temperature, rainfall, etc.) of climate change and how these translate into the impacts on human and natural systems as well as the interaction between the effects on human and natural systems. The execution of WP 2 started in the middle of 2006 and will continue until the end of the project. The present report only covers the first two years, hereafter referred to as the first phase of the project.
The development of a practical methodology for assisting policy makers in deciding about adaptation measures to climate change induced flooding involves the integration of a number of distinct models and methodologies. The development and integration of these models and methodologies gives rise to a considerable number of intermediate objectives. These objectives have been combined into a number of working packages.
WP 2.1 is about the evaluation of the primary impact of global change induced flooding on river basins. Any evaluation of adaptation measures for reducing the effects of flooding, informing water managers about what measures or combination of measures to adopt, critically depends on flood or hydraulic modelling. As the ADAPT project is dedicated to guiding decisions about adaptation measures in a climate change context flow modelling has to account for the effects climate change may have on flooding. For the case study located in the Meuse basin (river Ourthe, see section V.C on page 41), the flow simulations are conducted by HACH-ULg (by means of the two-dimensional flow model WOLF 2D) at a very detailed resolution, providing thus the most valuable inputs for the evaluation of the secondary impacts. Nevertheless, such high-resolution flow simulations may require significant computational resources; therefore techniques for reducing the computation time have also been investigated.
WP 2.2 concerns the development of three complementary flood risk assessment modules, respectively focusing on the effects to economic, social and ecological systems. The integrated flood risk assessment methodology should, using results of flow simulations as an input, come up with an estimate of the probable future flood risk on the one hand and to provide an insight in the distribution of flood risk and related causes on the other hand. This information is the crucial input for identifying adaptation measures. It is imperative that the outputs of each module (= partial flood risk assessments) can be combined and integrated as to be able to calculate the overall flood risk. To this end the relevant effects of flooding on economic, social and ecological systems have to identified and selected. The assessment methodologies of all effects covered by the three risk assessment modules need to be built on a general risk assessment framework. Special attention has to be paid to the assessment of vulnerability of the elements-at-risk.
Based on historical data, local knowledge, simulated flood maps, predicted flood risk and a thorough investigation of the causes of the flood problem in the two case study areas, adaptation scenarios will be identified, selected and developed under WP 2.3.
WP 2.4 aims to develop a methodology for evaluating costs of adaptation measures. The costs of the realisation and management of the adaptation scenarios are in the first place the financial costs faced by the project initiator and manager. Besides, the realisation of adaptation scenarios is quasi always accompanied by a number of additional costs and benefits.
Every adaptation scenario has to be evaluated in terms of its costs and benefits in order to support decision making. The primary benefit of adaptation is the flood risk avoided. The methodology for the integration of costs and benefits is to be developed under WP 2.5. On the basis of the input from evaluation of costs and benefits proposed adaptation scenarios may require further fine-tuning. Finally, recommendations will be drawn up in WP2.6.
C.
Scientific methodology
The subject is vast and complex. Therefore, the project is approached in a multidisciplinary way, studying economic, social and environmental impacts as well as their interactions. The ADAPT team is composed of five partners of complementary scientific expertise, belonging to the three pillars of sustainable development. The project is coordinated by the CEESE-ULB, which coordinates and has coordinated several integrated research projects both on a national and a European level.
The synthesis report about the effects of climate change in Belgium has predominantly been based on a thorough literature review. Besides, a number of interviews were carried out. Finally, information has been completed with expert judgement.
The development of the methodology for assisting policy makers in deciding about adaptation measures to climate change induced flooding requires the use, development, optimisation and integration of distinct models and methodologies. The project is organised along two case-studies which serve as the basis for adapting, extending and/or refining existing as well as developing new methodologies.
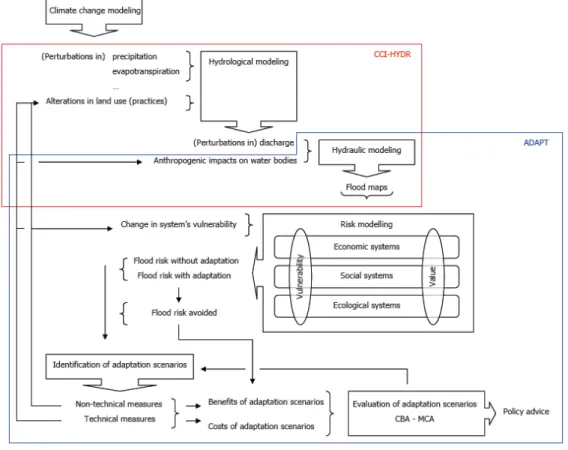
In brief the evaluation of the primary impact of global change induced flooding on river basins is based on hydraulic modelling which is fed by the results of climate change modelling and hydrological modelling or data.
The results of the hydraulic model are then fed into risk assessment models for evaluating flood risk to economic, social and ecological systems. In addition, each of these assessment methodologies is made up of modelling systems’ vulnerabilities and values.
On the basis of flood risk modelling results and expert knowledge procedures are drawn up for the identification, selection and development of adaptation measures. Likewise assessment procedures are drawn up for the determination of the financial costs of adaptation scenarios as well as their wider costs and benefits to society. Costs and benefits then are integrated in a cost-benefit or multi-criteria framework.
The hydrodynamic model WOLF 2D applied for the case study located in the Meuse basin (river Ourthe, see section V.C on page 410) had been developed previously by the team HACH-ULg, while the development of the various other models and methodologies are based on extensive literature review, discussions with key experts, focus group discussion, expert judgement, consultation of stakeholders, collection of information from authorities, international collaborations and synergies with other international projects (e.g. the German projects REISE and MEDIS, conducted in the framework of the federal research program RIMAX), etc.
During the process, scientific support for the authorities was sought out and contacts were established with the leaders of other BELSPO research projects.
The integrated tool will be built on the basis of criteria such as efficiency feasibility and acceptability framework and their limitations, for which uncertainty analysis will be a permanent preoccupation. Another issue has been the need to inform the public and to reinforce the joint links between partners, and so a website on the project was created during the first part of the year 2006. This site was conceived both to present the project to interested persons and organisations and as platform for exchanging and sharing information between the different members of the project.
Besides, the ADAPT project works in close collaboration with the CCI-HYDR project. The output of the CCI-HYDR project, which studies climate change impacts on hydrological extremes along rivers and urban drainage systems in Belgium, constitute a very valuable input for the ADAPT project. The outputs of the CCI-HYDR-project constitute an input into the ADAPT project. The projects have the case study in the Dender basin in common. Cooperation between both projects is facilitated via a core synergy team which discusses advancements and information exchange on a regular basis. The results obtained by the two teams are therefore always being transmitted between the two projects. In the same view, the follow-up committee meetings are held together with the two project partners.
IV.
EFFECTS OF CLIMATE CHANGE IN BELGIUM: GENERAL STUDY
A.
Introduction
To develop a methodology to select adaptation measures against climate change effects, one has to start exploring the existing knowledge and knowledge gaps on climate change effects in Belgium. Therefore, the main objective of WP 1 is to synthesize the knowledge and facts of climate change effects in Belgium. This will be a valuable input for the work under WP 2 as it provides readily useful data and methodological insights as well as it allows putting things in perspective.
Research and knowledge on climate change impacts in Belgium is rather fragmented. While some issues are thoroughly studied, knowledge on other aspects is limited up till now. The synthesis is mainly based on literature review. This information was completed by a number of interviews and expert judgments. In cases knowledge on Belgian effects was absent, we relied on findings in neighboring countries to estimate potential consequences within the borders.
The final outcome of this WP 1 is the report ‘General study and evaluation of potential impacts of climate change in Belgium’. This report is already finished and uploaded on the project website, but might be updated when new insights arise
(http://dev.ulb.ac.be/ceese/ADAPT/public_section/Doc/WP1_climate%20change%20in%20Belgium. pdf).
In the following paragraphs, the context of climate change is described. Next, we focuses on the primary impacts of climate change (temperature, rainfall etc…), while the subsequent section explores how these primary impacts are translated into impacts on the human and natural systems as well as the interaction between the effects on human and natural systems.
B.
Climate change in an international context
Climate change is mainly due to the emissions of greenhouse gasses which are spread all over the world. A global response, supported by the majority of the world population, is needed to prevent dangerous anthropogenic interference with the climate system. This view was recognised by the international community through the signature of the UN Framework Convention on Climate Change in 1992. The Convention entered into force in 1994. During the third session of the Conference of the Parties (COP), which is the supreme body of the Convention, the Kyoto protocol was adopted. The developed countries are to reduce their emissions of six key greenhouse gasses by at least 5%. In order to establish a sound understanding of the mechanisms driving the earth’s climate and the impacts of the predicted change and to explore response strategies, the Intergovernmental Panel on Climate Change (IPCC) was founded in 1988 by the United Nations Environmental Programme and the World Meteorological Organisation. Today, this panel is the most influential body on climate issues as it groups thousands of specialists worldwide, cooperating to get a better understanding of the climate system and the influence of human-induced climate variations.
C.
Evidence of climate change in Belgium
The size of Belgium is too limited to enable irrefutable statements about Belgian Climate. Unlike, for example the KNMI in the Netherlands, we do not have a body making national predictions. Therefore, we need to broaden our focus first to the observations, evolutions and projections for Europe. Regional climate predictions are relatively difficult since small changes in spatial climate
patterns can make a substantial difference on the regional scale. Moreover, year to year fluctuations in specific regions are generally more important than changes in the world average. On a larger scale, variations in one region are compensated, levelled out, by opposite variations elsewhere (Beersma, 2004; IPPC, 2001a).
Some evidences that climate change is already happening in Belgium are mentioned hereafter. First, Leysen and Herremans have observed earlier migration of birds (MIRA, 2005). De Bruyn has found that several species of southern dragonflies were more frequent in Flanders because of increasing temperatures (MIRA, 2005). Furthermore, Belgium has beaten mean temperature records year after year (RMI, 2006). And heat waves have threatened many lives; in particular the heat wave during the summer of 2003 caused several social, economic and environmental effects (UNEP, 2004; Sartor, 2004).
D.
Primary impacts of climate change
a) Temperature
During the 20th century the global average surface temperature has increased by about 0.74°C (+/- 0,18°C) (IPCC, February 2007). However, the warming has been neither steady nor the same in different season or in different locations. During the 20thcentury the average for Europe was higher than the global average with a calculated increase of 0.95°C. In Europe, the 1990’s has been the warmest decade in the instrumental record. In the northern hemisphere, warming during the past century was the highest of the last 1000 years (EEA, 2004, IPCCa and b, 2001; IPCCa, 2007, Marbaix and van Ypersele, 2004).
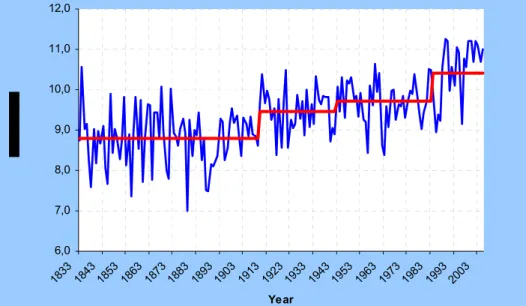
6,0 7,0 8,0 9,0 10,0 11,0 12,0 1833 18431853 1863 18731883 1893 1903 1913 1923 1933 1943 1953 1963 1973 1983 1993 2003 Year
Figure 2 Evolution of the mean annual temperature in Uccle over the period 1833-2005 (RMI, 2006)
The warming trend for Belgium is also well established. In Belgium last two decades were marked by very high yearly average temperatures. Statistical analysis of the records on the average in Uccle since instrumental record allows distinguishing four periods as illustrate in Figure 2. Between 1833 and 1909 the yearly average temperature was 8,8 °C. Between 1910 and 1942 and between 1943 and 1983 the yearly average temperature amounted to respectively 9,5°C and 9,7°C. From 1984 onwards, the yearly average is about 10.4 °C. (RMI, 2006)
Based on different models and for different scenario’s, which serve as an input for impact studies, a global average temperature rise from 1,4 to 5,8 C° is put forward for the period 1990-2100 by the Third Assessment Report. Annual mean temperatures in Europe are likely to increase more than the global mean. (IPCCa, 2001; IPCCa, 2007)
A limited simulation, making use of five Global Climate Models and two scenarios (A2, B2), by De Marbaix and van Ypersele predicts an increase in winter temperature between 1,7°C and 4,9°C the end of the 21st century for Belgium. The model results for the evolution in summer temperature vary between 2,4°C and 6,6°C. These projections are, however, only illustrative of the general trend that can be expected. (Marbaix and van Ypersele, 2004)
Predicted temperature increase for Europe, however, will be weakened in case the Gulf Stream, which transports heat from the tropics to higher latitudes, would slow or stop as a result of global warming. Especially in Northern and Western Europe this may lead to considerable cooling (Marbaix and van Ypersele, 2004).
b) Precipitation
Historical records in Europe demonstrate very different regional evolutions in annual precipitation (increase in the north of Europe and decrease in the south).
In Belgium, projections for the evolution of winter precipitation during the 21st century show a moderate increase (5 to 20%), while precipitations in summer are likely to decrease but quantitative results diverge (from status quo to a decrease by 50%).
An increase in the number of very rainy days has already been observed in the north and centre of Europe. In Belgium, although the frequency of heavy rainfalls is also expected to rise, additional studies are needed to quantify this evolution.
The parallel project CCI-HYDR will provide some more insight into the expected trends for future precipitation in Belgium.
c) Climate variability and extreme weather phenomena
(1) Heat waves and drought
The assessment reports of the IPCC recognise that the warmer mean temperatures increase the probability of extreme warm days. It is also indicated that standard deviation of temperature is likely to change. This means that increased temperature variance raises the probability of higher extreme temperatures as it adds to the already higher mean temperatures. The Third Assessment Report concludes that higher maximum temperatures and more hot days are likely to occur over all land areas (IPCC, 2001b).
If the observed temperature fluctuations between one year and another stay the same as during the 20th century, than it will be very likely that the higher mean temperature will increase the likeliness of extreme hot summers, marked by more serious heat waves. As some researches found that the yearly fluctuations in temperature might become even more pronounced, an increased occurrence of heat waves seems likely. There however is still much uncertainty about this issue (IPPC, 2001a; Marbaix and van Ypersele, 2004).
The impact of higher summer temperatures and the possible increase in the occurrence of heat waves on human and natural systems is also function of precipitation. It is clear that the expected status quo or decrease in summer rainfall will add to the severity of temperature related impacts in summertime.
d) Directly linked effects
(1) Sea level rise
There is strong evidence that global sea level gradually rose in the 20th century and is currently rising at an increased rate. Sea level is projected to rise at an even greater rate in this century. Estimates for the 20th century show that global average sea level rose at a rate of about 1.7 mm a year. Tide gauge data for the Belgian coast indicate a relative sea level rise from 2 mm/year for high water, 1.5 mm a year for mean sea level and 1mm/year for low water over the past century (Van Cauwenberghe, 2000). The two major mechanisms behind global sea level rise are thermal expansion of the oceans (water expands as it warms) and the loss of land-based ice due to increased melting. (IPCC, 2007a and den Ouden et al., 2004)
For the different climate change scenarios projected global average sea level is likely to increase by 18 to 59 cm between 1980 - 1999 and 2090 - 2099. Because understanding of the effects driving sea level rise is too limited, these estimates are not an upper bound for sea level rise. Besides, sea level is not rising uniformly around the world. Regional realities can be quite diverse. Sea level rise in Western Europe will not deviate much from the world average. One, however, needs to take into account that the Belgian surface will decline by about 5 cm over the 21st century. (Beersma, 2004; IPPC, 2007a; Marbaix and van Ypersele, 2004).
Impacts of sea level rise also play inland as it directly influences tidal rivers. The increase in high water levels in the river Scheldt, caused by sea level rise, is several times larger than sea level rise itself. Consequently, extreme high water levels will occur with increasing frequency. (IRGT-KINT, 2004; MIRA, 2005)
(2) Flooding
River discharges and groundwater quantities are determined by many factors: climate, land use, soil type, flow regulation, … This complex system of numerous factors interacting with each other will obviously be affected by the changes of temperature, precipitation and evapotranspiration, resulting from climate change (IRGT-KINT, 2001).
Across much of Europe, flood hazard is considered as likely to increase, along with substantial rises in flood risk in coastal areas. In particular, climate change will lead to increased winter floods in much of Europe. Indeed, winter precipitation will increasingly take the form of rainfall (due to higher temperature) and will hence provoke rapid run-offs and a higher flood risk (EEA, 2005a).
Interesting evaluations of climate change impact on European rivers have been presented during the research project RIBAMOD (Samuels, 1999). For instance, increases in flood peaks of up to 10% were predicted for a basin in Italy, while changes of up to 20% are expected for two basins in Great Britain. In Belgium, changes in mean river discharges are found to be either positive or negative, according to diverse climate change scenarios. The result depends on the balance between increased precipitation and higher evapotranspiration. This annual drainage change may be in-between 5% increase and 30% decrease (Commission Nationale Climat, 2002).
The effect of climate change on the discharge regime of the Meuse has been specifically studied by means of hydrological simulations performed on the Meuse basin in the framework of the Dutch National research Programe on Global Air Pollution and Climate Change (de Wit et al., 2001).
Monthly averaged time series have been used for climate parameters and no changes have been introduced in the time distribution of rainfall (though in reality this too is likely to be modified).
Results are presented as monthly average discharge change values, which result from both precipitation and evapotranspiration changes.
It has been concluded that climate change would lead to an increase in the average discharge at the end of winter and at the beginning of spring, while a decrease of the average discharge is expected in autumn. However, natural variability of the Meuse discharge is large and differences over long time intervals are rather small, so that it becomes hard to clearly quantify those long term changes.
The results reveal a damping effect. Indeed, changes in the discharge regime are found to be less pronounced than those in the precipitation regime. This lower sensitivity can be explained both by the increase in the evapotranspiration and by the natural storage capacity of the catchments.
Uncertainties are mainly attributable to the selection of the climate change scenario used to perform the simulation. Indeed, the difference in the predicted change of the average monthly discharge regime that results from using different hydrological models is smaller than the difference that results from using different climate change scenarios.
Recent studies show that the increase in the flood peaks in the Meuse River since the 1980s needs to be explained mainly by climate variability rather than by landuse changes (Ashagrie et al. 2006, Tu et al. 2005b). Nevertheless, de Wit et al. (2001) have show that, in terms of future discharge regime in smaller rivers such as Ourthe or Mehaigne, the impact of changes other than climate induced ones (e.g. changes in land use…) may be as important as impacts resulting from climate change. This suggests that relevant adaptation measures (land use changes, water management, flow regulation ...) could reduce peak discharges.
For eight Belgian catchments, Gellens and Roulin (Gellens and Roulin 1998) have simulated impacts of climate change on surface flow as relative values of monthly differences. Relative values enable to compare impacts on rivers with very different discharges but the effects are inevitably enhanced during low flow stages.
According to this study, regarding flood frequency, the Belgian catchments present an increase for most climate change scenarios. Besides, all Belgian catchments with prevailing surface flow are undergoing an increase in flood frequency during winter months.
The computed impacts (Gellens and Roulin, 1998) have been demonstrated to be strongly catchment dependent (Wit et al., 2001), because they depend not only on the selected climate change scenario but also on the properties of the catchment itself. For instance, the Dijle catchement (Scheldt basin) is characterized by a low runoff coefficient (< 20%) whereas in the Berwinne catchment (Meuse basin) and in the Zwalm catchment (Scheldt basin) surface runoff ranges from 40 to 60%. In the Dijle catchment, a high increase in spring precipitation and a high decrease in summer precipitation result in relatively small changes of the surface flow. On the contrary, the same two changes in precipitation result in much greater responses in the Berwinne and the Zwalm catchments (+ and – 30%). Hence, catchments which are characterized by a dominance of fast runoff components, are more vulnerable with respect to both floods and low flows. Those catchements are especially located in the regions of rocks (eastern upper part of Chiers and Semois) and in the Ardennes massif (upper Ourthe, Lesse Vesdre and Amblève) (Wit et al., 2001).
The increase in flood frequencies during winter months for the catchments where surface flow prevails is the only common response to the different scenarios investigated by Gellens and Roulin (Gellens and Roulin, 1998). As a conclusion, the effect of climate change on river discharges must necessarily be studied for each catchment specifically (IRGT-KINT, 2001).
Regarding extreme events, the frequency of recorded floods in Belgium has already increased during the last decades. Major inundations took place in 1995, 1998, 2002, 2003 and 2005. Land use planning is obviously partly responsible for those floods, but variations in winter precipitation and increased frequency of heavy rainfalls will still amplify flood risk (Commission Nationale Climat, 2006). Other recent studies (e.g. Tu et al., 2005a) report that flood peaks in the Meuse River and some of its tributaries have significantly increased since the end of the 1970s or the early 1980s, mainly as a consequence changes in precipitation patterns.
Hence, future increases in groundwater levels and river discharges are expected to take place, especially in winter, as a result of the change in precipitation (Commission Nationale Climat, 2002; Marbaix et al., 2004). Similarly, though it remains difficult to quantify the potential changes in flood frequency, more precipitation on a soil saturated with water in winter and spring is very likely to lead to a higher flood frequency (IRGT-KINT, 2001).
Although more studies are needed concerning the detailed effects of climate change on flood risk in Belgium, various analyses provide already an insight into the most probable evolutions. Können (2001) states that, in 2100, Flanders and Zeeland will experience “an increase in the river peak discharges” (FLOODSITE, 2006). A specific study on the river Meuse upstream of Borgharen in Belgium and France predicts a small decrease of average discharge (~5%) but an increase in extreme discharge and variability (5-10%) (Booij, 2003).
E.
Secondary impacts of climate change
The integrated flood risk assessment methodology is focused on the effects to economic, social and ecological systems.
1.
Economic aspects
This part is composed of the description of the potential impacts of climate change in Belgium throughout the climate change policy and a wide range of economic sectors. The services sector was studied after the analysis of tourism, energy, transport and financial services. The production sector was examined by way of the study of agriculture, fisheries, the automobile industry and to a lesser extent the building industry.
a) The economy and linkages to climate change policy
Governments have deployed measures which aim at reducing the effects of climate change as well as tackling them both at a national and an international level. These decisions obviously have economic consequences for each individual but also for all of the industrial companies together. The ensuing effects could either be felt positively or negatively.
b) Overview of some political measures
The “Sigma plan “and the “Plan PLUIES” are two policy decisions on adaptation measures in Belgium. After the inundations of 1976 along the river Scheldt, induced by a violent northwest storm in the North-sea, the authorities launched the Sigma plan in order to protect the tidal part of river. Recently a new philosophy is emerging, combining safety, economy (harbour) and nature (Maris et al., 2006). Giving more space to the river through controlled inundation areas offers the opportunity to protect against flooding (heighten the level of the dikes and protect the infrastructure of the harbours) and restore the
ecological functioning of the estuary without obstructing the economic development of neither harbours nor navigation. One specific way to combine ecology and safety is the creation of a Flood Control Area (FCA) with a Controlled Reduced Tide (CRT) (Meire et al., 2005).
The plan P.L.U.I.E.S (Prévention et LUtte contre les Inondations et leurs Effets sur les Sinistrés), has been adopted by th walloon goverment in 2003. The 5 purpose of this plan are the following: improve the knowledge in risk of floods, reduce the runoff, lay out the bed of the river, reduce the vulnerability in the flooding area, and, finally, improve the management in a case of flood.
c) Human settlements
Since the beginning of time, the reason men have settled in a place comes from the facilities found in this place that are basic to their needs and enjoyment. Today, the relocation of populations and activities towards the interface « land-sea » has greatly increased since the industrial revolution, and has caused a reorganisation of land boundaries on a global level. Coastal zones are now at the heart of geopolitical and geo-economics structures, linked to them by powerful exchange fluxes.
The category of human settlements unites many sectors of activities whose reaction to the effects of climate change are to be felt in different ways. According to the experts of the IPCC, human settlements can be solicited by the climate in three ways (IPCC, 2001b):
By modification of the production capacity of the economic sectors which sustain the human settlement or of the demand for local goods and services. The type of settlement is obviously an important factor in determining this occurrence.
By direct impacts on certain physical infrastructures (distribution and transport networks), on built up properties1, on urban services and on certain economic sectors such as tourism and construction. By direct impacts on the population (migration, health).
d) Industry
Climate change can affect industry in several ways. The main impacts (linked to climate change) are the demands for water and energy which will greatly increase during heat wave periods. The cost of the rise in demand will obviously increase too. Elsewhere, such extreme events will also have an impact on the production and the distribution of goods and products. And so, adverse weather conditions may bring about a failure in the supply of raw materials. In the same way, the transport of commuters to their place of work will also be hit by the weather. Disruptions to the production chain will be highly probably from then on, and they will obviously be felt at the sales level as well. In the same view, the distribution of products and their retail sale will also be disrupted by climate conditions. These disruptions could even generate changes in consumer behaviour (Baron, 2006). The resolution of the problem of relocation and economical losses potential is therefore a necessary condition towards the adoption of more ambitious objectives in the future.
e) Agriculture sector
The agricultural sector is one of the main economic sectors which will be influenced worldwide by climate change. In a general way, it has to be said that on account of global warming, agricultural returns should decrease. Obviously these modifications in climate should bring with them as many beneficial effects for certain crops as negative ones (DEFRA, 2004). Nevertheless, the benefits and
1 Experience of the latest flooding events in Belgium shows that damages on houses are the most important contribution to the total damage compared to other sources of damages.
costs that arise will not be homogenous, but will vary greatly according to region, crops, agricultural practices and the other activities (cattle breeding, horticulture, fruit farming). Generally speaking, the availability of water will represent one of the essential points of this sector with regard to future climate change.
f) Forestry sector
As a result of global warming, the different species present within the forest ecosystem will be affected in various ways.
g) Fisheries
It is difficult to foresee the consequences of climate change on the fishing industry in Belgium and Europe because of the number of influencing factors attached (rising temperature, physico-chemical evolution of the environment…). These changes will obviously lead to modifications on the food chains (phytoplanctons, zooplancton, fish...). Besides this, the overfishing seems to be the most critical factor in sustainable development in our regions (IPCC, 2001b).
h) Transport sector
An analysis of the transport sector shows that it is possible to pick out two types of consequences linked to climate change. The first one, labelled “direct” impact, is a result of meteorological conditions at the time of using transport itself. The second, identified as an “indirect” impact, is linked to the politics involved in the struggle against climate change.
With transport, it could be affected by climate change and its associated conditions (heat wave, weather stress,…). Furthermore, these modifications would affect the whole range of means of transport, all of this at different degrees, following the damage done to the infrastructures and because of poor transport conditions. Besides this, with regard to road traffic, the traffic conditions could be even more precarious in the direction of key destinations such as the sea or the Ardennes during sunny periods.
As a result of climate change, the estimated increase in transport costs via waterways is limited to 2 to 4%, in Netherlands (Netherlands Environmental Assessment Agency, 2005). In the case of extreme conditions, such as those encountered in 2003, where the water level in waterways diminished remarkably, a considerable rise in transport costs was envisaged.
As for the transport industry, and more particularly the manufacturers of road vehicles, indirect impacts will equally be felt.
The problems associated with climate change are relatively new ideas for the automobile sector (Austin, 2003). These modifications have important financial impacts. Certain adaptation measures have already been taken on the level of several makes of car in order to reduce their CO2 emissions.
i) Tourism sector
On a worldwide scale, the tourism sector has a huge economic weight at its disposal. The criterion “temperature” is an important key in tourists’ space- and time-rating. The potential effects of climate change will be positive or negative according to the influence of the meteorological conditions in situ (beautiful weather, rain, snow, flooding,…) Elsewhere, these will also play a modifying role on the pleasant atmosphere and particularly on the evolution of the landscape and the environment.
Globally speaking, it is currently difficult to give a ruling on the consequences linked to this change as far as tourism is concerned. Nevertheless, certain trends can be concluded. So it is probable that
both international and local tourism will be affected by the influence of climate change. The destinations towards the south run the risk of being less appreciated than at the present time, and with conditions becoming hotter in the north, more individuals will tend to stay in their own country during holiday time (Netherlands Environmental Assessment Agency, 2005). Moreover, international tourism will also be affected with regard to transport methods due to political measures aiming at reducing the greenhouse gas emissions. Currently, the tourists have already been able to note an increase in costs of transport. Finally, the impact of the climate change will depend therefore for each country on an equation taking into account the proposed offer and the effects on the request.
j) Financial sector
The whole financial sector is affected by the problems which modifications in climate have generated. According to several members of the United Nations Environment Programme (UNEP) consortium for financial institutions, the extent of the catastrophes caused by climate change could even ruin the stock markets and the world’s financial institutions (UNEP, 2002). Thus “the increasing frequency of severe climatic events, threatening the social stability or coupled with significant social costs, has the potential to exert pressure on insurance companies, reinsurance companies and banks to the point of impaired viability or even insolvency” (UNEP, 2002).
The analysis of this sector is approached from the point of view of banks (investment) and insurance companies at an international level.
k) The banking sector
This sector could be particularly sensitive to the increase in damage resulting from extreme events. Following the diversification of the financial services offered financial companies can find themselves facing a collection of risk effects for which climate change becomes a risk for their whole portfolio of activities. The companies which are unaware of this danger run a higher risk from then on. Moreover, several threats and opportunities can be brought to light for this sector.
Elsewhere, the sector for financial services of a banking kind has a role to play in the “climate – finance” relationship (investment, credit risk and new climate risk hedging products) which it must not neglect (Allianz group and WWF, 2005).
The value of businesses is now subject to new factors of assessment, such as the new policies and regulations set up to tackle the greenhouse effect, the development of an environmentally-friendly technology, evolution in climate, the growing consumer-consciousness in the face of these questions. From now on, financial institutions must integrate the impacts associated with greenhouse gas reduction policies on the level of businesses into their own economics analyses policies. In fact, financial investors must take into account the costs associated with the new regulations and with the impact of these on the companies in which an investment has been made. On account of this statement and according to the experts’ opinion, the financial sector has therefore an indirect role to play in tackling climate change. The areas most targeted are the sectors of investment, the risk analysis and prevention.
l) The insurance sector
Due to the increase of people and goods in the zone at risk, due to a greater concentration of industries in this zone, due to the rise in the number of losses when extreme climatic events occur, the insurance sector is tending to take new options as to insurance-related possibilities. In fact, within insurance companies the rise in real and insured losses has on the one hand generated a