Energies 2020, 13, 2353; doi:10.3390/en13092353 www.mdpi.com/journal/energies Article
Underground Pumped-Storage Hydropower (UPSH)
at the Martelange Mine (Belgium): Interactions with
Groundwater Flow
Estanislao Pujades 1,*, Philippe Orban 2, Pierre Archambeau 3, Vasileios Kitsikoudis 3,
Sebastien Erpicum3 and Alain Dassargues 2
1 Department of Computational Hydrosystems, UFZ, Helmholtz Centre for Environmental Research,
Permoserstraße 15, 04318 Leipzig, Germany
2 Hydrogeology and Environmental Geology, Urban & Environmental Engineering Research Unit,
University of Liege, 4000 Liege, Belgium; [email protected] (P.O.); [email protected] (A.D.)
3 Hydraulics in Environmental and Civil Engineering (HECE), Urban & Environmental Engineering
Research Unit, University of Liege, 4000 Liege, Belgium; [email protected] (P.A.); [email protected] (V.K.); [email protected] (S.E.)
* Correspondence: [email protected] / [email protected]; Tel.: +49-341-235-1784 Received: 23 March 2020; Accepted: 3 May 2020; Published: 8 May 2020
Abstract: Underground pumped-storage hydropower (UPSH) is a promising technology to manage the electricity production in flat regions. UPSH plants consist of an underground and surface reservoirs. The energy is stored by pumping water from the underground to the surface reservoir and is produced by discharging water from the surface to the underground reservoir. The underground reservoir can be drilled, but a more efficient alternative, considered here, consists in using an abandoned mine. Given that mines are rarely waterproofed, there are concerns about the consequences (on the efficiency and the environment) of water exchanges between the underground reservoir and the surrounding medium. This work investigates numerically such water exchanges and their consequences. Numerical models are based on a real abandoned mine located in Belgium (Martelange slate mine) that is considered as a potential site to construct an UPSH plant. The model integrates the geometrical complexity of the mine, adopts an operation scenario based on actual electricity prices, simulates the behavior of the system during one year and considers two realistic scenarios of initial conditions with the underground reservoir being either completely full or totally drained. The results show that (1) water exchanges may have important consequences in terms of efficiency and environmental impacts, (2) the influence of the initial conditions is only relevant during early times, and (3), an important factor controlling the water exchanges and their consequences may be the relative location of the natural piezometric head with respect the underground reservoir.
Keywords: energy storage; renewable energy; hydropower; mining; groundwater; numerical modelling
1. Introduction
The development and use of renewable and carbon-free energies is needed to meet the Paris Agreement goal of limiting the temperature increase due to climate change below 2 °C [1]. However, some renewable sources of energy, such as photovoltaic or wind energy, are not perfectly efficient because they are variable, and their production does not match the demand. This fact does not contribute to extend the use of renewable energies [2]. In this context, energy storage systems (ESS) become essential to increase the efficiency and encourage the use of intermittent renewable energies [3]. These systems allow storing the excess of energy generated during low demand periods and
producing electricity when the demand increases [4,5]. The most widely used ESS is pumped-storage hydropower (PSH) [6] because of its high capacity to store and produce electricity. PSH plants consist of two reservoirs located at different elevations. The excess of energy generated during low demand periods is used to pump water from the lower to the upper reservoir, thus storing the energy in the form of potential energy, and electricity is produced when the demand increase by discharging water from the upper reservoir into the lower one through turbines. PSH has some drawbacks mainly linked to reservoirs creation, such as impacts on landscape, land use, environment and society (relocations may be needed) [7,8], but its main limitation is the topography, since the reservoirs must be located close to each other and at different elevations. Therefore, PSH cannot be used in relatively flat areas. Contrary, underground pumped hydropower storage (UPHS) is a potential alternative to store and manage the electricity production in regions whose flat topography does not allow using PSH. UPHS plants consist of two reservoirs from which the lower one is underground while the upper one may be located at the land surface or at shallow depth [9]. The concept of UPSH is not new [10] and numerous authors have investigated its suitability as ESS in different countries such as Singapore [7], USA [11,12], South Africa [13–16], The Netherlands [17,18], Germany [19–21], Belgium [22,23] or Spain [24]. In addition, different aspects related with UPSH, such as the influence of pressure inside the underground reservoir on the efficiency [25,26], the waves heights as a result of the particular geometry of underground reservoirs [27] or the stability of the underground infrastructures [28], have been considered. However, given the range of possible reservoir configurations and soil properties, more investigation is needed about the water exchanges between the underground reservoir and the surrounding medium and their associated consequences.
The underground reservoir can be drilled, but, to reduce the costs, a suitable option is to use abandoned mines. Theoretically, impacts on landscape, land use and environment produced by UPSH are lower than those produced by PSH. Moreover, UPSH could contribute to the economic development of local communities after the cessation of mine activities if abandoned mines are used. However, given that mines are rarely waterproofed, water exchanges will occur between the underground reservoir and the surrounding medium, which is saturated most of the times. The consequences of water exchanges, and thus, the interaction between UPSH and the surrounding medium, is one of the most challenging aspects of this technology because water exchanges may impact the natural distribution of groundwater [29], its quality [30–32], and the efficiency of the UPSH plant [33]. Although previous investigations have addressed those issues, most of them are based on synthetic scenarios under ideal conditions and during short periods of time, which minimizes the representativeness of the obtained results. Thus, investigation based on real mines considered for the construction of UPSH plants is needed involving numerical simulation of long periods of time and taking into account most of the geometrical complexities inherent to underground mines.
The objective of this work is to investigate the evolution of the water exchanges between the underground reservoir and the surrounding medium and how they may affect the groundwater behavior around the UPSH plant and the hydraulic head inside the underground reservoir. The main novelties of this paper are that (1) it is based on a real mine that has been chosen as a potential location where constructing a future UPSH plant [34]; (2) the geometrical complexity of a real mine is considered; (3) contrary to the previous studies, the system behavior is modelled and studied during a long period of time; (4) the considered operation scenario is based on actual electricity price curves to avoid no-realistic sinusoidal or other regular operation scenarios; and (5), two different initial conditions related with the previous activities developed to prepare the mine to be used as an underground reservoir are considered. In sum, this work provides an overall view of the interaction between UPSH plants and groundwater in a real site and considering realistic assumptions. However, main findings can be extrapolated qualitatively to other mines used as underground reservoirs for UPSH. In general terms, the interaction between other underground reservoir and groundwater should be similar.
2. Materials and Methods 2.1. Problem Statement
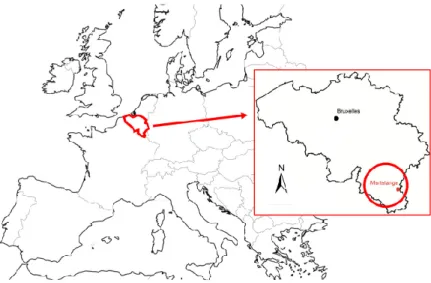
The numerical model is constructed taking as reference the Martelange slate underground mine. This mine is located in southeast Belgium, specifically, in the Ardennes region (Figure 1) and its exploitation was abandoned in 1995.
Figure 1. Geographical location of the mine in Martelange that is considered as possible underground reservoir for underground pumped-storage hydropower (UPSH) and is modelled in this study.
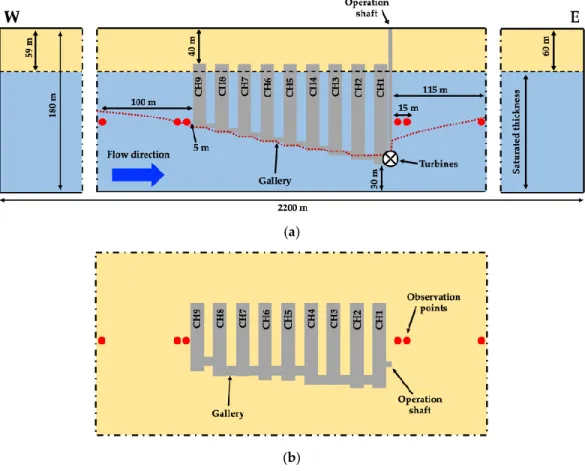
The mine was exploited following the ‘room and pillar’ mining method and consists of 9 underground adjacent rooms (from now on called chambers—CH) connected by galleries. Approximately, the size of the chambers is 15 m (width) by 45 m (long) and their heights vary ranging from 110 m to 70 m (the heights decrease from east to west as shown in Figure 2). Heights are variable since the top of all chambers is located at the same depth (at 40 m below the surface) while the depths of the bottoms increase from west to east direction (Figure 2). The increment from one chamber to the adjacent one in the east to west direction is of 5 m. Thus, the bottoms are 110, 115, 120, 125, 130, 135, 140, 145 and 150 m deep for chambers CH9, CH8, CH7, CH6, CH5, CH4, CH3, CH2 and CH1, respectively. In addition, there is a 170-m-deep extraction shaft that links the mine to the surface located close to CH1 [23,34]. The volume of mine water that can potentially be used to store and produce electricity is approximately 400,000 m3. This volume is calculated by considering that (1) the
10% of its maximum capacity is not pumped to avoid the total dry of the underground reservoir, and (2) the hydraulic head inside the underground reservoir does not exceed its elevation in natural conditions. In addition to its high capacity, this potential UPSH plant could reach a mean effective hydraulic head difference of 215 m if the surface reservoir is constructed strategically at 500 m in the northwest direction [34]. Finally, it is important to consider for the assessment of the water exchanges that the natural piezometric head is located near the top of the chambers, thus, after the cessation of the mining activities, the mine is flooded. From this point forward, the term “hydraulic head” refers to the water head inside the underground reservoir whilst “piezometric head” refers to the groundwater head.
Geologically, the mine is located in a fractured slate formation that belongs to the 'Formation de La Roche' of the lower Devonian age in the Ardennes anticlinorium in southeast Belgium. More accurately, those slates dated of the Praguian age (Lower Devonian) when the transgressive seas of the lower Devonian were at their maximum. Clays and silts were first transformed in claystones and siltstones, and then in phyllites due to metamorphism. They have undergone multiple phases of deformation metamorphism, now forming dark fractured slates with a locally thin bed of quartzites. The main slate cleavage (schistosity) is not parallel to the bedding plane but was induced orthogonally to the main stress conditions during metamorphism phases. The slate has a low hydraulic conductivity and the relative continuity of the groundwater flow can only be assumed
because of the multiple fractures. However, locally, isolated aquifer compartments cannot be excluded.
(a)
(b)
Figure 2. Schematic cross section (a) and plan view (b) of the study site. In (a), the black dashed line indicates the natural position of the piezometric head that agrees with the initial conditions of scenario F-CI and the red dotted line shows the initial piezometric head of scenario E-CI.
2.2. Numerical Model 2.2.1. Code
The groundwater numerical model is developed using the finite element numerical code SUFT3D [35,36]. This code uses the Control Volume Finite Element (CVFE) method to solve the groundwater flow equation based on the mixed formulation of Richard’s equation proposed by Celia et al. [37]:
= ∇ ∙ ( )∇ℎ + ∇ ∙ ( )∇ + (1)
where is the water content [-], t is the time [T], h is the pressure head [L], z is the elevation [L], q is a source/sink term [T−1], and is the hydraulic conductivity tensor [LT−1], which is given by
= (2)
where is the saturated permeability tensor [LT−1] and is the relative hydraulic conductivity
[-] that varies between a value of 1 for the full saturation of the pores by water to a value of 0 when the water phase is considered immobilized [38]. The value of in the transition band between the saturated and unsaturated zones evolves according with the following equations [39]:
= ( − )
(ℎ − ℎ )(ℎ − ℎ ) (3)
( ) = −
where is the saturated water content [-], is the residual water content [-], ℎ is the pressure head at which the water content is the same as the residual one [L], and ℎ is the pressure head at which the water content is lower than the saturated one [L]. The value of between the saturated and unsaturated zones evolves linearly as can be deduced from Equation (3) and Equation (4). This fact does not noticeably affect the results since they are focused on the saturated zone, while it minimizes convergence errors that occur when using other more complex equations to define the transition between the saturated and unsaturated zones.
SUFT3D is chosen because it is specifically designed for integrating underground cavities, such as the underground mines, in a groundwater numerical model. This fact allows improving the modelling of the groundwater dynamics affected by the presence of underground cavities. The underground cavities, in this case the underground chambers of the Martelange slate mine, are modelled as linear reservoirs taking advantage of the Hybrid Finite Element Mixing Cell (HFEMC) method. The HFEMC method [35,36], which is implemented in the SUFT3D code [40–42], is a flexible method combining advantages of black-box models together with physically based and spatially distributed models. Basically, the HFEMC method allows dividing the domain into different subdomains according to their nature. The subdomains can behave as porous medium or as linear reservoirs. The unmined areas are discretised with finite elements and the groundwater flow equation in variably saturated porous media (Equation (1)) is solved for computing the spatially distributed piezometric head. The underground cavities (i.e., mine chambers) are discretized as single mixing cells and modelled as linear reservoirs. These linear reservoirs are equivalent to a box model technique where only a mean hydraulic head is calculated. In terms of hydraulic behaviour, the linear reservoirs are equivalent to zones discretised with finite elements with a very high hydraulic conductivity and a porosity of 1. Groundwater exchange between linear reservoirs and porous medium varies linearly as function of the water level difference between them [43] according to an internal dynamic Fourier BC [36] defined as follows:
= ′ ℎ − ℎ ((5)
where is the exchanged flow [L3T−1], ℎ is the piezometric head in the aquifer [L], ℎ is the
hydraulic head in the underground reservoir [L], is the exchange area [L2] and ′ is the exchange
coefficient [T−1]. Note that the water velocity inside each mixing cell is neglected. In the present study,
despite that the whole mine could have been modelled as a single, linear reservoir; each chamber was modelled as an individual linear reservoir. This particularity does not affect the results and will allow using the model in future works for analysing the volume of exchanged water through each chamber or for assessing the system behaviour considering that less chambers are used as underground reservoir.
Another reason for choosing SUFT3D is that it allows implementing virtual connections. A virtual connection, also called “by-pass” allows connecting non-adjacent subdomains modelled as linear reservoirs. These virtual connections are governed by a first-order transfer equation (Equation (5)) that can be switched on or off using a specific threshold depending on the difference of the hydraulic head between the two connected linear reservoirs.
= ℎ − ℎ ((6)
where is the flow between reservoirs, is the exchange coefficient of the virtual connection [L2T−1], ℎ and ℎ are the hydraulic head inside each one of the connected linear reservoirs.
Firstly, a virtual connection is adopted to extract water when the 100% of the underground reservoir is filled, which occurs when the elevation of the hydraulic head in natural conditions is exceeded. This virtual connection links the underground with a small “fake” subdomain totally isolated and located at a corner of the modeled domain. The virtual connection is commonly switched-off and it is only activated when the hydraulic head reaches the elevation of the natural hydraulic head. A very high value (106 m2/d) is adopted for to ensure that the needed volume of water is immediately
extracted to avoid exceeding the elevation of the hydraulic head in natural conditions. Secondly, a virtual connection is used at each one of the nine chambers to avoid a hydraulic head lower than their bottoms. In this case, the adopted value for is also very high (106 m2/d) to ensure that water could
is deactivated only when the hydraulic head is at the bottom of a chamber. This virtual connection allows disconnecting individually each chamber from the operation shaft when the hydraulic head is too low.
2.2.2. Model Characteristics
The main characteristics of the model are as follows:
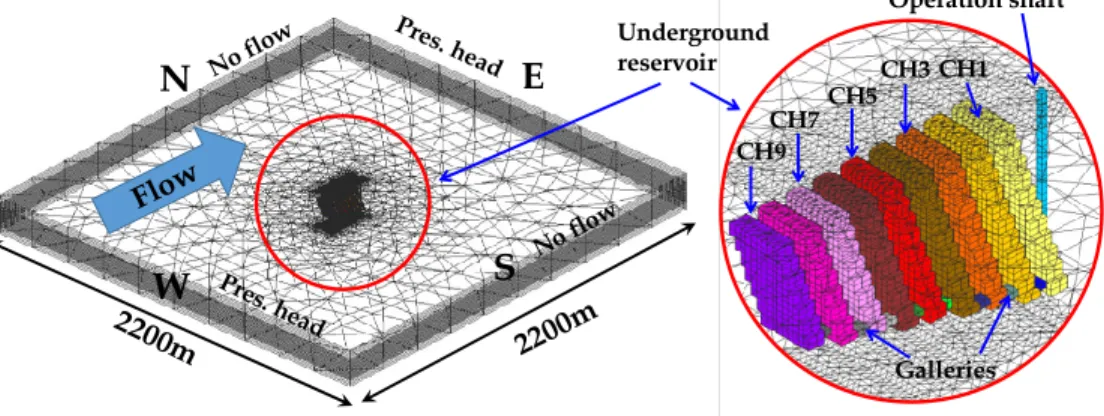
Underground reservoir: The underground reservoir consists of nine underground chambers (CH1 to CH9) linked by galleries located at their bottoms. Each pair of contiguous chambers are linked with one gallery. In addition, a rectangular prism, which links the underground reservoir to the surface, is added adjacent to the CH1 (Figures 2 and 3) to conceptually represent the shaft through which water is pumped and discharged (from now called operation shaft).
Model dimensions: The modeled domain consists in a square with a side of 2200 m and a height of 180 m (Figures 2 and 3). The chambers (i.e., the underground reservoir) are located in the middle of the domain, approximately, at a distance of 1000 m from the external boundaries of the model. This distance is enough to minimize the influence of the external boundaries on the groundwater dynamics around the underground reservoir.
Figure 3. General view of the numerical model (left) and detailed view of the modelled chambers and operation shaft (right). The bottom of the chambers increases from 110 to 150 m depth in the flow direction.
Spatial discretization: The mesh is made up of prismatic 3D elements and is divided vertically in 29 layers. The horizontal size of the elements decreases towards the underground reservoir (from 150 m near the external boundaries to 5 m in the center of the domain) (Figure 3). The number of elements and nodes is 64844 and 38680, respectively.
Temporal discretization: The simulation period covers one year and the simulation time step is 15 minutes. Induced piezometric head oscillations are relatively large and convergence problems arise in the limit between the saturated and unsaturated zone if time steps are larger than 15 minutes.
Hydraulic parameters: The hydraulic parameters used in the model are typical of slate mines and are representative of the known underground properties at the considered mine site [44,45]. The hydraulic conductivity is 10−7 m/s, the specific storage coefficient is 10−4 m−1, the saturated
water content is 0.05 and the residual water content is 0.01.
Boundary conditions (BCs): Pumping from and discharge into the underground reservoir are simulated by prescribing the flow at the bottom of the operation shaft (Neuman BC). An internal dynamic Fourier BC, which is head-dependent [35], is implemented to simulate the groundwater exchanges between the underground reservoir (chambers and operation shaft) and the surrounding medium. Regarding the external boundaries, the piezometric head is prescribed (Dirichlet BC) at an elevation with respect the bottom of the model of 121 and 120 m on the upgradient (W) and downgradient (E) sides, respectively. As a result, the underground reservoir is practically flooded (saturated) in natural conditions and groundwater flows from W to E with
2200m 2200m Flow Pres . head Pres. head No flo w
W
CH1N
S
Underground reservoirE
No flo w CH5 CH3 CH7 CH9 Galleries Operation shafta hydraulic gradient of 4.6·10−4. The boundary conditions adopted at the external boundaries are
maintained constant through the simulations. This fact is a simplification since the piezometric head at the Martelange site oscillates slightly seasonally [46]. However, seasonal oscillations are small enough to not alter the results noticeably. Finally, no-flow BCs are adopted at the top and the bottom of the model and at the N and S boundaries.
Modeling approach: The domain, except the linear reservoir, is modeled as a porous medium, thus the fractured medium is replaced by an Equivalent Porous Medium (EPM) approach. Although the EPM approach does not allow modelling individual fractures [47] it is suitable for estimating the global behaviour of such a system and computing the main trends. Several studies have demonstrated the efficiency of the EPM approach for modelling fractured aquifers, among others, [48,49]. In addition, the presence of multiple fractures in the study site induces the continuity of the groundwater behavior like in a porous medium.
2.2.3. Initial Conditions—Scenarios
Two different scenarios that differ in the initial conditions are simulated (F-CI and E-CI) (Figure 2). In scenario F-CI, it is assumed that the piezometric head before the start of the UPSH plant is located at the top of the underground reservoir, thus, it is undisturbed. This situation mimics the initial conditions after a long period of inactivity of the plant, during which the piezometric head returns to its natural position. In E-CI, the underground reservoir is empty, and the piezometric head is located at its bottom. This scenario aims to represent the initial conditions after a dewatering for undertaking rehabilitation works, which would be probably needed for adapting the mine to an underground reservoir. The initial conditions of E-CI are computed by prescribing the head at the bottom level of the operation shaft until steady state hydrogeological conditions are reached. The computed steady state pumping rate for dewatering the mine is about 110 m3/d.
2.2.4. Operation Scenario
The objective of this study was not to define the best operation scenario of an UPHS plant, but to look for the response of the system with realistic operation conditions. Therefore, in order to have a pumping–discharge frequency more realistic than sinusoidal or other regular cycles, it was decided to build the operation scenario from electricity price curves. Three 14-day hourly electricity price curves during winter, summer and spring 2013 in Belgium were used. They typically show low electricity price during the night and two peaks in electricity price during the day (around noon and in the evening). The process to derive the pumping-discharge frequency was as follows:
1. Two realistic constraints were adopted. These consisted of (1) establishing the duration of pumping and discharge phases to 5 hours, and (2) assuming that the usable volume of the underground reservoir is completely emptied and filled once a day. Therefore, there are 14 hours per day during in which no operations are carried out and the system is in the same condition at the beginning of every day (underground reservoir filled at maximum).
2. Frequencies were defined on an hourly basis to maximize economic benefit of the plant operation, i.e. to maximize the balance between electricity cost during pumping and money income when discharging. Every hour, a choice was made between three possibilities (pumping, discharge or no-operation) in order to get at the end of the day 5 hours of pumping, then 5 hours of discharge and 14 hours of no-operation. Pumping, discharge or no-operation hours are not necessary consecutive. For each day, the cheapest 5 hours are selected for pumping, and the most expensive 5 hours for discharge.
Figure 4 displays the 14-day electricity price curves and the derived operation scenarios. It is possible to appreciate that pumping occurs during low cost periods while generation (discharging) matches the peaks in electricity price.
(a) (b)
(c)
Figure 4. Fourteen-day electricity price curves (black line) and operation scenarios (red line) of three seasons: (a) winter, (b) spring-autumn, and (c) summer. Letters D and P refer to discharge and pumping phases.
The scenario for each season was completed by repeating the 14-day curves and the annual curve by assuming that the electricity price curve for autumn is analogous to that of spring. Simulations start the first day of winter (i.e., December 21) to avoid interruptions within the same season. Considering that the maximum pumping/discharge phase duration during a day is 5 hours and that during this phase the usable volume of the underground reservoir is completely filled or emptied, pumping and discharge rate is about 24 m3/s.
Note that operation scenario was defined neglecting the water exchanges between the underground reservoir and the surrounding porous medium because they were not previously known. In fact, a groundwater numerical model like that presented in this paper is needed to estimate the water exchanges. Water exchanges between the underground reservoir and the surrounding medium may modify the hydraulic head inside the underground reservoir, and therefore, the underground reservoir may be filled or emptied at a different velocity than when water exchanges are neglected. This fact can give rise to two delicate situations:
1. The underground reservoir is filled faster than when water exchanges are neglected, and therefore, water cannot be discharged despite it is required given the defined pumping– discharge frequency.
2. The underground reservoir is emptied faster than when water exchanges are neglected. In this case, water cannot be pumped despite it is required by the defined pumping–discharge frequency. In the modeled case, this situation only arises at the beginning of the scenario E-CI when an initial pumping is not allowed because the underground reservoir is totally filled. During the rest of the simulations, this situation never arises again since inflows of water from the surrounding medium into the underground reservoir are always higher than outflow. This means that although pumping or discharge periods are required considering the evolution of the demand (i.e., electricity price), if the capacity of the underground reservoir is exceeded, they are not carried out. Consequently, the operation scenario is slightly varied from that defined using the evolution of the electricity price, given that the amount of exchanged water cannot be known in
advance. The modification of the operation scenario is automatically done by the numerical model by using internal BCs. Water discharge is avoided when the underground reservoir is totally filled by introducing an internal BC that consists in a virtual connection. This BC ensures the maximum capacity of the underground reservoir is not exceeded. Similarly, an internal BC is implemented at each one of the 9 chambers to avoid a hydraulic head lower than their bottoms. Figure 5 displays the evolution of pumping and discharge rates during the 10 first days of the simulations for scenarios F-CI (Figure 5a) and E-F-CI (Figure 5b). Negative values mean that water is pumped while positive ones mean that water is discharged. The discharge in F-CI is lower than 24 m3/s during some periods
because the underground reservoir is filled, and thus, the internal BC flows out a part of the discharged water. Despite the same operation scenario is considered, scenario F-CI starts with a pumping because the underground reservoir is initially filled while scenario E-CI starts with a discharge because the underground reservoir is empty and water cannot be pumped.
(a) (b)
Figure 5. Effective operation scenario for (a) scenario F-CI, where the underground reservoir is initially full of water, and (b), scenario E-CI where the underground reservoir is initially dewatered. 3. Results and Discussion
3.1. Piezometric Head Evolution
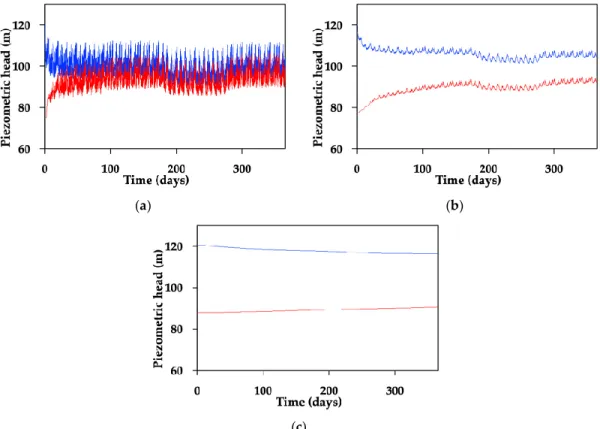
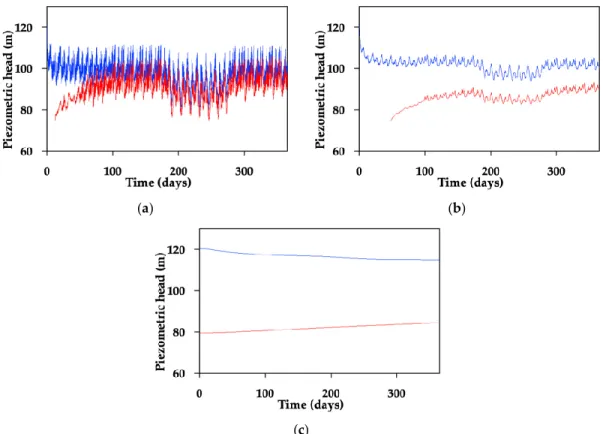
Figures 6 and 7 show the piezometric head evolution at three observation points located at different distances from the underground reservoir (Figure 2) in the upgradient and downgradient directions, respectively. Piezometric head computed for the F-CI and E-CI scenarios are displayed in blue and red colors, respectively. The piezometric head is calculated taking as reference the bottom of the model; thus, the units are meters above the bottom of the model. Observation points located on the upgradient side (Figure 6) are located at 5, 15 and 100 m from the underground reservoir and at a depth of 105 m (75 m above the bottom of the model), while those located downgradient are located at 5, 15 and 105 m from the underground reservoir, and also, at a depth of 105 m (Figure 2). The nearest chamber to the upgradient observation points is CH9 while CH1 is the closest one to downgradient observation points. The comparison between Figures 6 and 7 shows that the response of the piezometric head is the same in the upgradient and downgradient directions. The only difference is the mean elevation of the piezometric head at each observation point that depends on the prescribed BC in the outer boundaries of the model. The mean piezometric head decreases from upgradient to downgradient, and for this reason, it is slightly higher in Figure 6 than in Figure 7. Note that some values are missing during early times at some observation points, especially in Figures 7a,b. This means that the elevation of the piezometric head is lower than that of the observation point (i.e., 105 m depth).
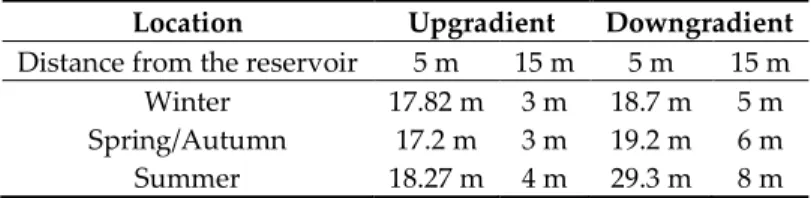
In both scenarios, there is a period of time between 180 and 270 days during which the behavior of the piezometric head is different. During that period, the mean piezometric head decreases and the magnitude of the oscillations increases. This increase is difficult to appreciate in the figures, especially at those showing the piezometric head evolution at the upgradient side. Table 1 summarizes the difference between maximum and minimum piezometric heads during the winter, spring/autumn and summer periods considering the F-CI scenario. Results concerning the four closer
Time (days) P u m p in g /d is ch ar g e ra te ( m 3/s ) Time (days) P u m p in g /d is ch ar g e ra te ( m 3/s )
observation points to the underground reservoir are shown (2 at the upgradient and 2 at the downgradient side). This particular behavior is a consequence of the operation scenario during the summer period when no-operation periods between pumping and discharge are generally longer than in other seasons, which agrees with the fact that sunset occurs later in summer. The mean piezometric head decreases more than in other seasons because during the long no-operation periods between pumping and discharge, the hydraulic head inside the underground reservoir is at a low elevation for longer periods compared to other seasons. As a result, during this period, groundwater flows from the surrounding medium towards the underground reservoir, and the head decreases accentuating the consequences of pumping. This behavior is the result of the low hydraulic conductivity of the surrounding medium and the volume of the underground reservoir. A long time, during which the piezometric head decreases because water is flowing into the underground reservoir, would be needed after a pumping period to fill the volume of pumped water. Given that this time is longer than the non-activity period, the piezometric head decreases during it. If the hydraulic conductivity would be high, a shorter time would be needed to fill the pumped volume of water, and once the hydraulic head had reached the same level than the piezometric head, both of them would slowly increase during the rest of the non-activity period. The magnitude of the oscillations increases because (1) more water enters into the underground reservoir during the no-operation periods after pumping increasing the drawdown, and (2), the hydraulic head inside the underground reservoir reaches a higher elevation during the discharge periods than in other seasons because the additional inflow during no-operation periods fills partially the underground reservoir.
Table 1. Difference between maximum and minimum piezometric heads during the winter, spring/autumn and summer periods considering the F-CI scenario.
Location Upgradient Downgradient
Distance from the reservoir 5 m 15 m 5 m 15 m Winter 17.82 m 3 m 18.7 m 5 m Spring/Autumn 17.2 m 3 m 19.2 m 6 m Summer 18.27 m 4 m 29.3 m 8 m
The piezometric head oscillations are indeed a consequence of the pumping and discharge operations, but oscillations are only clearly observed close to the underground reservoir since the hydraulic conductivity of the surrounding rocks is relatively low. Thus, the impact of UPSH on surrounding aquifers decreases with low values of hydraulic conductivity since the distance at which groundwater oscillations occur decreases as the hydraulic conductivity is reduced. The magnitude of the oscillations increases towards the underground reservoir in both scenarios. The magnitude of the oscillations calculated at the observation points located at 5 m from the underground reservoir is always higher in scenario F-CI than in scenario E-CI at the beginning of the simulation. This fact is a consequence of the elevation and evolution of the piezometric head. Given that the mean piezometric head around the underground reservoir is lower in scenario E-CI than in F-CI, the saturated thickness, and thus, the transmissivity are also lower. Therefore, the effects of the hydraulic head oscillations in the underground reservoir are more transmitted to the surrounding rocks in scenario F-CI than in E-CI. This difference decreases with time because the saturated thickness around the underground reservoir increases in E-CI and so does the transmissivity. At the observation points located at 15 m, it seems that the magnitude of the oscillations is always higher in F-CI than in E-CI. In this case, the saturated thickness is more dependent on the global evolution of the aquifer and more time is needed in scenario E-CI to reach the same saturated thickness than in scenario F-CI.
(a) (b)
(c)
Figure 6. Piezometric head evolution at three observation points located at the upgradient side of the underground reservoir and at 105 m depth. Results of F-CI scenario are displayed in blue while those of E-CI scenario are plotted in red. The observation points are located at 5 (a), 15 (b) and 100 m (c) from the underground reservoir. The piezometric head is calculated taking as reference the bottom of the model, thus, the units are meters above the bottom of the model.
Results also show that the piezometric head tends to decrease in F-CI and to increase in E-CI. It is possible to deduce that the piezometric heads of both scenarios tend to converge, and therefore, the final piezometric head will be the same. In addition, the final piezometric head will oscillate around a lower elevation than that in natural conditions. This fact contrasts with previous studies which suggest that the piezometric head after a long operation period tends to reach a pseudo-steady state and oscillates around the elevation of the piezometric head under natural conditions [29]. The difference with respect to the previous studies is a direct consequence of the relationship between the natural piezometric head and the geometry of the underground reservoir. The natural piezometric head is located at the top of the underground reservoir, and therefore, when the hydraulic head reaches that level, the underground reservoir is totally filled and additional water discharge in the underground reservoir is avoided. Thus, the hydraulic head inside the underground reservoir, and therefore the piezometric head in the surrounding medium, is never higher than that in natural conditions. Consequently, given that the elevation of the natural piezometric head is only reached at the end of some pumping periods, the piezometric head must oscillate around an elevation lower than that in natural conditions. In other words, the overall inflow towards the underground reservoir is larger than outflow since most of the time the hydraulic head in the underground reservoir is located below the elevation of the natural piezometric head, which is only reached at the end of some pumping periods. Thus, if inflow is larger than outflow, the mean piezometric head—when the pseudo steady state is reached in both scenarios—must be the same and lower than that in natural conditions. Pujades et al., [29] considered an open pit mine and they did not constrain the maximum elevation of the hydraulic head inside the lower reservoir. Therefore, overall inflow was equal to the outflow and the piezometric head oscillated around its elevation in natural conditions when the pseudo-steady state was reached. If the elevation of the natural piezometric head was lower than that
considered in the simulations but higher than 50% of the reservoir volume used for energy storage, the mean piezometric head after a long operation period would be less decreased, and if the natural piezometric head was located just at an elevation corresponding to 50% of the reservoir volume used for energy storage, the mean piezometric head when the pseudo-steady state was reached would be equal to that in natural conditions.
(a) (b)
(c)
Figure 7. Piezometric head evolution at three observation points located at the downgradient side of the underground reservoir and at 105 m depth. Results of F-CI scenario are displayed in blue while those of E-CI scenario are plotted in red. The observation points are located at 5 (a), 15 (b) and 105 m (c) from the underground reservoir. The piezometric head is calculated taking as reference the bottom of the model, thus, the units are meters above the bottom of the model.
Although the global decrease of the piezometric head F-CI is driven by the water exchanges (i.e., more water enters into the underground reservoir than flows out), the behavior of the piezometric head in scenario E-CI also depends on other factors. In this case, the piezometric head increases because groundwater enters through the external boundaries of the model to recover the depressed piezometric head produced by the initial pumping.
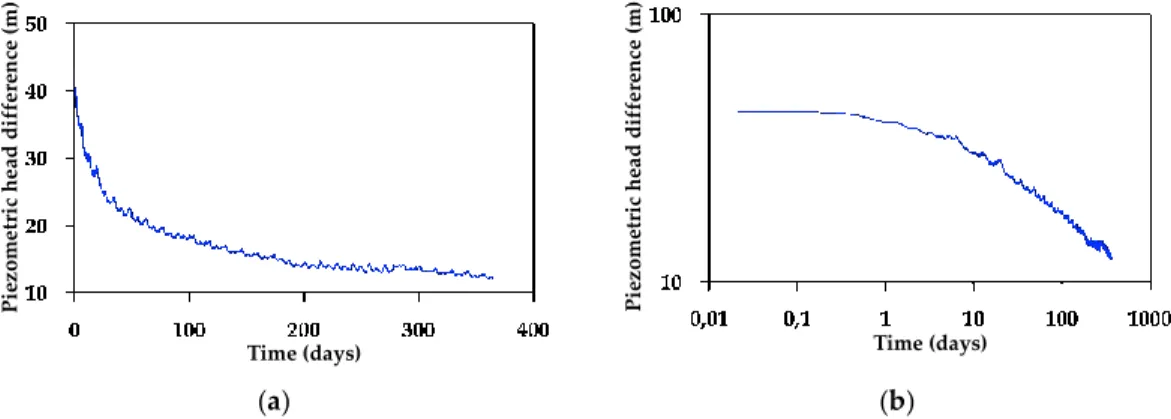
The piezometric head difference between both scenarios should be zero when the pseudo steady state is reached. At the observation points located far from the underground reservoir (Figures 6c and 7c), it is clearly observed that the difference between scenarios decreases constantly and much more time than the simulated year is needed to reach the pseudo steady state and become equal. However, it seems that the piezometric head difference between both scenarios is stabilized at the end of simulations at observation points located close to the underground reservoir (Figures 6a,b, 7a,b). If the piezometric head difference between scenarios is analyzed at an observation point located close to the underground reservoir (Figure 8), it is observed that it follows a decreasing trend. Figure 8 shows the piezometric head difference between the two simulated scenarios in an observation point located 15 m from the underground reservoir at the upgradient side (Figure 6b). Positive values mean that the piezometric head is higher in F-CI than in E-CI. The piezometric head difference between the two examined scenarios is large at the beginning of the simulations, which agrees with the initial conditions, and subsequently, it decreases because the piezometric head recovers (i.e., increases) in
E-CI and decreases in F-CI, but the lowering rate decays with time. In fact, the decrease after a long period of time can only be appreciated using a logarithmic scale (Figure 8b). This behavior is consistent with the aquifer dynamics where after a hydraulic perturbation, the recovery rate decreases with time, and after an initial abrupt response, a long period of time is needed to reach unperturbed conditions.
(a) (b)
Figure 8. Difference of the piezometric head evolution between scenarios F-CI and E-CI in an observation point located at 15 m upgradient from the underground reservoir and at 105 m depth. (a) Results are plotted with linear axis; (b) shows the piezometric head difference evolution with logarithmic axis.
3.2. Hydraulic Head Evolution
Figure 9 shows the hydraulic head evolution inside the chambers (CH1 to CH9) during the first five simulated days for both scenarios. The minimum hydraulic head reached in each chamber during the pumping periods is different because the bottoms of the chambers are located at different elevations. As previously explained, an internal boundary condition ensures that the hydraulic head inside a specific chamber is not lower than the elevation of the bottom of the chamber. Therefore, as the depth of the bottoms increases gradually from CH9 to CH1 in steps of 5 m, the minimum hydraulic heads are 70, 65, 60, 55, 50, 45, 40, 35 and 30 m for chambers CH9, CH8, CH7, CH6, CH5, CH4, CH3, CH2 and CH1, respectively.
(a)
(b)
Figure 9. Hydraulic head evolution inside the chambers for scenarios (a) F-CI and (b) E-CI.
The hydraulic head evolves equally in chambers CH1 to CH3 (except at the beginning of E-CI) because pumping is not allowed when the volume of water inside the underground reservoir is lower than the 10% of its maximum capacity. Consequently, the minimum hydraulic head reached during pumping periods is about 43 m, which is higher than the elevation of the bottoms of CH1, CH2 and CH3. The largest differences between scenarios are observed at the beginning of the simulations and are consequence of the different initial conditions, but after one simulated day, the hydraulic head evolves in the same way in both scenarios. A more detailed calculation of the hydraulic head
Time (days) P ie z o m et ri c h e ad d if fe re n ce ( m ) Time (days) P ie z o m et ri c h ea d d if fe re n ce ( m )
evolution inside the chambers is provided by Kitsikoudis et al., [50] since in this study water velocity inside the chambers is neglected and it is assumed an instantaneous repartition of the water volumes in every chamber. The hydraulic head evolution inside the chambers is only shown to illustrate the influence of water exchanges.
Influence of water exchanges on the hydraulic head can be observed in periods during which water is not pumped nor discharged, especially when the hydraulic head is located at the top or at the bottom of the underground reservoir. When the hydraulic head is located at the top, it decreases slightly because water flows from the underground reservoir towards the surrounding medium. On the contrary, when the hydraulic head is located at the bottom, it increases because water is entering from the surrounding medium. Although it is difficult to be seen in Figure 9, when the hydraulic head is at the top of the underground reservoir, it decreases faster in scenario E-CI than in F-CI, which agrees with the initial conditions. The mean piezometric head in the surrounding medium is lower in E-CI than in F-CI (Figures 6 and 7), and thus, the hydraulic gradient from the underground reservoir towards the surrounding medium is larger in E-CI than in F-CI when the hydraulic head is at the top. As a result, more water flows out in E-CI than in F-CI. Differences between scenarios are difficult to appreciate, and they can even be neglected, since they are related with the progressive recovery of the piezometric head after the initial simulated pumping in E-CI and this recovery is relatively slow. This fact can be also appreciated in Figures 6c and 7c, where it is observed that the piezometric head far from the underground reservoir recovers very slowly in E-CI.
3.3. Water Exchanges
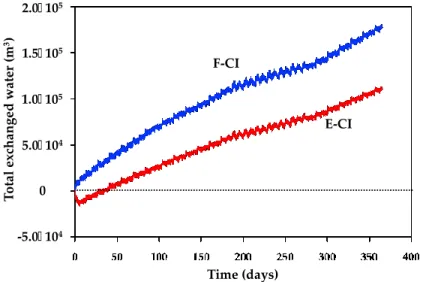
Figure 10 shows the evolution of total volume of water (in m3) that is exchanged between the
underground reservoir and the surrounding medium for scenarios F-CI (blue) and E-CI (red). Total volume refers to the difference between the water that enters into the underground reservoir (inflow) and water that flows towards the surrounding medium (outflow). Thus, positive values mean that volume of water flowing into the underground reservoir is greater than what is flowing towards the surrounding medium.
Figure 10. Total volume of exchanged water (m3) for the F-CI (blue) and E-CI (red) scenarios. Total
volume of exchanged water refers to the difference between water that enters into the underground reservoir and water that flows towards the surrounding medium. Positive values mean that, globally, more water is entering into the underground reservoir while negative values occur when outflow is higher than inflow.
The total volume of water entering into the underground reservoir is higher than that flowing out because, as explained previously, the hydraulic head inside the underground reservoir cannot exceed the elevation of the natural piezometric head that is located at the top of the underground
Time (days) E-CI F-CI -5.0 104 0 5.0 104 1.0 105 1.5 105 2.0 105 T o ta l ex ch an g ed w at er ( m 3)
reservoir. Consequently, the mean piezometric head around the underground reservoir is lower than that in natural conditions, and thus, groundwater from the surrounding medium tends to flow towards the reservoir. The only exception occurs during the first simulated days of scenario E-CI. During this period of time, the piezometric head is so low (below the bottom of the operation shaft and below most of the chambers) that water can only flow out the underground reservoir. After this initial period, inflow becomes increasingly important with respect to outflow and after 100 days the ratio between inflow and outflow is apparently equal to that occurred in scenario F-CI. This fact is deduced from the curves in Figure 10, which have a similar slope after the initial period. Thus, the total volume of water exchanged evolves in the same manner.
The mean piezometric head around the underground reservoir decreases in scenario F-CI. Therefore, the hydraulic gradient between the surrounding medium and the underground reservoir is lower after pumping periods and higher after discharge periods than those occurred during initial times when the piezometric head is located at a higher elevation. As a result, it would be reasonable to expect that inflow decreases and outflow increases, and thus, that the total volume of exchanged water tends to stabilize. However, the total volume of exchanged water increases constantly indicating that outflow is always lower than inflow. This fact is related with the elevation of the piezometric head in natural conditions that is prescribed at the outer boundaries and controls the water exchanges. Given that there is a depression of the piezometric head around the underground reservoir, water from the aquifer is mainly flowing towards the reservoir, and therefore, inflow is always higher than outflow and the difference between them does not decrease. For the same reason, inflow is higher than outflow in E-CI despite the piezometric head around the underground reservoir is relatively low. The elevation of the piezometric head in natural conditions, and therefore the elevation of the piezometric head far from the underground reservoir, is the same in scenario E-CI than in scenario F-CI. Therefore, given that the piezometric head is depressed around the underground reservoir, water mainly flows towards the underground reservoir. Only when the elevation of the mean piezometric head is equal to that in natural conditions, inflow is be equal to outflow.
The fact that inflow is larger than outflow also has implications in the efficiency and the environmental impacts. After one year of simulation, inflow exceeds outflow by 110,000 and 180,000 m3 for the E-CI and F-CI scenarios, respectively. These volumes are negligible compared to the total
volume of pumped and discharged water during a year. However, they may be relevant for the efficiency and the environment. If inflow exceeds outflow, and therefore, if more water is pumped than discharged, less water compared to the pumped water volume can be discharged to produce electricity affecting the global efficiency of the UPSH plant. In addition, a quantity of pumped water should be released into surface water bodies. Considering the poor quality of mine water, discharges in surface water bodies will impact the quality of nearby stream water resources. Specifically, the surplus pumped water could be released into the small river “La Sûre” that flows very close to the mine of Martelange. The quality of mine water at Martelange is unknown at this stage, but problems when releasing into surface water bodies the surplus pumped water may arise due to the presence of Marcasite. Marcasite is an iron sulfide (FeS2) that is commonly involved in acid mine drainage
related issues [51] since it is dissolved by oxic water. Specifically, the dissolution of marcasite reduces the pH of water (i.e., increases the acidity). In the context of an UPSH, water is continuously aerated because of pumping and discharge processes, and thus, the content of dissolved oxygen in mine water increases [31]. As a result, Marcasite may be dissolved, thus deteriorating the quality of water in and around the underground reservoir. Thus, the release of surplus pumped water into surface water bodies would affect their quality in a similar way that observed in acid drainage contexts [52,53]. Optionally, the discharged water could be treated before discharge, however, the treatment would imply an additional cost, and therefore, it would also influence the global efficiency of the UPSH plant. Note that as previously stated, after an initial period, the ratio between inflow and outflow is equal in both scenarios. Thus, except during this initial period, the initial conditions do not affect substantially the issues related to the excess of pumped water.
As explained previously, inflow is higher than outflow because the natural elevation of the piezometric head is close to the top of the underground reservoir. If the natural piezometric head was lower, the difference between outflow and inflow would decrease and so would their associated consequences on the efficiency and the environment. This behavior can be better understood by considering the similarities of the simulated system with a long-duration pumping test, obviously with a coarse resolution and neglecting the oscillations. In this case, given that the piezometric head decreases around the pumping well, groundwater continuously flows towards it. Concerning the initial conditions, they have an impact on the total volume of exchanged water, and therefore, on the efficiency and the environment. However, their relevance is relative since main differences concerning the total water exchanges only occur at the beginning of the UPSH operation and afterwards the total water exchanges evolve in the same way independently of the considered scenario, as shown in Figure 10.
Figure 11 displays the evolution of water exchange rate for scenarios F-CI (blue) and E-CI (red). Inflow rates are positive while outflow rates are negative. Maximum inflow rate is 0.37 and 0.36 m3/s
for F-CI and E-CI scenarios, respectively, while maximum outflow rate is −0.4 and −0.35 m3/s for F-CI
and E-CI scenarios, respectively. The mean inflow rate (0.07 and 0.06 m3/s for F-CI and E-CI scenarios,
respectively) is higher than the mean outflow rate (0.06 and 0.05 m3/s for F-CI and E-CI scenarios,
respectively), which agrees with the evolution of the total exchanged water (Figure 10). Outflow rates are higher than inflow rates at the beginning of the E-CI scenario, when the piezometric head in the surrounding medium is depressed and water can only flow out, and between the days 180 and 270, which is the period when the operation scenario is derived from the summer electricity price curve. During the summer period, high outflow is reflected in the increase of the magnitude of the piezometric oscillations (Figures 6 and 7) as noted previously.
Figure 11. Water exchange rate (m3/s) evolution for the F-CI (blue) and E-CI (red) scenarios. Inflow
into the underground reservoir is positive while outflow is negative.
The most interesting aspect of water exchange rates is that inflow and outflow rates are systematically lower in E-CI than in F-CI. This fact is not reflected in the total volume of exchanged water (Figure 10) because the difference between inflow and outflow rates is the same in both scenarios. The reason for which inflow and outflow rates are lower in E-CI than on F-CI may be related to the evolution of the saturated thickness around the underground reservoir.
4. Conclusions
This paper investigates the groundwater exchanges induced by UPSH and their associated consequences by considering an abandoned underground slate mine located in Belgium that has been
considered as a potential site to install a UPSH plant. Water exchanges and their consequences are assessed during a long period of time (one year), under the influence of pumping-discharge frequencies based on actual electricity price curves and considering two realistic initial conditions. Specifically, this paper evaluates the evolution of the total exchanged water, the inflow and outflow rates from the underground reservoir, and how the water exchanges modify the piezometric head in the surrounding medium and the hydraulic head inside the underground reservoir. Even if this paper is more realistic than previous ones in terms of geometry, simulation time, pumping–discharge frequencies and initial conditions, the hydrogeological complexity is still simplified as the hydrogeological information is not yet available. However, this investigation can be considered as a very useful study during the tender phase and to direct future investigational needs. If the mine of Martelange is finally selected for constructing an UPSH plant, boreholes and geophysical studies developed during the project phase will provide more information to improve the numerical model and its predictions. Note that despite the lack of knowledge regarding the hydrogeological conditions, realistic hydraulic parameters are chosen based on the geological materials and bibliographic information.
The impacts on the piezometric head consist of oscillations due to the pumping and discharge periods and a general lowering of the piezometric head. Piezometric head oscillations are especially relevant close to the underground reservoir, but they decrease with increasing distance from the underground reservoir. The distance at which oscillations are not observed is related to the adopted value of hydraulic conductivity that in the case of Martelange is relatively low. The average piezometric head is affected by the specific relation between the natural piezometric head and the top of the underground reservoir. If the natural piezometric head was lower and if discharge was not constrained when the hydraulic head inside the underground reservoir was reaching the same elevation of the natural piezometric head, the general drop of the piezometric head would be lower or may even be eliminated.
The influence of water exchanges on the hydraulic head in the underground reservoir is relatively small but enough to limit the discharge of some of the pumped water. The water that cannot be discharged should be released into surface water streams, which could affect the quality of nearby surface water resources. In addition, efficiency is impacted since some of the energy used for pumping cannot be recovered discharging water into the underground reservoir. This effect would be mitigated if the natural piezometric head were much deeper than the top of the underground reservoir because water exchanges would be equilibrated.
The initial conditions influence the water exchanges mostly during early stages. If the underground reservoir is initially empty, inflow and outflow rates are lower than when the underground reservoir is initially filled. However, the total volume of exchanged water evolves in the same way independently of the initial conditions. Differences between inflow and outflow rates when the initial conditions are varied are a consequence of the saturated thickness of the surrounding medium, and therefore of the transmissivity. The transmissivity is lower when an initial dewatering is considered since the piezometric head around the underground reservoir, and therefore the saturated thickness, is lower than when the underground reservoir is initially filled. This effect disappears when the pseudo-steady state is reached since the piezometric head is the same independently of the initial conditions. The initial conditions also influence the evolution of the piezometric head and the hydraulic head inside the underground reservoir, but as mentioned previously, their influence decreases with time.
The two most important factors controlling the water exchanges seem to be the values of the hydraulic parameters and the relative position of the natural piezometric head with respect to the top of the underground reservoir. The considered value of hydraulic conductivity is here relatively low as it is representative of the old slate mine of Martelange. More investigation is required to establish the influence on the water exchanges of possible hydraulic conductivity spatial variability and other hydraulic parameters. Pujades et al., [29] investigated the influence of hydraulic parameters in the system behavior; however, it was done considering a very simple numerical model. Therefore, a sensitivity analysis in a realistic numerical model, as the one developed for this work, would be
advisable in future investigations. Similarly, more investigation is needed to ascertain how water exchanges evolve depending on the elevation of the natural piezometric head. This information will be meaningful for the selection of potential abandoned underground mines for construction of future UPSH plants.
It is important to highlight that the numerical model herein considers an equivalent homogeneous porous medium that is obviously a simplification of the actual fractured medium. More complexity has not been included because in this phase of the project, more information is not available. For this reason, it is necessary to consider that the model has a certain degree of uncertainty. However, given that the characteristics chosen for the homogeneous medium are in agreement with the existing data, the model allows estimating the main trends of the system behavior. In fact, in case of heterogeneities or fracturing, it is expected that the system behavior does not change considerably since the volumes of exchanged water will be similar to the homogeneous case. However, only local changes may be expected since most groundwater exchange will occur through the most permeable zones, thus, through preferential channels, and the piezometric head may evolve differently around these areas.
Author Contributions: Conceptualization, E.P. and A.D.; methodology, E.P.; software, P.O.; investigation, E.P., P.O., P.A., V.K., S.E., A.D.; writing—original draft preparation, E.P., P.O., P.A., V.K., S.E., A.D.; writing—review and editing, E.P., P.O., P.A., V.K., S.E., A.D.; supervision, A.D.; funding acquisition, E.P., S.E., A.D. All authors have read and agreed to the published version of the manuscript.
Funding: This research was funded by the Public Service of Wallonia - Department of Energy and Sustainable Building through the Smartwater project. E.P. was also funded by the University of Liège and the EU through the Marie Curie BeIPD-COFUND postdoctoral fellowship program (2014–2016 “Fellows from FP7-MSCA-COFUND, 600405”).
Conflicts of Interest: The authors declare no conflicts of interest. The funders had no role in the design of the study; in the collection, analyses, or interpretation of data; in the writing of the manuscript, or in the decision to publish the results.
References
1. Rogelj, J.; Den Elzen, M.; Höhne, N.; Fransen, T.; Fekete, H.; Winkler, H.; Schaeffer, R.; Sha, F.; Riahi, K.;
Meinshausen, M. Paris Agreement climate proposals need a boost to keep warming well below 2 °C. Nature 2016, 534, 631–639, doi:10.1038/nature18307.
2. Rugolo, J.; Aziz, M.J. Electricity storage for intermittent renewable sources. Energy Environ. Sci. 2012, 5,
7151–7160, doi:10.1039/C2EE02542F.
3. Gebretsadik, Y.; Fant, C.; Strzepek, K.; Arndt, C. Optimized reservoir operation model of regional wind
and hydro power integration case study: Zambezi basin and South Africa. Appl. Energy 2016, 161, 574–582, doi:10.1016/j.apenergy.2015.09.077.
4. Delfanti, M.; Falabretti, D.; Merlo, M. Energy storage for PV power plant dispatching. Renew. Energy 2015,
80, 61–72, doi:10.1016/j.renene.2015.01.047.
5. Mason, I.G. Comparative impacts of wind and photovoltaic generation on energy storage for small
islanded electricity systems. Renew. Energy 2015, 80, 793–805, doi:10.1016/j.renene.2015.02.040.
6. Zhang, N.; Lu, X.; McElroy, M.B.; Nielsen, C.P.; Chen, X.; Deng, Y.; Kang, C. Reducing curtailment of wind
electricity in China by employing electric boilers for heat and pumped hydro for energy storage. Appl. Energy 2016, 184, 987–994, doi:10.1016/j.apenergy.2015.10.147.
7. Wong, I.H. An underground pumped storage scheme in the Bukit Timah Granite of Singapore. Tunn.
Undergr. Space Technol. 1996, 11, 485–489, doi:10.1016/S0886-7798(96)00035-1.
8. Kucukali, S. Finding the most suitable existing hydropower reservoirs for the development of
pumped-storage schemes: An integrated approach. Renew. Sustain. Energy Rev. 2014, 37, 502–508, doi:10.1016/j.rser.2014.05.052.
9. Barnes, F.S.; Levine, J.G. Large Energy Storage Systems Handbook. Available online:
https://www.crcpress.com/Large-Energy-Storage-Systems-Handbook/Barnes-Levine/p/book/9781138071964 (accessed on 18 January 2020).
10. Tam, S.W.; Blomquist, C.A.; Kartsounes, G.T. Underground Pumped Hydro Storage—An Overview. Energy Sources 1979, 4, 329–351, doi:10.1080/00908317908908068.
11. Fosnacht, D.R. Pumped Hydro Energy Storage (PHES) Using Abandoned Mine Pits on the Mesabi Iron Range of Minnesota—Final Report; University of Minnesota Duluth: Duluth, MN, USA, 2011.
12. Severson, M.J. Preliminary Evaluation of Establishing an Underground Taconite Mine, to be Used Later as a Lower Reservoir in a Pumped Hydro Energy Storage Facility, on the Mesabi Iron Range, Minnesota; University of Minnesota Duluth: Duluth, MN, USA, 2011.
13. Winde, F.; Stoch, E.J. Threats and opportunities for post-closure development in dolomitic gold mining areas of the West Rand and Far West Rand (South Africa)—A hydraulic view part 1: Mining legacy and future threats. Water SA 2010, 36, 69–74.
14. Winde, F.; Stoch, E.J. Threats and opportunities for post-closure development in dolomitic gold-mining areas of the West Rand and Far West Rand (South Africa)—A hydraulic view Part 2: Opportunities. Water SA 2010, 36, doi:10.4314/wsa.v36i1.50909.
15. Khan, S.Y.; Davidson, I.E. Underground Pumped Hydroelectric Energy Storage in South Africa using Aquifers and Existing Infrastructure. In NEIS Conference 2016; Schulz, D., Ed.; Springer Fachmedien: Wiesbaden, Germany, 2017; pp. 119–122.
16. Winde, F.; Kaiser, F.; Erasmus, E. Exploring the use of deep level gold mines in South Africa for underground pumped hydroelectric energy storage schemes. Renew. Sustain. Energy Rev. 2017, 78, 668–682, doi:10.1016/j.rser.2017.04.116.
17. Min, A.P.N. Ondergrondse Pomp Accumulatie Centrale: Effectiviteitsverbetering d.m.v. Verschillende
Pomp-Turbinevermogens. 1984. Available online:
https://repository.tudelft.nl/islandora/object/uuid:a87a1047-fbed-4f39-9c86-7e829980a216 (accessed on 23 March 2020).
18. Braat, K.B.; Van Lohuizen, H.P.S.; De Haan, J.F. Underground pumped hydro-storage project for the Netherlands. Tunn. Tunn. 1985, 17, 19–22.
19. Beck, H.-P.; Schmidt, M. Windenergiespeicherung Durch Nachnutzung Stillgelegter Bergwerke; University Library Clausthal: Clausthal-Zellerfeld, Germany, 2011; ISBN 978-3-942216-54-8.
20. Luick, H.; Niemann, A.; Perau, E.; Schreiber, U. Coalmines as Underground Pumped Storage Power Plants (UPP)—A Contribution to a Sustainable Energy Supply? Geophys. Res. Abstracts 2012, 14, 4205.
21. Zillmann, A.; Perau, E. A conceptual analysis for an underground pumped storage plant in rock mass of the Ruhr region. In Geotechnical Engineering for Infrastructure and Development; Conference Proceedings; ICE Publishing, 2015; Volume 1–7, pp. 3789–3794. ISBN 978-0-7277-6067-8.
22. Poulain, A.; goderniaux, P.; de dreuzy, J.-R. Study of groundwater-quarry interactions in the context of energy storage systems. Geophys. Res. Abstracts 2016, 18, EPSC2016-9055.
23. Bodeux, S.; Pujades, E.; Orban, P.; Brouyère, S.; Dassargues, A. Interactions between groundwater and the cavity of an old slate mine used as lower reservoir of an UPSH (Underground Pumped Storage Hydroelectricity): A modelling approach. Eng. Geol. 2017, 217, 71–80, doi:10.1016/j.enggeo.2016.12.007. 24. Menéndez, J.; Loredo, J.; Galdo, M.; Fernández-Oro, J.M. Energy storage in underground coal mines in NW
Spain: Assessment of an underground lower water reservoir and preliminary energy balance. Renew. Energy 2019, 134, 1381–1391, doi:10.1016/j.renene.2018.09.042.
25. Menéndez, J.; Fernández-Oro, J.M.; Galdo, M.; Loredo, J. Efficiency analysis of underground pumped storage hydropower plants. J. Energy Storage 2020, 28, 101234, doi:10.1016/j.est.2020.101234.
26. Menéndez, J.; Fernández-Oro, J.M.; Galdo, M.; Loredo, J. Pumped-storage hydropower plants with underground reservoir: Influence of air pressure on the efficiency of the Francis turbine and energy production. Renew. Energy 2019, 143, 1427–1438, doi:10.1016/j.renene.2019.05.099.
27. Pummer, E.; Schüttrumpf, H. Reflection Phenomena in Underground Pumped Storage Reservoirs. Water 2018, 10, 504, doi:10.3390/w10040504.
28. Menéndez, J.; Schmidt, F.; Konietzky, H.; Fernández-Oro, J.M.; Galdo, M.; Loredo, J.; Díaz-Aguado, M.B. Stability analysis of the underground infrastructure for pumped storage hydropower plants in closed coal mines. Tunn. Undergr. Space Technol. 2019, 94, 103117, doi:10.1016/j.tust.2019.103117.
29. Pujades, E.; Willems, T.; Bodeux, S.; Orban, P.; Dassargues, A. Underground pumped storage hydroelectricity using abandoned works (deep mines or open pits) and the impact on groundwater flow. Hydrogeol. J. 2016, 24, 1531–1546, doi:10.1007/s10040-016-1413-z.