UNIVERSITÉ DU QUÉBEC
INRS- ÉNERGIE, MATÉRIAUX ET TÉLÉCOMMUNICATIONS
Spectral Domain Interferometry for
Terahertz Detection: Concept and
Application
parAkram Yousif Ibrahim
Thèse présentée pour l’obtention
du grade de Philosophiæ Doctor (Ph.D) en Sciences de l’Énergie et des Matériaux
Jury d’évaluation
Président du jury Dr. Luca Razzari, et examinateur interne : (INRS-EMT),
Varennes, QC, Canada
Examinateur externes : Dr. Maksim Skorobogatiy, École Polytechnique, Montréal, QC, Canada.
Dr. Jean-Michel Ménard. University of Ottawa, Ottawa, ON, Canada.
Directeur de recherche : Dr. Tsuneyuki Ozaki, (INRS-EMT),
ii
Dedication
To:
The souls of my parents:
Alawia and Yousif.
&
To:
iii
Abstract
The current golden standard for measuring terahertz (THz) temporal waveform is the electro-optic sampling (EOS) technique. However, EOS technique when exploited for measuring intense THz electric field has a limited dynamic range (DR) due to a phenomenon called over-rotation. This limited DR makes it very difficult to measure intense THz signals and weak signals at the same time. Routinely, THz filters (such as silicon) are used to ensure that the measurements are within the DR of the EOS technique and then calibrated against reference data. However, this not only distorts the THz waveform but when those filters are irradiated with intense THz radiation, recent researches have shown that there could be substantial changes in their transmission characteristics due to nonlinear THz effects. Therefore, a proper interpretation of the data obtained through the EOS technique in intense THz experiments could be complicated.
In the framework of this thesis, we describe a novel technique for measuring THz waveform that does not suffer from over-rotation limitation, possessing a tremendous DR of ~7106, while at the same time having high signal-to-noise ratio (SNR) that are comparable to that of the commonly used EOS techniques. In this new technique, we make use of spectral-domain interferometry (SDI) technique to develop different detection schemes, such as Michelson interferometer type based SDI (later we distinguish it as the standard SDI), Mach-Zehnder interferometer based SDI (MZI-SDI), and fiber-based SDI (later we distinguish it as cross-polarized SDI (CP-SDI)) schemes to measure intense THz electric fields.
We perform a comparison between the three SDI schemes for THz electric field measurement schemes. Based on our experimental findings, the temporal waveform of the THz electric field measured with the standard SDI technique exhibits reasonable DR and SNR. However, the temporal scanning window is limited due to the finite fixed thickness of the glass plate that is used to create the two interfering signals. This limitation in the temporal scanning window has been avoided in both MZI-SDI and CP-SDI for THz electric field measurement schemes. We find that the SNR of the THz electric field measurement obtained with MZI-SDI scheme is inferior to that obtained with the CP-SDI scheme. We attributed this inferior SNR in the former scheme to the fact that there are more optical components in the optical probe beam signal, compared to the latter scheme. Each of these optical components is susceptible to
iv
vibrational noise in the setup, and thus contributes to the overall noise buildup in the measurement. On the other hand, in the case of the CP-SDI scheme, the situation is different, since both interfering signals are propagating along one common path (along the optical fiber). In this case, the noises associated with vibrations in the optical components, which in turn change the optical path difference (OPD) between two interfering signals, are mitigated since any change in OPD is common to both signals.
Owing to the excellent performance of the CP-SDI scheme, with an SNR ~48.97 dB and DR~7×10⁶, we find this version the best among all SDI-THz detection technique versions and thus suitable for carrying out THz spectroscopic measurements.
Furthermore, as a second objective of this thesis, the new CP-SDI THz detection technique was validated successfully in measuring the THz response -in transmission geometry- of high-permittivity materials, which are encountering challenges in the THz frequency range. In this work, we chose Barium Strontium Titanate (BST), which notoriously has significant losses in the THz frequency region, thus affecting the SNR of the THz measurement. Furthermore, we hold a comparison between the dielectric response results obtained via CP-SDI THz detection technique and those obtained via conventional EOS THz detection technique for the same BST sample. We show that from the comparison, the CP-SDI technique enables obtaining more accurate results due to its ultra-high DR and good SNR.
v
Table of Contents
List of Figures ... ix
List of Tables ... xii
Chapter 1: Introduction and motivation ...
11.1 Terahertz gap: Historical background ... 1
1.2 Motivation of this thesis work ... 2
1.2.1 The imperative need for intense THz sources and detectors ... 2
1.3 The objectives and scope of this thesis work ... 4
Chapter 1 references ... 5
Chapter 2: Theoretical background
... 82.1 Conventional femtosecond laser methods for generating few-cycle THz pulse ... 8
2.1.1 Photoconductive switches (antennas) ... 8
2.1.2 Difference frequency mixing or optical rectification in nonlinear media ... 11
2.1.3 THz waves generation in plasma... 16
2.2 Intense THz pulse detection ... 18
2.2.1 Conventional techniques for coherent THz detection ... 18
2.2.1.1 PCA for THz electric field measurement ... 18
2.2.1.2 Electro-optic sampling technique ... 19
2.2.1.3 THz-air-biased coherent detection (THz-ABCD) ... 22
2.3 Conventional THz detection techniques in measuring intense THz electric field: challenges and limitations ... 24
2.4 Advanced technique for coherent THz detection based on spectral-domain interferometry (SDI) technique ... 25
2.4.1 Concept of spectral-domain interferometry (SDI) technique ... 26
2.5.2 Pursuing SDI technique for THz electric field measurement ... 28
2.5 Applications of THz radiation ... 29
vi
2.5.1.1 Terahertz time-domain spectroscopy (THz-TDS) ... 29
2.5.1.2 Terahertz frequency -domain spectroscopy (THz-FDS) ... 33
2.5.2 Applications of intense field THz pulses ... 34
2.5.2.1 Nonlinear THz spectroscopy of condensed matter ... 35
2.5.2.1.1 Optical-pump / intense THz-probe and THz-pump/THz-probe experiments ... 35
2.5.2.1.2 Ponderomotive effect ... 37
Chapter 2 references ... 37
Chapter 3: Innovative coherent THz detection techniques using SDI part
I: Michelson-type and Mach-Zehnder interferometer based SDI
techniques in THz electric field measurement
... 463.1 SDI in THz electric field measurement ... 46
3.2 Michelson-type interferometer based SDI in THz electric field measurement... 47
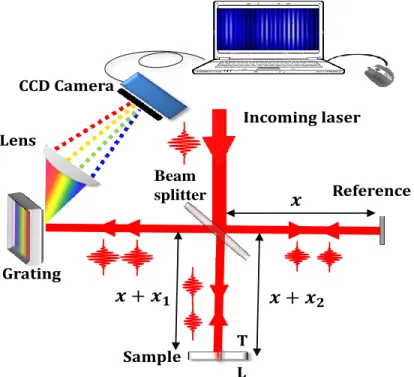
3.2.1 Experimental realization of standard SDI technique for THz electric field measurement ... 47
3.2.2 Phase change data acquisition by SDI technique ... 52
3.2.3 Experimental results and discussion ... 54
3.2.3.1 THz electric field measurement obtained with the standard SDI technique 54 3.2.4 Challenges and limitation of the standard SDI technique for THz electric field measurement ... 56
3.2.4.1 Signal-to-noise ratio (SNR) ... 57
3.2.4.2 Limited temporal scan length ... 58
3.3 The idea of self-referencing in the standard SDI technique for THz electric field measurement ... 58
3.4 MZI based SDI technique for THz electric field measurement ... 61
3.4.1 Experimental realization of MZI-based-SDI technique for THz electric field measurement ... 62
3.4.2 Experimental results and discussion ... 64
3.4.2.1 THz electric field measurement obtained with MZI-based-SDI technique .... 64
vii
3.5.1 Temporal scan range ... 65
3.5.2 SNR of MZI-based-SDI technique in THz electric field measurement ... 66
3.5.3 The optimal OPD between the two OPB interfering signals ... 67
3.5.4 Dynamic range (DR) of MZI-based SDI technique in THz electric field measurement 68 3.5.5 MZI-based-SDI technique at different THz peak electric field ... 69
Chapter 3 references ... 70
Chapter 4: Innovative coherent THz detection techniques using SDI part
II: Cross-polarized (CP) based SDI in terahertz electric field
measurement
... 724.1 The idea of the fiber interferometer: Concept of the CP-SDI scheme ... 72
4.2 Experimental realization of CP-SDI technique for THz electric field measurement ... 74
4.3 THz electric field measurements obtained with CP-SDI technique ... 76
4.4 Characterization of the CP-SDI THz detection technique ... 78
4.4.1 Fiber length choice ... 78
4.4.2 Signal-to-noise ratio (SNR) ... 81
4.4.3 Over-rotation limitation... 81
4.4.4 Dynamic range (DR) of CP-SDI technique ... 82
4.4.5 CP-SDI technique at different THz electric field ... 83
4.4.6 Measurement of polarization dependence using CP-SDI technique ... 85
4.5 Attempting to improve the SNR of the CP-SDI technique for THz electric field measurement .... 87
4.5.1 New referencing method in CP-SDI technique for THz electric field measurement . 88 4.5.2 Compact CP-SDI module scheme ... 92
4.6 Comparison between standard SDI, MZI based SDI and CP-SDI techniques in THz electric field measurement ... 95
viii
Chapter 5: Application of CP-SDI detection technique in THz
spectroscopy of high-permittivity materials
... 995.1 Introduction ... 99
5.2 Barium Strontium Titanate (BST) - A case study ... 101
5.3 THz spectroscopy applied to BST ceramic ... 104
5.3.1 Experimental realization ... 104
5.4 THz waveforms acquisition for BST dielectric response extraction using conventional EOS THz detection technique ... 106
5.4.1 Extraction of dielectric constants of stoichiometric BST sample using data obtained via conventional EOS technique ... 109
5.5 THz Z-scan of BST ceramic ... 111
5.6 THz waveforms acquisition for BST dielectric response extraction using CP-SDI THz detection technique ... 114
5.6.1 Extraction of dielectric constants of stoichiometric BST sample using data obtained via CP-SDI THz detection technique ... 117
Chapter 5 references ... 120
Chapter 6: Conclusions and perspectives
... 124Résumé en français
... 128ix
List of Figures
Figure 1.1: The spectrum of electromagnetic radiation with THz frequencies… ... 1
Figure 2.1: Schematic illustration of THz generation via photoconductive antenna... 9
Figure 2.2: Interdigitated electrodes in the LAPCA for THz generation scheme ... 10
Figure 2.3: THz generation with collinear optical pump via OR ... 12
Figure 2.4: THz generation with non-collinear in LiNbO3 crystal via OR configuration ... 14
Figure 2.5: Schematic of experimental setup for THz generation by titled-pulse-front technique in LiNbO3 ... 15
Figure 2.6: Schematic of the experimental setup for THz generation in plasma… ... 16
Figure 2.7: Schematic illustration of THz pulse detection via PCA scheme ... 19
Figure 2.8: Schematic illustration of THz detection using EOS technique ... 20
Figure 2.9: Schematic illustration of experimental setup for THz- ABCD technique… ... 23
Figure 2.10: Schematic for the concept of SDI ... 27
Figure 2.11: Schematic for electric and magnetic field vectors after reflection and transmission of an incident electromagnetic wave incident on a semi-infinite non-conducting surface ... 30
Figure 2.12: Schematic illustration for the experimental set up commonly used in THz-TDS… ... 31
Figure 2.13: Schematic of OPITP spectroscopy with a non-collinear configuration ... 36
Figure 3.1: Schematic of the experimental setup of Michelson interferometer-type based SDI technique for THz electric field measurement ... 48
Figure 3.2: Schematic of the home-made spectrometer used in the SDI project… ... 48
Figure 3.3: Schematic of interference in the SDI (a) and the corresponding FFT signal (b) ... 51
Figure 3.4: Interference OPB pulses in SDI (a), the intensity distribution (b), and the corresponding FFT peak (c) ... 52
Figure 3.5: Measured signal phase in wave-number space and the corresponding unwrapped phase signal using SDI technique ... 54
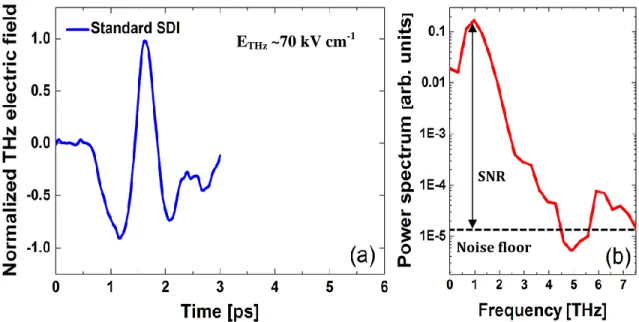
Figure 3.6: THz electric field obtained with the standard SDI technique (a) and the corresponding Fourier transform power spectrum (b) ... 55
Figure 3.7: THz electric field obtained with the conventional EOS technique (a) and the corresponding Fourier transform power spectrum (b) ... 55
Figure 3.8: The spatial profile of the THz beam focal spot on the ZnTe detection (a) and the image of the focused THz beam pulse measured via pyroelectric IR camera (b) ... 56
Figure 3.9: Mechanical vibrations on the glass plate used in standard SDI affecting phase change measurement via OPB ... 57
Figure 3.10: Schematic of SR-SDI idea ... 59
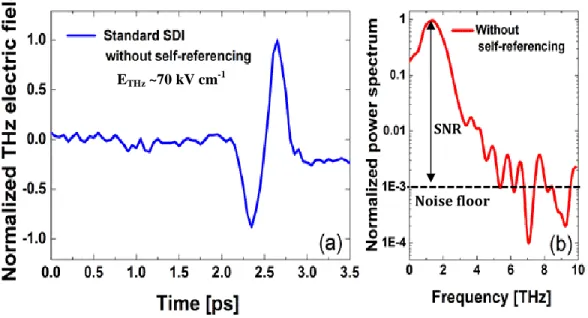
Figure 3.11: THz electric field measurement obtained with the standard SDI technique (a) without using the self-referencing method and (b) the corresponding Fourier power spectrum ... 60
Figure 3.12: THz electric field measurement obtained with the standard SDI technique (a) with using the self-referencing method and (b) the corresponding Fourier power spectrum ... 60
Figure 3.13: Schematic of the experimental setup of Mach-Zehnder interferometer (MZI) based spectral domain interferometry technique for THz electric field measurement ... 62
x
Figure 3.14: THz electric field trace obtained with the conventional EOS technique (a). Fourier
power spectrum of the THz temporal trace obtained by conventional EOS technique (b) … ... 64
Figure 3.15: THz electric field trace obtained with the MZI based SDI technique (a). Fourier power
spectrum of the THz temporal trace obtained by MZI based SDI technique (b). ... 65
Figure 3.16: THz electric field measurement obtained with the MZI based SDI technique at
different OPD between the interfering optical probe beam pulses ... 67
Figure 3.17: Signal-to-noise ratio (SNR) of the THz electric field measurements dependence on
optical path difference (OPD) between the two signals at MZI two arms … ... 68
Figure 3.18: THz signal amplitude measurements dependence on THz peak electric field using
conventional EOS and MZI based SDI techniques. The red line is the linear fit ... 69
Figure 4.1: PM fiber introduces optical path difference between the two polarization
components(a) and the evolution process of introducing a fixed OPD between the two polarization components(b) ... 74
Figure 4.2: Experimental set up of the CP-SDI technique for THz detection ... 75 Figure 4.3: THz electric field trace obtained with conventional EOS technique (a), and the
corresponding Fourier power spectrum (b) … ... 77
Figure 4.4: THz electric field trace obtained with CP-SDI technique (a), and the corresponding
Fourier power spectrum of the THz trace (b)… ... 77
Figure 4.5: Dependence of noise and sensitivity of SDI technique on optical path difference
between the interfering signals. (a) Normalized sensitivity drop and (b) normalized RIN are plotted against optical path difference (OPD)… ... 78
Figure 4.6: THz electric field measurement obtained with the CP-SDI technique at different (fiber
length) OPD between the interfering optical probe beam pulses… ... 80
Figure 4.7: Dependence of the signal-to-noise ratio of the THz electric field measurements on the
optical path difference between the two signals at the exit end of the optical fiber in the CP-SDI technique for THz electric field measurement… ... 80
Figure 4.8: Short temporal scans of different THz electric fields (ETHz) obtained with (a) the
conventional EOS and (b) the CP SDI techniques at various ETHz ... 82
Figure 4.9: THz electric field measurement obtained with the CP-SDI technique using 80 cm length
PM fiber at different THz peak electric field ETHz ... 83
Figure 4.10: Comparison between SNR of the conventional EOS and CP-SDI techniques for THz
electric field measurement.… ... 84
Figure 4.11: Schematic representation of ZnTe detection crystal with angles of the THz beam and
optical probe beam (OPB) polarization orientation with respect to the crystal Z axis ... .86
Figure 4.12: ZnTe detection crystal’s azimuthal angle dependence on the detected THz electric field
amplitude.… ... 87
Figure 4.13: Partial schematic of new referencing method in CP-SDI technique ... 89 Figure 4.14: THz electric field trace obtained with conventional EOS technique (a) and the
corresponding Fourier power spectrum (b)… ... 90
Figure 4.15: THz electric field trace obtained with CP-SDI technique without referencing (a), and
with referencing method (b), the noise amplitude subtracted using the referencing method (c), and the corresponding Fourier power spectra of the THz trace obtained with and without the new referencing method (d) ... 91
xi
Figure 4.16: Schematic illustration of the experimental setup of the CP-SDI compact module for
THz electric field measurement ... 93
Figure 4.17: THz electric field trace obtained with CP-SDI compact module (a) and the
corresponding Fourier power spectrum of the THz trace (b)… ... 94
Figure 5.1: The elementary cell for the ferroelectric perovskite compounds structure (ABO3]… .. 100
Figure 5.2: The elementary cell along with the eigenvector of the soft mode for the ferroelectric
perovskite compound (Ba, Sr)TiO3… ... 102
Figure 5.3: The schematic of THz-TDS setup used to characterize the stoichiometric BST sample in
transmission geometry… ...105
Figure 5.4: Measurement of the THz temporal waveform (a) reference (air) and (b) transmitted
through stoichiometric BST sample A/B=1.00, both measured via conventional EOS. The corresponding power spectra are shown in (c) and (d) respectively… ...107
Figure 5.5: Extracted THz (a) amplitude and (b) phase data obtained from the Fourier transform of
the waveforms with conventional EOS THz detection technique… ... 108
Figure 5.6: Extracted THz (a) magnitude of transmission coefficient and (b) phase difference
obtained from Fourier transform of the waveforms with conventional EOS THz detection technique… ...109
Figure 5.7: The extracted real (n) and imaginary (k) parts of the complex index of refraction for
BST sample using THz-TDS in transmission geometry with conventional EOS THz detection technique… ...110
Figure 5.8: Conventional EOS measured THz spectra of (a) real part of permittivity ε’, and (b)
imaginary part of permittivity ε” at an average thickness of 31.2 ±4 μm of stoichiometric BST sample… ...111
Figure 5.9: Measurement of the transmitted ETHz through stoichiometric BST sample for different
positions of the Z-scan at room temperature ...112
Figure 5.10: Measurement of the temporal shift and the transmitted THz peak amplitude through
BST for different positions of the Z-scan … ...113
Figure 5.11: Measurement of the THz waveform (a) reference and (b) transmitted through
stoichiometric BST sample, both measured via CP-SDI THz detection technique at high ETHz ≈439
kVcm-1 at room temperature. The corresponding power spectra are shown in (c) and (d) … ...114
Figure 5.12: Measurement of THz (a) amplitude and (b) phase data obtained from the Fourier
transform of the waveforms using CP-SDI THz detection technique… ...115
Figure 5.13: Measurement of THz (a) Transmission coefficient and (b) phase difference obtained
from Fourier transform of the waveforms using CP-SDI THz detection technique. ...116
Figure 5.14: Extracted real (n) and imaginary (k) parts of the complex index of refraction for a 30.3
±2 μm -thick stoichiometric BST sample using THz-TDS in transmission geometry with CP-SDI technique in detection ...116
Figure 5.15: Different measured values obtained by CP-SDI THz detection technique for (a) ε’ and
(b) ε” spectra at different thicknesses of the stoichiometric BST sample … ...117
Figure 5.16: CP-SDI technique measured spectra of (a) real part of permittivity ε’, and (b)
imaginary part of permittivity ε” at an average thickness of 30.3 ±2 μm of BST sample ...118
xii
.
List of Tables
Table 2.1: Properties of common materials used for THz generation via OR… ... 13 Table 2.2: Comparison between common THz generation techniques ... 17 Table 4.1: Parameters of the PM fiber used in the CP-SDI technique ... 76 Table 4.2: Comparison between SNR of THz electric field measurements obtained with
conventional EOS technique and different SDI schemes ... 94
xiii
Acknowledgement
My Ph.D. work at INRS would not have been successful without interactions with many people at INRS and throughout the scientific community. I have had the pleasure of knowing and working with them, all of whom I am indebted to.
I am extremely grateful to my thesis advisor, Prof. Tsuneyuki Ozaki for his endless support, guidance, constant enthusiasm, and patience those have an impact in driving the research described in this thesis work. His enormous knowledge always inspired me. I have learned from him many problem-solving strategies in both scientific and personal levels, those will be an asset to me wherever I go in my future. This work would not have taken its present shape without him.
I am indebted to Dr. I. Al Naib who has helped me a lot in the start of my Ph.D. program by elucidating lots of THz concepts. I am very thankful to Prof. D. Cooke of McGill University and his group for allowing us to work in his THz laboratory and discussing our new THz detection technique. Moreover, I extended my thanks to Prof. F. Blanchard of École de technologie supérieure (ÉTS) for his technical advice whenever needed. I am thankful to Prof. T. Teranishi, of Okayama University, Japan and his group for BST samples fabrication.
My previous and current colleagues in Prof. Ozaki’s group have been an invaluable resource: G. Sharma, K. Singh, X. Ropagnol, M. K.-Turmel, H. A. Hafez, and D. Férachou.
I would like to thank the fantastic technical staff especially Philippe Lassondé and Antoine Laramée for their genius efforts in solving many technical problems in ALLS laboratory. Many thanks to Mr. C. Morissette from INRS machine shop for helping in fabricating the needed experimental-setup parts. Also, many thanks to the administrative staff especially Ms. H. Sabourin.
Finally, I would like to express my gratitude to members of the Sudanese community in London Ontario for their moral support especially brothers Hatim Bakri and Abdulkhalig Abdoon.
1
Chapter 1
Introduction and motivation
1.1 Terahertz gap: Historical background
Terahertz (THz = 1012 Hz) radiation is a part of the electromagnetic (EM) spectrum, typically defined as the radiation with frequencies from 0.1 to 10 THz, which corresponds to wavenumbers between 3 and 300 cm-1, photon energies between 0.4 and 40 meV, and wavelengths between 3 mm and 30 μm. This part of the EM spectrum has not been well explored due to the lack of practical efficient sources and sensitive detectors, consequently giving that frequency band the name the “THz gap”. In the past, technological applications in the THz region were hindered due to the fact that this frequency range is situated in between electronics and optics, i.e. it is in the upper limit to what is accessible by electronics and in the lower limit to what is accessible by optics. Fig. 1.1 depicts the THz band within in the EM spectrum [1-3].
Figure 1.1| The spectrum of electromagnetic radiation with THz frequencies situated in between microwave and infrared frequencies [3].
The interaction of electromagnetic radiation with matter has been the center of interest for scientists and researchers. One of the milestones in studying novel phenomenon in physics and chemistry is the availability of light sources and detectors that can enable spectroscopic techniques in the linear and nonlinear regimes. While microwave and optical frequency regions
2
are well established with many light sources along with detectors, the THz region had remained well-unexplored for a long time. Recent years have witnessed significant successful developments of techniques related to static and transient terahertz (THz) time-domain spectroscopy (THz-TDS) and imaging. The versatility of these techniques has been demonstrated in a wide range of applications in many disciplines, such as in spectroscopic imaging and tomography [4,5], label-free genetic diagnostics and analysis [6], biomolecular spectroscopy [7], and biomedical applications such as T-ray biosensor [8].
1.2 Motivation of this thesis work
1.2.1 The imperative need for intense THz sources and detectors
The need for intense THz sources is on the rise, due to recent significant advances in studying the nonlinear optical responses of materials in THz frequencies and at picosecond or even sub-picosecond timescale. Such remarkable progress has undoubtedly been accelerated by the incredible advances in both generating and detecting coherent THz radiation. For example, the recent surge in the availability of intense THz radiation sources is allowing new solutions to long-standing challenges, as well as opening new avenues in both science and technology. For example, intense THz sources have the potential to enable THz-TDS of aqueous samples, such as those related to biology and medicine [9,10], with high signal-to-noise ratio (SNR) [11]. Due to the high absorption of THz radiation by water, such THz spectroscopic experiments have been difficult to perform in transmission configuration. Techniques such as THz time-domain attenuated total reflection (ATR) spectroscopy [12,13] has been exploited instead to avoid the limitations in such experiment. However, data analysis of this technique is rather complicated.
The availability of THz sources with high flux is opening the possibility to perform THz-TDS of aqueous and other highly absorptive media in transmission configuration. Humidity also has significant influence in THz applications, such as large-scale object imaging and remote sensing for security purposes [14,15], and wireless communications [16,17], in which the THz pulse may need to propagate long distances through the atmosphere. Furthermore, intense THz sources are also enabling the observation of fascinating nonlinear phenomena in light-matter interaction processes [18-25]. For example, THz nonlinear spectroscopy offers a unique characterization method of novel materials for future THz electronics, such as graphene [26-28] and topological insulators [29,30]. In turn, such demand is pushing the limits of tabletop, intense,
3
and ultrafast broadband THz emitting sources, resulting in peak THz electric fields of sub-MV/cm to several sub-MV/cm [31-35].
For such THz-based technological applications to be fully implemented, it is of crucial importance to have coherent THz detection techniques with both high dynamic range (DR) and high SNR [11]. Where DR is defined as the maximum measurable phase divided by the standard deviation of the phase noise when no THz signal is present. High DR measurement is especially important in many of the above applications, where one needs to compare the waveform of intense THz pulses with relatively weak THz signals (such as the THz signal after experiencing strong absorption, or the nonlinear THz signal). Large DR is also required in THz-TDS measurements in order to avoid misinterpretation of experimentally obtained data [36]. However, electro-optic sampling (EOS)[37-39], which is currently one of the most popular methods for THz detection, has achieved limited DR. This limited DR of conventional EOS technique can be attributed to the mechanism by which the THz field is measured. In conventional EOS, a linearly polarized femtosecond laser pulse co-propagates with a picosecond THz pulse in an electro-optic (EO) detection crystal [37]. The THz-electric-field-induced birefringence in the EO crystal (due to the Pockels effect) changes the polarization of the co-propagating optical probe pulse. The resulting ellipticity of the probe pulse is measured by using a detection system that consists of a quarter-wave plate, a polarizer and a pair of balanced photodiodes placed after the detection crystal. The change in phase, which is proportional to the THz electric field, is manifested as a modulation in the intensity of the two polarization components of the optical probe beam (OPB) pulse. However, if the induced phase change in the probe pulse components is more than /2, a reversal in the intensity modulation of the probe pulse will take place. This, in turn, results in ambiguities in measuring THz fields that induce phase differences of more than /2[40]in the conventional EOS configuration. This limitation is known as over-rotation [40] and hence severely limits the DR of conventional EOS. In addition, over-rotation poses several other restrictions. For example, higher spectral resolution in THz-TDS requires thicker EO detection crystals [40]. However, a thicker crystal increases the possibility of over-rotation, as induced birefringence in the EO crystal is proportional to both the THz electric field and the thickness of the crystal. One could use thin (less than 50 m) detection crystals, but the DR will still suffer from lower THz electric field modulation on the OPB pulse. Furthermore, the limited DR of conventional EOS makes it very difficult to measure intense THz signals and weak signals at the
4
same time. Currently, researchers are forced to use THz filters (such as high resistivity float-zone silicon plates) to make sure that their measurements are within the DR of the conventional EOS technique, and then calibrate them against reference data. However, dispersion and wavelength-dependent absorption of such plates would modify the THz waveform, thus complicating the correct measurement of intense THz waves using conventional EO sampling [41].
1.3 The objectives and scope of this thesis work
The core objective of this thesis work is to establish a novel THz detection technique that comprises no over-rotation limitation, ultra-high DR, and high SNR characteristic features. Furthermore, the second objective of the thesis is to exploit this detection technique in exploring the THz response of high-permittivity materials, such as Barium Strontium Titanate (BST). In the new THz detection techniques, we make use of spectral-domain interferometry (SDI) to develop different detection schemes, such as Mach-Zehnder interferometer based SDI (MZI-SDI) and fiber-based SDI (later we distinguish it as cross-polarized SDI (CP-(MZI-SDI)) schemes to detect intense THz electric fields without over-rotation and with ultrahigh DR. Worth to note, in the initial stage of the SDI-THz project, we have used a Michelson-type (later we distinguish it as standard SDI) technique to measure the THz waveform. The standard SDI technique for THz electric field measurement provided a large DR however it was limited in the duration of the pulse that could be measured (3 ps), which is far too short for most applications. The SNR of the standard SDI technique was also limited, being far inferior compared with the popular conventional EOS technique.
The thesis is organized into four main chapters. Chapter 2 covers the literature survey on various techniques of generating and detecting THz pulses via optical methods based on employing ultrashort Ti: sapphire laser pulses, with the emphasis on generating and detecting intense THz pulses. Moreover, in the same chapter, some applications of intense THz radiation are discussed.
In the first part of Chapter 3, we started with discussion and reproduction of the THz electric field measurement by using Michelson-type interferometer based-SDI technique (we later distinguish it as the standard SDI technique), illustrating its drawbacks (e.g. limited temporal scan range and inferior SNR) and the possible means to overcome such drawbacks. In the second part of Chapter 3, we discuss the experimental demonstration of the use of MZI in SDI technique
5
for THz electric field measurement and how it helped in eliminating some drawbacks experienced in the standard SDI for THz electric field measurement.
In Chapter 4 we describe, once more for the first time, a novel technique for detecting coherent THz radiation, possessing tremendous DR ~7×10⁶, while at the same time having high SNR that is comparable to that of the commonly used EOS technique. In this new technique, we have exploited the birefringence in a single mode polarization-maintaining (PM) fiber that creates two polarized signals at the exit end of the fiber. Thus, we name this technique the cross-polarized (CP)-SDI technique. As mentioned earlier, THz technology is extending into various domains of science and technology and is rapidly becoming an important tool. Many such applications require measurements of the THz waveform with both high DR and high SNR. Further, we have discussed and experimentally demonstrated two attempts to increase the SNR of the CP-SDI technique by (i) introducing a new referencing method and (ii) using a compact CP-SDI module that reduces the mechanical vibration in the setup.
In Chapter 5, meriting from the characteristics of the new technique (e.g. ultrahigh DR and excellent SNR), we experimentally demonstrate the second objective of this thesis, which is the validation of the CP-SDI technique in THz spectroscopy application. We have chosen to perform THz-TDS measurements- in transmission geometry- on material that encounters challenges in the THz frequency range, such as high permittivity sample of Barium Strontium Titanate (BST) that notoriously has significant losses in THz frequencies region thus affecting the SNR of the measurement. The experiment was an excellent testing opportunity to evaluate our new technique capabilities in determining BST dielectric response in the THz frequency region. Furthermore, we hold a comparison between dielectric response results obtained via CP-SDI THz detection technique and those obtained via conventional EOS THz detection technique for the same BST sample and under the same experimental conditions. We show that from the comparison, the CP-SDI technique enables obtaining more accurate results.
References
[1] A. Handi, Int. J. Infrared Millim. Waves 24, 91-118 (2003). [2] M. F. Kimmitt, J. Biol. Phys. 29, 77-85 (2003).
[3] http://pratt.duke.edu/about/news/willie-padilla-exploring-technologys-terahertz-gap.
[4] Y. Watanabe,K. Kawase, T. Ikari, H. Ito, Y. Ishikawa and H. Minamide, Appl. Phys. Lett.
83, 800-802 (2003).
6
[6] M. Nagel, P. H. Bolivar, M. Brucherseifer, H. Kurz, A. Bosserhoff and R. Buttner, Appl. Phys. Lett. 80, 154-156 (2002).
[7] A. Markelz, S. Whitmire, J. Hillebrecht, and R. Birge, Phys. Med. Biol. 47, 3797-3805 (2002).
[8] S. P. Mickan, A. Menikh, H. Liu, C. A. Mannella, R. MacColl, D. Abbott, J. Munch and X.-C. Zhang, Phys. Med. Biol. 47, 3789-3795 (2002).
[9] X. -C. Zhang, Phys. Med. Biol. 47, 3667-3677 (2002).
[10] E. Pickwell and V. P. Wallace, J. Phys. D: Appl. Phys. 39, R301-R310 (2006).
[11] G. Zhao, R. N. Schouten, N. Van der Valk, W. T. Wenckebach, and P. C. M. Planken, Phys. Med. Biol. 47, 3699-3704 (2002).
[12] M. Nagai, H. Yada, T. Arikawa and K. Tanaka, Int. J. Infra. Milli. Waves 27, 4 505–515 (2006).
[13] A. Nakanishi, Y. Kawada, T. Yasuda, K. Akiyama, and H. Takahashi, Rev. Sci. Inst. 83, 033103 (2012).
[14] M. Tonouchi, Nature Photon. 1, 97-105 (2007).
[15] H. -B. Liu, H. Zhong, N. Karpowicz, Y. Chen, and X.-C Zhang, Proc. IEEE 95, 1514-1527 (2007).
[16] S. Koenig, D. Lopez-Diaz, J. Antes, F. Boes, R. Henneberger, A. Leuther, A. Tessmann, R. Schmogrow, D. Hillerkuss, R. Palmer, T. Zwick, C. Koos, W. Freude, O. Ambacher, J. Leuthold and I. Kallfass, Nature Photon. 7, 977- 981 (2013).
[17] K. -C. Huang and Z. Wang, IEEE Microw. Mag. 12,108-116 (2011).
[18] C. Vicario, C. Ruchert, F. Ardana-Lamas, P. M. Derlet, B. Tudu, J. Luning and C. P. Hauri, Nature Photon. 7, 720-723 (2013).
[19] K. Tanaka, H. Hirori, and M. Nagai, IEEE Trans. THz Sci. Technol. 1, 301-312 (2011). [20] T. Kubacka, J. A. Johnson, M. C. Hoffmann, C. Vicario, S. de Jong, P. Beaud, S. Grubel,
S.-W. Huang, L. Huber, L. Patthey, Y.-D. Chuang, J. J. Turner, G. L. Dakovski, S.-W.-S. Lee, M. P. Minitti, W. Schlotter, R. G. Moore, C. P. Hauri, S. M. Koohpayeh, V. Scagnoli, G. Ingold, S. L. Johnson, U. Staub, Science 343, 1333-1336 (2014).
[21] H. Y. Hwang, S. Fleischer, N. C. Brandt, B. G. Perkins Jr., M. Liu, K. Fan, A. Sternbach, X. Zhang, R. D. Averitt and K. A. Nelson, J. Mod. Opt. 62, 1447-1479 (2015).
[22] T. Kampfrath, A. Sell, G. Klatt, A. Pashkin, S. Mahrlein, T. Dekorsy, M. Wolf, M. Fiebig, A. Leitenstorfer and R. Huber, Nature Photon. 5, 31-34 (2011).
[23] L. Razzari, F. H. Su, G. Sharma, F. Blanchard, A. Ayesheshim, H. -C. Bandulet, R. Morandotti, J. -C. Kieffer, T. Ozaki, M. Reid, and F. A. Hegmann, Phys. Rev. B 79, 193204 (2009).
[24] F. H. Su, F. Blanchard, G. Sharma, L. Razzari, A. Ayesheshim, T. L. Cocker, L. V. Titova, T. Ozaki, J.-C. Kieffer, R. Morandotti, M. Reid, and F. A. Hegmann, Opt. Express 17, 9620-9629 (2009).
7
[25] M. Liu, H. Y. Hwang, H. Tao, A. C. Strikwerda, K. Fan, G. R. Keiser, A. J. Sternbach, K. G. West, S. Kittiwatanakul, J. Lu, S. A. Wolf, F. G. Omenetto, X. Zhang, K. A. Nelson and R. D. Averitt, Nature 487, 345-348 (2012).
[26] H. A. Hafez, I. Al-Naib, K. Oguri, Y. Sekine, M. M. Dignam, A. Ibrahim, D. G. Cooke, S. Tanaka, F. Komori, H. Hibino, and T. Ozaki, AIP Adv. 4, 117118 (2014).
[27] H. A. Hafez, I. Al-Naib, M. M. Dignam, Y. Sekine, K. Oguri, F. Blanchard, D. G. Cooke, S. Tanaka, F. Komori, H. Hibino, and T. Ozaki, Phys. Rev. B. 91, 035422 (2015).
[28] L. Vicarelli, M. S. Vitiello, D. Coquillat, A. Lombardo, A. C. Ferrari, W. Knap, M. Polini, V. Pellegrini, and A. Tredicucci, Nat. Mater. 11,865–871(2012).
[29] X. Zhang, J. Wang, and S.-C. Zhang, Phys. Rev. B. 82, 245107 (2010).
[30] L. Wu, M. Brahlek, R. Valdes Aguilar, A. V. Stier, C. M. Morris, Y. Lubashevsky, L. S. Bilbro, N. Bansal, S. Oh and N. P. Armitage, Nature Phys. 9 410-414 (2013).
[31] H. Hirori, A. Doi, F. Blanchard, and K. Tanaka, Appl. Phys. Lett. 98, 091106 (2011).
[32] F. Blanchard, L. Razzari, H.-C. Bandulet, G. Sharma, R. Morandotti, J.-C. Kieffer, T. Ozaki, M. Reid, H. F. Tiedje, H. K. Haugen, and F. A. Hegmann, Opt. Express 15, 13212-13220 (2007).
[33] K. L. Yeh, M. C. Hoffmann, J. Hebling, and K. A. Nelson, Appl. Phys. Lett. 90, 171121 (2007).
[34] X. Ropagnol, F. Blanchard, T. Ozaki, and M. Reid, Appl. Phys. Lett. 103, 161108 (2013). [35] A. Sell, A. Leitenstorfer and R. Huber, Opt. Lett. 33, 2767-2769 (2008).
[36] P. U. Jepsen, and B. M. Fischer, Opt. Lett. 30, 29-31 (2005). [37] Q. Wu and X. -C. Zhang, Appl. Phys. Lett. 67, 3523-3525 (1995). [38] Q. Wu and X.-C. Zhang, Appl. Phys. Lett. 71, 1285-1286 (1997). [39] Q. Wu and X.-C. Zhang, Appl. Phys. Lett. 70, 1784-1786 (1997).
[40] G. Sharma, K. Singh, I. Al-Naib, R. Morandotti, and T. Ozaki, Opt. Lett. 37, 4338-4340 (2012).
8
Chapter 2
Theoretical background
Outline
In this chapter, we will discuss commonly used methods for THz pulse generation and detection as well as some THz applications, with emphasis on laser based intense few-cycle THz sources. In the first part of this chapter, we will discuss the various methods for THz pulse generation, namely photoconductive (antennas) switches (PCA), difference frequency mixing or optical rectification (OR), and air plasma THz sources. In the second part of this chapter, we will discuss the common methods for coherent THz detection, namely the PCA, the electro-optic sampling (EOS), and THz-air-biased coherent detection (THz-ABCD) techniques. Furthermore, we will highlight the limitations of these techniques in measuring intense THz pulse radiation. A novel detection technique based on spectral-domain interferometry (SDI) that suits well intense THz electric field measurement and avoids limitations suffered in the other THz detection techniques will be discussed as well. In the third part of this chapter, we will discuss conventional THz application such as THz-time domain spectroscopy (THz-TDS) as well as two applications that have been made feasible with intense THz sources.
2.1 Conventional femtosecond laser methods for generating few-cycle
THz pulse
Despite a wide range of applications and needs, the availability of suitable sources for THz experimental investigation is yet limited. However, there has been an important advancement in developing tabletop THz pulse sources by exploiting femtosecond lasers. The ultrafast photoconductive switch (antenna), optical rectification in nonlinear crystals, and air plasma sources are examples of such techniques widely adopted in the THz community.
2.1.1 Photoconductive switches (antennas)
The photoconductive antenna (PCA) scheme is typically designed from a high resistivity semiconductor substrate with two electrodes fabricated on the substrate, as schematically
9
depicted in Fig. 2.1. The operational concept of the PCA is based on generating rapidly varying currents that in turns emit electromagnetic radiation. The current variation is caused by modulation of the resistance of a semiconductor by the absorption of the short laser pulse. This method of generating picosecond THz pulses was invented by Auston in 1984 [1,2]. Nowadays PCA scheme for THz generation still finds widespread applications with the most common exploited substrate material is GaAs [3-11]; other materials used are silicon [2,1,12,13] and InP [5,7].
Figure 2.1|Partial schematic illustrates THz generation via the photoconductive antenna (PCA). Eb is the applied static electric field and J is the surface current density [adapted from ref. 14].
The THz pulse generated via PCA scheme is distinguished by unique characteristics, namely the strong asymmetry in the magnitude of the positive and negative components of the THz field, the quasi-half-cycle nature, and the relatively lower central frequency. Such unique characteristics accompanied by the accelerated development in amplified Ti:sapphire laser technology has driven the interest in generating intense THz pulses from PCAs. In order to achieve this objective, the aperture of the PCA is increased and eventually, large aperture photoconductive antenna (LAPCA) scheme has been introduced for intense THz pulse generation [6]. In this scheme, the generated THz field in the far field is typically described by using Maxwell’s equations, the THz electric field is proportional to the time derivative of the transient current, [15]:
𝐸(𝑡) ∝ 𝑑𝐽𝑑𝑡 ∝ 𝐸𝑏𝑑𝑛(𝑡)𝑑𝑡 (2.1)
Here 𝐸(𝑡) is the envelope of the emitted THz field, J is the current density, Eb is the applied bias
10
Therefore, in order to generate intense THz pulses via LAPCA scheme, one needs to apply the highest voltage possible between the electrodes. The LAPCA scheme differs from other intense THz sources that rely on nonlinear optical process, since the THz energy is extracted from the bias field and not directly from the laser pulse energy [5].
The current golden standard for substrate material for PCA is GaAs, which has been the popular choice owing to its suitable electrical and optical properties. For LAPCAs there are limitations in using GaAs with gaps sizes of a few millimeters. For example, carriers would be accelerated to energies high enough to cause damage to the semiconductor substrate beside the degradation with usage and subsequent failure [16], resulting primarily from increased temperature due to Joule heating. Thus in order to circumvent these limitations in GaAs, other wide bandgap semiconductor materials with suitable thermal and electrical properties are attempted, for instance, diamond [17], ZnO [18], GaN [19] and ZnSe [20,21] crystals have been experimentally tested for LAPCAs substrates.
Figure 2.2| (a) Interdigitated electrodes in the LAPCA for THz generation scheme. Adjacent gaps between the electrodes have opposite directions of the static electric field (white arrows). (b) To prevent canceling of the oppositely directed contributions all gaps with a field directed downwards are blocked [adapted from ref. 28].
Nowadays there is an emerging trend in using interdigitated LAPCA as an alternative approach to reducing the bias voltage (and thus the requirement for the high-voltage source) while maintaining a large aperture for illumination [22]. Fig. 2.2 shows a schematic diagram of a typical interdigitated LAPCA. Interdigitated LAPCAs have many advantages compared to simple LAPCAs. For instance, they (i) increase the THz efficiency due to the trap field enhancement near the multiple anodes [23], (ii) allow the possibility to apply higher bias fields [24], and (iii) limit Joule heating, since the interdigitated structure typically uses a shadow mask
11
that allows the illumination of less than half of the LAPCA [24,25]. On the other hand, these structures have some limitations. For example, if the gap size is too small (below 100 µm for a GaAs LAPCA), a relatively large capacitance is created in the antenna, which tends to limit the maximum radiated THz power. In this case the LAPCA works in the space-charge screening regime, which saturates the radiated field[26,27]. The application of the shadow mask also limits the maximum efficiency of the LAPCA, since at least half of the total area is shadowed. However, despite these limitations, the highest optical-to-THz conversion efficiency (~1.6%) is obtained with a GaAs interdigitated LAPCA [16].
Enhanced performance of the interdigitated LAPCA scheme has been proposed by using a phase mask instead of a shadow mask, thus exploiting the total aperture of the interdigitated LAPCA [25].
2.1.2 Difference frequency mixing or optical rectification in nonlinear media
Difference frequency mixing or optic rectification (OR) is a popular method for intense THz generation, which is based on the second order nonlinear process in noncentrosymmetric materials [29-32]. This method offers high THz pulse energies as well as high electric fields with broader bandwidth THz pulses compared to PCA approach [33,34]. The first attempt to generate THz radiation using OR technique was carried out by Zernike and Berman [35]. In this process, an optical pulse that is propagating through a nonlinear crystal induces a time dependent polarization change that leads to the radiation of an electromagnetic wave (as depicted schematically in Fig. 2.3) whose polarization depends on the crystal orientation and on the incident pump beam polarization [36], the temporal THz field is proportional to the second derivative of the change of this polarization with respect to time t:
𝐸𝑇𝐻𝑧(𝑡) ∝ 𝜕
2
𝜕𝑡2𝑃2(𝑡) (2.2)
Here, ETHz is the electric field, P(t) is the polarization induced in the crystal by the electric field
associated with an intense optical pulse. Eq. (2.2) contains not only a term linear in the electric field but also higher-order terms and can be expressed as the following expansion in powers of the electric field:
12
Here, 𝜒(𝑛) is the nth-order electric susceptibility tensor of the material. THz generation via difference frequency mixing process is related to the second order susceptibility of the material, given by:
𝑃(2)(Ω) = 𝜀
0𝜒(2)(Ω = 𝜔2− 𝜔1; 𝜔1, −𝜔2)𝐸(𝜔1)𝐸∗(𝜔2) (2.4)
Here, Ω is the frequency difference between two frequency components of the optical pump 𝜔1 and 𝜔2. If the frequencies ω1 and ω2 are contained in the electric field in Eq. (2.4), the resultant
polarization will contain two important effects:
Figure 2.3| THz generation with collinear optical pump by ultrashort laser pulse in a nonlinear crystal via OR method.
(i) second-harmonic generation [37], and optical rectification [38]. The former is attributed to the sum of frequencies ω1 + ω2 (sum frequency generation) or (for ω1 = ω2, the second-harmonic
generation) and the latter is due to the difference of the frequencies ω1 − ω2 (difference
frequency generation) or (for ω1 = ω2, optical rectification). Several requirements should be
satisfied in the material of choice for THz generation via OR process, for instance, the material should have relevant nonlinear susceptibility and it should be transparent at all the frequencies involved in order to maximize the effective interaction length and mitigate absorption limitation. Furthermore, the material should have high damage threshold owing to the use of high intensities in such a nonlinear process. Other material properties should be carefully considered, such as diffraction, saturation, and phase matching conditions. The matching between the optical group velocity and the THz phase velocity is one of the most crucial factors for an efficient OR process. THz waves are generated at different positions in the media upon passage of the optical pump beam, and maximum output is expected when all the waves add up constructively, leading to continually increasing electrical field propagation along the entire interaction depth of the medium. The phase matching condition is given by the following formula [39]:
Radiated THz beam Incoming optical beam
( 40 fs, 800 nm )
13
𝑘(𝜔2) − 𝑘(𝜔1) = 𝑘(Ω) (2.5)
Here, k is the wave vector depending on the electromagnetic frequency and their corresponding refractive indexes. Defining the coherence length as the interaction length at which the phase change reaches 𝜋 [40], during which THz waves can have a positive build up thus avoiding the effects of phase mismatch
𝛿𝑘𝐿𝑐 = 𝜋 (2.6)
Here, 𝛿𝑘 = 𝑘𝜔2− 𝑘𝜔1 − 𝑘𝑇𝐻𝑧 and 𝐿𝑐 is the coherence length. Some relevant parameters of common nonlinear materials for OR scheme are summarized in Table 2.1 [41]. In the past, a tremendous number of materials have been exploited for generation of THz radiation from OR scheme, for instance semiconductors such as GaSe [42-56], ZnGeP2 [47], and the zinc blende
semiconductors such as GaAs [45,57,58], CdTe [59], InP [57], ZnTe [10,60,61] and GaP [47,48,62].
Crystal
EO coefficient [pm/V]
Index of
refraction THz Index of refraction THz Absorption
coefficient (𝐜𝐦−𝟏) ZnTe r41 = 4.0 (0.633 m) 2.85 (0.8 m) ~3.17 1.3 LiNbO3 r33 = 30.9 r51 = 32.6 (0.633 m) no = 2.29, ne = 2.18 (0.633 m) no ~ 6.8, ne ~ 4.98 16 LiTaO3 r33 = r51 = 30.5 (0.820 m) no = 2.176, ne = 2.180 (0.633 m) no ~ 6.5, ne ~ 6.4 46 CdTe r41 = 4.5 (1.00 m) 2.84 (0.8 m) ~3.23 4.8 DAST r11 = 160 (0.82 m) no = 2.46, ne = 1.70 (0.820 m) ~2.4 150 GaSe 1.7 (0.8 m) 2.85 (0.8 m) ~3.72 0.07 GaAs r41 = 1.43 (1.15 m) 3.61 (0.886 m) ~3.4 0.5
Table 2.1| Properties of common materials used for THz generation via OR [41].
Dielectrics materials such as LiNbO3 [48,63–68], LiIO3 [69], LiTaO3 [70-72] and SiO2 [35,73]
have been reported as well. Moreover, organic crystal such as 4-N,N-dimethylamino-4-N-methyl-stilbazolium tosylate (DAST) has been successfully exploited for intense THz generation [74–80]. However, currently, the most often used materials for THz generation are ZnTe, GaSe,
14
and LiNbO3. ZnTe is favorable as THz emitter because of its relatively high nonlinear
coefficient, high-damage threshold, and excellent phase matching between the laser pulse group velocity and the THz pulse phase velocity that results in achieving the phase matching collinearly. However, ZnTe has the disadvantage of competing nonlinear processes, e.g. white-light generation at high pump intensities, thus limiting upscaling of the optical pump intensity. On the other hand, GaSe tolerates high optical pump intensities, but phase matching condition is met only for mid-infrared frequencies. Furthermore, ZnTe and GaSe are usually pumped in a collinear arrangement (as depicted in Fig. 2.3), while LiNbO3 yields very high THz pulse
energies in non-collinear arrangement [68] (as depicted in Fig. 2.4). LiNbO3 crystal has the
following advantages over ZnTe: higher electro-optic coefficient, the generated THz energy is orders of magnitude higher than in ZnTe generation [81], and higher pumping laser energy can be used without suffering from two photon absorption of the pump energy [61,64,82,83]. However, there is a certain condition that must be satisfied in order to achieve phase matching between the optical group velocity and THz phase velocity and thus emitting THz efficiently from LiNbO3.
Figure 2.4| THz generation with non-collinear optical pump by ultrashort laser pulse in LiNbO3
crystal via optical rectification configuration.
This condition is achieved via a technique known as tilted-pulse-front (TPF) technique, in which
non-collinear phase matching is satisfied and can be expressed mathematically as:
15
Here, 𝑣𝑜𝑝𝑔𝑟 is the group velocity of the optical pulse, 𝛾 is the tilt angle, and 𝑣𝑇𝐻𝑧𝑝ℎ is the phase velocity of the THz pulse. The pulse front of the optical pulse is titled typically using a diffraction grating, and a telescope is then used to image the titled-pulse at the crystal position with an appropriate demagnification ratio M that is determined by using do (object distance from
the lens) and di (image distance from the lens) shown in Fig. 2.5 where a schematic diagram of
the setup for ultrafast THz pulse generation using a titled-pulse-front arrangement, employing a single lens and an optical diffraction grating.
Moreover, the crystal is cut at 𝛾 angle to fulfill the phase matching condition inside the crystal. In this configuration, 𝛾 is given by [84]:
tan 𝛾 =𝑚 𝑁 𝜆𝑝𝑢𝑚𝑝𝑀
𝑛𝑝𝑢𝑚𝑝 𝑐𝑜𝑠𝛽 (2.8)
Here, m is the diffraction order; N is the grating groove number density, 𝑛𝑝𝑢𝑚𝑝 is the refractive
index of the LiNbO3 crystal at the pump laser wavelength and 𝛽 is the diffraction angle of the
incident beam on the grating.
Figure 2.5| Partial schematic of experimental setup for THz generation by titled-pulse-front technique in LiNbO3. An optical diffraction grating is used to title the pulse front. A tilt angle γ is
introduced between the pulse front and the phase front.
Typical experimental setups of the LiNbO3 THz source based on the titled-pulse-front technique
use an amplified Ti:sapphire laser, which delivers several mJ, femtosecond pulses at kHz repetition rates [84]. In order to avoid the photorefractive effect in the LiNbO3 crystal and thus,
in turn, to mitigate THz radiation absorption, the crystal is commonly doped with Mg at 1-mol%
Diffraction grating
Lens
Incident optical pump beam
Radiated THz
LiNbO3
Pulse front
Titled pulse front
16
[85]. Typical tilted-pulse-front LiNbO3 THz sources provide peak electric fields of > 200 kV/cm
in the 0.1-2.5 THz spectral range, with conversion efficiencies of ~10-3, which is ~30 times higher than large aperture ZnTe sources.
In addition to its suitability to LiNbO3 crystal, the tilted-pulse-front technique can also be applied
to other materials. For example, THz generation in room temperature gallium arsenide (GaAs) crystal using pump laser at a wavelength of 1.8 μm has been reported with the tilted-pulse-front technique [86].
2.1.3 THz waves generation in plasma
Another method for intense THz wave generation from plasma has been developed in the past years, where an intense ultrafast laser pulse with a center wavelength of 800 nm is frequency doubled by a nonlinear crystal such as Barium-Borate (BBO) (as shown in Fig. 2.6). Both the 800 nm (the fundamental) and 400 nm (the second harmonic (SH)) pulses are focused together and ionize some gas, creating a filament of plasma and intense, broadband THz radiation.
Figure 2.6| Partial schematic of the experimental setup for THz generation in plasma. The pulse at the fundamental contains wavelengths between 770 and 830 nm, the second harmonic (SH) between 385 and 415 nm [adapted from ref. 28].
The generation mechanism could be described by four-wave optical rectification with a third-order nonlinear process [87-91] χ(3)(ΩTHz: 2ω + ΩTHz, – ω, – ω), where ΩTHz is the frequency of
the emitted THz wave. Following the four-wave mixing theory, the THz field is proportional to: 𝐸𝑇𝐻𝑧 ∝ 𝜒(3)𝐸2𝜔(𝑡)𝐸𝜔∗(𝑡)𝐸𝜔∗(𝑡) cos(𝜑) (2.9)
Here, is the relative phase difference between the fundamental and the SH frequencies[88]. Compared to PCA or OR schemes, THz radiation generated from plasma sources offers much broader bandwidth because plasmas do not have phonons and dispersion is very small [92]. For example, OR in LiNbO3 crystals offers spectral bandwidth only up to 1.5 THz despite its intense
17
radiation [93] while the plasma source spectral range can reach up to 200 THz [92]. Another feature that distinguishes plasma sources for THz generation is the absence of breakdown field and therefore, it is possible to generate very high electric fields (>1MV/cm).
THz generation technique Generated THz radiation Limitations and demerits
Photoconduction Requirements:
*Photoconductive antenna. *High bias voltage.
*Half-cycle THz pulses with a few hundreds of kV/cm peak electric field.
*Relatively narrow band width ranging from 0.1 THz to 2 THz.
*Laser damage threshold of the antenna. *Bias voltage breakdown of the antenna.
Optical rectification Requirements:
*Noncentrosymmetric nonlinear medium with a high nonlinear coefficient.
*Single cycle THz pulses with peak field of several hundreds of kV/cm.
*Bandwidth typically from 0.1 THz up to 6 THz maximum depending on the nonlinear crystal.
*Phase matching condition.
*Laser damage threshold of the nonlinear medium.
*Thermal effects in the crystal when pumping at high laser intensities.
Air and metal-surface plasma generation Requirements:
*Tight focusing of intense short laser pulses in air or onto the metal surface.
*Intense broadband single- and multicycle THz pulses with high peak fields in the MV/cm range.
*Very sensitive to environmental fluctuations that can affect the stability of both the generated plasma and in turn the THz pulses.
*Damage effects on the metal surface, which requires pumping at various positions on the metal surface and in turn high consumption of metal samples. *Difficulties in employing proper filtration to extract pure THz pulses.
*Plasma fluctuations that can affect stability of the source.
Table 2.2| Comparison between common THz generation techniques [41]
Furthermore, the experimental setups implemented for such generation method do not require reflective surfaces and hence leads to the elimination of echoes, which in turn allows for very long temporal scan length (i.e. high-frequency resolution). In addition to gases, solid targets can be also used for intense THz pulse generation from high-intensity laser-plasma interaction at
18
relativistic intensities [94]. Table 2.2 summarizes the techniques commonly exploited for intense THz generation along with their requirements, specifications of the pulse, spectral band width, and limitations.
2.2 Intense THz pulse detection
2.2.1 Conventional techniques for coherent THz detection
Measurement of subpicosecond single-cycle electromagnetic transients with femtosecond laser pulses is acquiring widespread acceptance as a convenient method of accessing the THz frequency range. As far as the detection of THz pulses is concerned, three main schemes have been commonly used and well described in the literature: bolometers [6,95], time-gated antennas [96], and time-gated electro-optic detectors [97]. The advantage of time-gated detection over bolometric detection is the measurement of the THz pulse electric field amplitude and phase rather than average power of the THz pulse; therefore, the latter cannot provide a coherent measurement. Furthermore, the time-gated detection is superior in suppressing of the thermal background compared to bolometric detection. In principle, the THz emission mechanisms discussed in section 2.1 can be reversed and exploited for the THz pulses detection. For instance, the same PCAs structures can be reversed and used as THz detectors while the reverse mechanism for OR is electro-optical sampling (EOS). Both detection techniques are routinely used for measuring THz electric field waveform. The reversed mechanism for plasma THz generation is known as THz-air-biased-coherent detection (THz-ABCD).
2.2.1.1 PCA for THz electric field measurement
Using a PCA scheme in THz detection (schematically shown in Fig. 2.7) involves measuring the photocurrent generated by the probe beam across the electrode gap and biased by the THz electric field. In absence of THz field across the gap, photo-carriers created by the probe beam diffuse randomly and do not generate any net current. However, the presence of THz field across the gap cause the separation of the electron hole pairs and a net current is generated. The measured photocurrent I(t) depends not only on the incident THz electric field but also on the transient surface conductivity σs(t) [98]:
𝐼(𝑡) ∝ ∫ 𝜎−∞𝑡 𝑠(𝑡 − 𝑡′)𝐸THz(𝑡′)𝑑𝑡′ (2.10)
The time dependent conductivity implies that the current cannot flow instantaneously in response to the THz field. The photocurrent is a convolution of the THz field with the conductivity.
19
Figure 2.7| Partial schematic illustrates THz pulse detection via photoconductive antenna scheme [adapted from ref. 14].
As a consequence, the characteristics of the laser pulse and the semiconductor substrate will affect the detected THz waveform. In order to limit the effects of conductivity, materials with short carrier lifetime (such as low-temperature grown GaAs (LT-GaAs) and doped GaAs) are usually selected [99-101]. LT-GaAs has a carrier lifetime that is shorter than 0.5 ps. For increasing the maximum detected bandwidth, one should also combine a substrate with short carrier lifetime and an optical pulse with short duration. Another factor that influences the bandwidth of the detected THz pulse is the geometry of the PCA. There are four different structures of PCA that are currently used for THz electric field measurement: strip-line, bowtie, butterfly and logarithmic antennas. These PCAs each have different characteristics. For example, the butterfly PCA is very efficient for detecting low THz frequencies, while a strip-line PCA is sensitive for detecting high THz frequencies. Another factor that will greatly influence the detected signal is the dimension of the PCA. For example, a smaller gap size will allow the detection of higher frequencies and larger amplitude signals, while longer electrodes will increase the amplitude of the detected signal but will be more sensitive to low frequencies [102].
2.2.1.2 Electro-optic sampling technique
Electro-optic sampling (EOS) technique is emerging as the most popular choice for THz electric field measurement and that is primarily due to two reasons: (i) electro-optic materials are readily commercially available, unlike time-gated antennas, which typically require the usage of microfabrication techniques to make them. (ii) electro-optic detection is suitable for signals with a large bandwidth, much larger than the bandwidth offered by the PCA scheme [103]. In the
Substrate THz pulse to be detected fs laser A Focusing lens + + + -J
20
EOS technique, an applied electric field induces a refractive-index change in an electro-optic (EO) material at visible and near-IR frequencies that is proportional to the applied field. The technique is based on the linear Pockels effect in an EO crystal together with a femtosecond optical gating pulse, to probe the electric field of the THz pulse [98].
Figure 2.8| THz detection using EOS technique with balanced detection (a). The evolution of optical probe beam polarization components without and with THz presence (b) [adapted from ref. 41].
The refractive-index change in the EO crystal affects the ellipticity of a circularly polarized, synchronized, ultrashort laser pulse that is co-propagating with the THz pulse through the same material. This change in ellipticity is measured with a polarizing beam splitter that separates the two orthogonal polarization components of the optical probe beam. Due to the Pockels effect, the induced birefringence in the nonlinear EO crystal is directly proportional to the THz electric field strength. A balanced photodetector measures the intensity difference between the two components and gives a signal that is directly proportional to the THz electric field. By varying
![Figure 1.1| The spectrum of electromagnetic radiation with THz frequencies situated in between microwave and infrared frequencies [3]](https://thumb-eu.123doks.com/thumbv2/123doknet/5006274.125031/14.918.162.754.568.855/spectrum-electromagnetic-radiation-frequencies-situated-microwave-infrared-frequencies.webp)


![Table 4.1| Parameters of the PM fiber used in the CP-SDI technique [3].](https://thumb-eu.123doks.com/thumbv2/123doknet/5006274.125031/89.918.193.730.322.515/table-parameters-pm-fiber-used-cp-sdi-technique.webp)
