i
Université du Québec
Institut National de la Recherche Scientifique Centre Énergie Matériaux Télécommunications
(INRS-EMT)
In Vitro Selections of Mammaglobin B and Mammaglobin A Aptamers for
detecting Metastatic Breast Cancer Cells Using Terahertz Chemical Microscopy
Par Eman Hassan
Une thèse présenté en application partielle des exigences pour le degré de Doctorat en philosophie (Ph.D.) en sciences de l'énergie et des Matériaux
Jury d’évaluation Président du jury et examinateur interne Examinateur externe Directeur de recherché Codirecteur de recherché Codirecteur de recherche Marc A. Gauthier
INRS - Énergie, matériaux et télécommunications Juewen Liu
Département de chimie, Waterloo Institute for Nanotechnology
Tsuneyuki Ozaki
INRS - Énergie, matériaux et télécommunications
Maria DeRosa
Département de chimie. Université Carleton Bill Willmore
Institut de biochimie. Université Carleton
ii
ACKNOWLEDGMENTS
I would like to sincerely acknowledge my supervisor Prof. Ozaki for giving me the chance to do my experimental part of my P.hD. at Carleton University in Ottawa. I want to thank him also for his support and supervision throughout my PhD program.
I want to send very special thanks to my co-supervisor Dr. Maria DeRosa for her great supervision and support through the years I was doing my Ph.D. research at her lab. Moreover, I want to thank Dr. Bill Willmore (my co-supervisor) to giving me a chance to do part of my experimental work at his lab and for his supervision.
I would like to express my deep appreciation to my friends from the DeRosa lab starting from Emily, Nadine, Phepa, Annamaria, Erin, Chris, and McKenzie for all their support and the great friendship that support and help me through my PhD program. I want to thank also Willmore lab members for their support especially Mary and Haiyun.
I would like to thank my undergraduate students James Podrebarac, Usman Khan, Andries Selst, Anisha Ghelani, and Jacqueline Addo that help me in my Ph.D. research.
Many thanks also goes to Dr. Bruce McKay from the Biology department at Carleton University to give me a chance to use his flow cytometry instrument and for his help in the data analysis as well. Also I want to thank Andrew Robinette from the Willmore lab for his help in running the flow cytometry.
Special thanks goes to Dr. Kiwa (and his student Yuki Hanaoka) for doing the TCM experiments at his lab at Okayama University (Japan) and for the data analysis as well.
Finally I would like to express my gratitude to INRS for their financial support during the years of my Ph.D. program.
iii
ABSTRACT
Breast cancer is the most common cancer diagnosed in Canadian women, accounting for 26% of all newly diagnosed cancers in women. Metastatic breast cancer (MBC) is the stage of cancer where the disease has spread to distant parts of the body, further than the axillary lymph nodes. Breast cancer cells that leave the primary tumor to the blood are called circulating tumor cells (CTCs). Studying CTCs allows for better understanding of the metastases process. The detection of CTCs is a challenging task due to the heterogeneous nature of CTCs and lack of biomarkers. There is an urgent need to identify more biomarkers to help in the detection of CTCs from breast cancer.
Mammaglobin B (MGB2) and mammaglobin A (MGB1) proteins are small secretory proteins that are believed to have roles in cancer development, immune system regulation, and androgen binding. MGB2 is found at high levels in many secretions, including those from uterine, prostatic, pulmonary, and lacrimal and salivary glands, whereas MGB1 expression is exclusive to the breast tissue. Since both proteins are overexpressed in most cases of metastatic breast cancer,, MGB2 and MGB1 are very attractive biomarkers that could be used in the detection of breast cancer and breast CTCs.
Aptamers are powerful recognition elements. They are single-stranded ssDNA or RNA oligonucleotides that bind to their targets with high affinity and selectivity. Aptamers are chemically produced via a process called Systematic Evolution of Ligands by EXponential enrichment (SELEX). SELEX is an iterative in vitro processwhich enriches target-binding sequencesfrom randomized large ssDNA or RNA libraries. In each round of SELEX, target–binding sequences are eluted from target molecules, amplified, and used as the library for subsequent rounds. This process results in an aptamer with high affinity and specificity for the target.
In this work, a group of aptamers against MGB2 and MGB1 proteins were developed for the first time using a unique type of SELEX called hybrid SELEX, in which the ssDNA library was alternated between two targets that are the recombinant form of both MGB2, and MGB1 proteins and breast cancer cells MCF7 and MDA-MB-415 respectively.
iv
All selected aptamers were then tested for their affinity by determining the dissociation constant (Kd) using flow cytometry. Aptamers were tested for their selectivity by testing their
affinities to other normal and cancer cell lines. Aptamers for both targets that had the highest affinity and selectivity were further tested for their binding affinity to their target cancer cell lines in plasma and whole blood lysate environments using flow cytometry. Aptamers for both targets were tested for their binding affinity in blood containing normal blood cells and spiked with different percentages of target breast cancer cells. The binding affinity of the selected aptamers was tested against their target proteins using Electrophoretic Mobility Shift Assay (EMSA). Finally, and for the first time, the selected aptamers against the two targets were tested to detect breast cancer cells using Terahertz Chemical Microscopy (TCM).
Results obtained by this study revealed the successful selection of a group of aptamers against MGB2 and MGB1 proteins. Among all the selected aptamers, mammaglobin B1 (MAMB1) against MGB2 (MCF7 cell line), and mammaglobin A2 (MAMA2) against MGB1 (MDA-MB-415 cell line) showed the highest affinities to their targets (as indicated by their Kd values). Moreover,
these aptamers showed minimal binding to normal and other cancer cell lines, indicating the high selectivity to their target breast cancer cells. Plasma and whole blood lysate results showed that MAMB1 and MAMA2 aptamers bound specifically to MCF7 and MDA-MB-415 cells respectively. MAMB1 showed higher affinity to MCF7 than MAMA2 showed to MDA-MB-415 cells. Moreover, the study with spiked breast cancer cells showed an increase in the fluorescence intensity with increasing percentages of spiked cells for both aptamers, indicating the great potential to use both aptamers in the detection of breast CTCs.
TCM results showed that terahertz (THz) amplitude was higher when MAMB1 was interacting with MCF7 cells and MAMA2 with MDA-MB-415, compared to the control on the surface of the sensing plate. Moreover, TCM could detect the interaction of a low number of cells (10 cells) binding to their aptamers. MAMB1 aptamer was more selective than MAMA2 aptamer, as shown by TCM.
v
Overall results obtained by flow cytometry and TCM were very promising and indicate the possibility of using MAMB1 and MAMA2 aptamers in the detection of breast cancer and breast CTCs.
vi
Table of Contents
ACKNOWLEDGMENTS ... i
ABSTRACT ... ii
List of Tables ... x
List of Figures ... xi
List of Schemes ... xvi
CHAPTER 1 ... 1
Introduction ... 1
1.1 Breast Cancer ... 1
1.2 Classification of breast cancer ... 2
1.3 Metastatic breast cancer ... 5
1.3.1 Circulating tumor cells ... 6
1.3.2 The metastatic cascade: a closer look ... 6
1.4 Current methods of the detection and quantification of CTCs ... 9
1.5 Aptamers as powerful ligands in the detection of CTCs in metastatic breast cancer ... 12
1.5.1 Aptamers ... ... 12
1.5.2 Systematic Evolution of Ligands by EXponential enrichment ... 14
1.5.3 Cell- SELEX ... .. 15
1.6 High throughput sequencing and aptamer characterization ... 18
1.7 Aptamers generated for the detection of metastatic breast cancer and breast CTCs ... 20
1.8 Flow cytometry as a tool to detect circulating tumor cells from breast cancer ... 22
1.9 Terahertz radiation ... 24
1.9.1 Biomedical applications of THz radiation... 25
1.9.1.1 THz applications and DNA ... 25
1.9.1.2 THz and biological imaging... 26
1.9.1.3 THz and cancer imaging ... 26
1.10 Thesis objectives ... 29
References: ... ... 31
CHAPTER 2 ... 45
vii
2.1 Introduction ... 45
2.1.1 Mammaglobin B and mammaglobin A proteins ... 45
2.1.2 Hybrid (Cross-over) SELEX ... 47
2.1.3 High throughput sequencing ... 48
2.2 Materials and methods ... 50
2.2.1 Materials and cell culture supplements ... 50
2.2.2 Cell lines and cell culture ... 50
2.2.3 DNA synthesis ... 51
2.2.4 Hybrid (Cross-over) SELEX ... 52
2.2.4.1 MGB2 and MGB1 Recombinant proteins SELEX ... 52
2.2.4.2 Cell-SELEX on breast cancer cell lines using protein SELEX libraries ... 54
2.2.5 High throughput sequencing ... 56
2.2.6 Screening of MGB2 and MGB1 aptamers ... 57
2.3 Results and Discussion ... 57
2.3.1 Monitoring the percentage recovery of MGB2 and MGB1 DNA libraries during the selection 57 2.3.1.1 Monitoring the percentage recovery of DNA libraries during protein SELEX ... 57
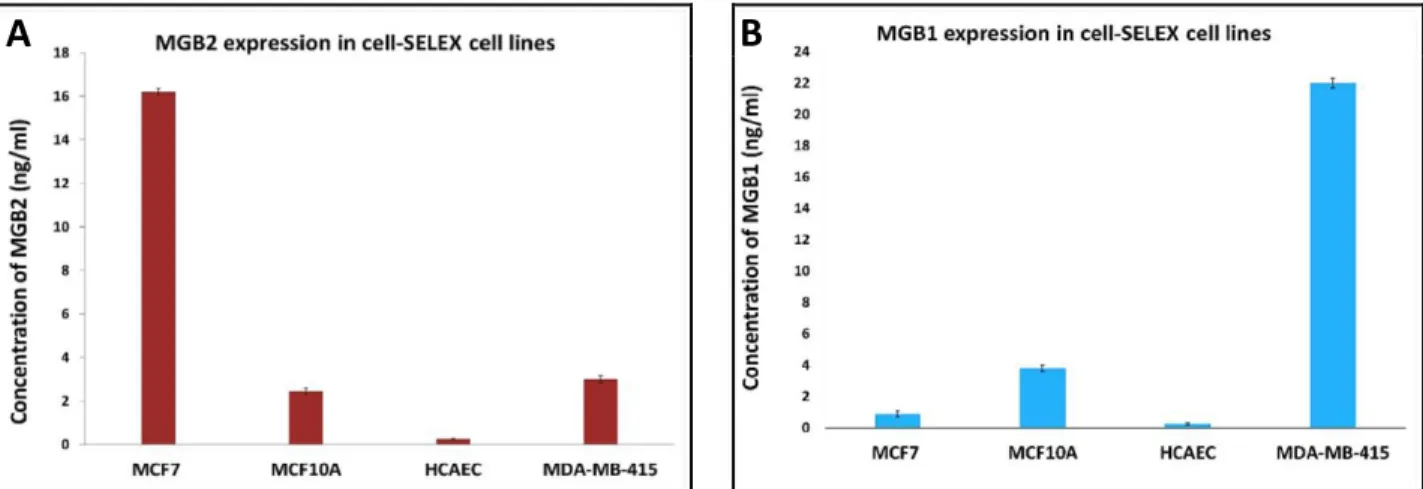
2.3.1.2 MGB2 and MGB1 are exclusively expressed in positive selection cell lines and not in the counter selection ones ... ... 58
2.3.1.3 Monitoring the percentage recovery of DNA libraries during cell SELEX ... 60
2.3.2 Computational and bioinformatics analysis using AptaCluster software ... 64
2.3.3 Secondary structure prediction of the aptamer candidates ... 70
2.3.4 Screening of MGB2 and MGB1 aptamers ... 74
2.4 Conclusion ... 76
References ... ... 77
CHAPTER 3 ... 84
Characterization of MGB2 and MGB1 aptamers and testing their binding to
breast cancer cells in plasma and blood ... 84
3.1 Introduction ... 84
3.1.1 Methods of aptamer binding affinity ... 84
3.1.2 Aptamers interaction to their targets ... 85
viii
3.2.1 Materials and cell lines ... 86
3.2.2 Determination of Kd for MGB2 and MGB1 aptamers using flow cytometry ... 87
3.2.3 Selectivity of MGB2 and MGB1 aptamers... 87
3.2.4 Binding of MGB2 and MGB1 aptamers to their target breast cancer cells by fluorescence microscopy ... 88
3.2.5 Testing the binding of MGB2 and MGB1 aptamers to their target cell lines in human plasma andblood……… 88
3.2.6 Testing the binding of MAMB1 and MAMA2 aptamers to their cancer cell lines in spiked blood……… 91
3.3 Results and discussion ... 91
3.3.1 Determination of Kd for MGB2 and MGB1 aptamers ... 91
3.3.2 Selectivity of MGB2 and MGB1 aptamers to other cancer and normal cell lines ... 96
3.3.3 Fluorescence microscopy results showed high affinity of MAMB1 and MAMA2 to their breast cancer cells ... 96
3.3.4 Binding of MAMB1 and MAMA2 to their target cell lines in plasma and whole blood lysate 100 3.3.5 Binding of MAMB1 and MAMA2 to breast cancer cells in mixture of cells in whole blood lysate 107 3.4 Conclusion and future work ... 113
References ... ... 115
CHAPTER 4 ... 118
Identification of MAMB1 and MAMA2 targets on the surface of breast cancer
cells and protein studies ... 118
4.1 Introduction ... 118
4.1.1 Aptamer target Identification after cell-SELEX ... 118
4.1.2 MGB2 and MGB1 as secretory proteins... 121
4.2 Materials and methods ... 122
4.2.1 Materials and cell lines ... 122
4.2.2 Purification of MAMB1 and MAMA2 targets in cell surface proteins extract of MCF7 and MDA-MB-415 cells by pull-down assay followed by SDS and mass spectroscopy (MS) analysis ... 122
4.2.2.1 Cell lysis and surface proteins extraction ... 122
4.2.2.2 Pull-down assay using MAMB1 and MAMA2 biotinylated aptamers followed by SDS- PAGE and MS analysis ... ... 123
ix
4.2.3 Purification of MAMB1 target in cell surface protein extract of MCF7 cells by pull-down
assay followed by Western blot analysis ... 124
4.2.4 Over expression of MGB2 and MGB1 Proteins in HEK293 cells by transfection ... 125
4.2.5 Studies of aptamer-antibody competition by Flow cytometry ... 126
4.2.6 Protein-aptamer study using electrophoretic mobility shift assay ... 126
4.3 Results and Discussion ... 129
4.3.1 SDS-PAGE and mass-spectroscopy analysis of MAMB1 and MAMA2 after applying pull- down assay on MCF7 and MDA-MB-415 surface proteins extract ... 129
4.3.2 Western blot analysis of MAMB1 after applying pull-down assay on MCF7 surface proteins extract ... .... 130
4.3.3 MGB2 and MGB1 ELISA and transfection results ... 134
4.3.4 Aptamer- antibody competition studies by flow cytometry ... 136
4.3.5 Aptamer complex analysis using EMSA ... 143
... ... 144
4.4 Conclusion and future work ... 145
References ... 146
CHAPTER 5 ... 149
Testing the binding of MAMB1 and MAMA2 aptamers to their target breast
cancer cells using terahertz chemical microscopy ... 149
5.0 Statement of contribution: ... 149
5.1 Introduction ... 149
5.1.1 Terahertz chemical microscopy ... 149
5.2 Materials and methods ... 153
5.2.1 Materials and DNA synthesis ... 153
5.2.2 Preparation of the TCM wafer chips ... 153
5.2.2.1 Cleaning of wafer chips and surface activation ... 153
5.2.2.3 Silanization and aptamers immobilization on the surface of the Wafer ... 153
5.2.2.3 Validation of the immobilization of both aptamers on the surface of the sensing plates 155 5.2.3 TCM scan for the chips ... 155
5.2.3.1 Cells preparation ... 155
x
5.2.3.2.1 Binding of MAMB1 and MAMA2 aptamers to their targets breast cancer cells .... 155
5.2.3.2.2 Studying different number of target cells on MAMB1 and MAMA2 sensing plates using TCM 156 5.2.3.2.3 Selectivity test of MAMB1 and MAMA2 aptamers ... 157
5.2.3.3 TCM sensing plates scanning (imaging) details (Okayama University-Japan) ... 158
5.2.3.4 TCM sensing plates scanning (imaging) details (INRS-Canada) ... 159
5.3 Results and discussion ... 159
5.3.1 MAMB1 and MAMA2 immobilization on the surface of the wafer chips (Okayama and INRS) 159 5.3.2 Okayama University results ... 162
5.3.2.1 Binding of MAMB1 and MAMA2 aptamers to their targets breast cancer cells ... 162
5.3.2.2 Studying different number of target cells on MAMB1 and MAMA2 sensing plates using TCM 167 5.3.2.3 Selectivity of MAMB1 and MAMA2 aptamers ... 173
5.3.3 INRS results ... 176
5.3.3.1 MAMB1 and MAMA2 aptamers bind to their target breast cancer cells using TCM ... 176
5.3.3.2 MAMB1 and MAMA are selective for their target cancer cells ... 186
5.4 Conclusion ... 189
References ... 191
Appendices ... ... 192
Appendix A ... 192
A.1 Fluorescence microscopy images of MAMB1 and MAMA2 binding to other cancer and normal cell lines ... 192
A.2 Transformation and purification results of MGB2 and MGB1 plasmids ... 195
xi
List of Tables
Table 1.1: Characteristics of aptamers versus antibodies ... 13
Table 2.1: Distribution of the four bases in the random region of the starting library (R0) and the
final pools (R30, R13) for MGB2 and MGB1 targets as obtained from bioinformatics analysis using AptaCluster software……….66
Table 2.2: MGB2 and MGB1 sequences and enrichment values ... 96-70
Table 3.1: Mean of fluorescence intensity of cells only (without aptamer) in plasma and whole blood lysate ... 106
Table 4.1: Target identification via whole cell-SELEX against cancer cell lines………..…119
Table 4.2: List of proteins obtained from mass-spectroscopy after pull down assay of MCF7 and MDA-MB-415 cells using MAMB1 and MAMA2 aptamers respectively………130
xii
List of Figures
Figure 1.1: Metastasis cascade ... 8
Figure 1.2: General Scheme of SELEX ... 15
Figure 1.3: The different methods used to measure the dissociation constant (Kd) of aptamer–
protein complexes………...19
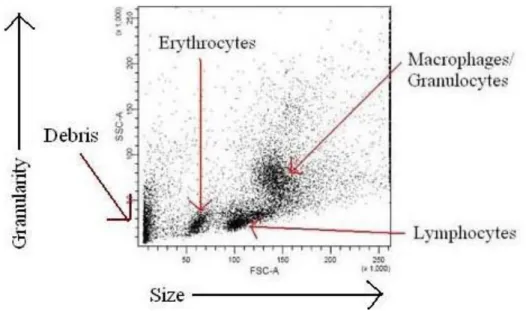
Figure 1.4: A dot plot obtained after running a mixture of blood cells is suspension through a flow cytometer ………….23
Figure 1.5: THz spectrum and the potential applications of THz radiation………….27
Figure 2.1: MGB1 dimer structure………....46
Figure 2.2: Schematic diagram of hybrid SELEX method for selection of MGB2 and MGB1- specific DNA aptamers……….56
Figure 2.3: Percentage recovery of MGB2 (A) and MGB1 (B) libraries monitored using a
fluorolog………..59
Figure 2.4: MGB2 expression of the lysate of all cell lines used in cell-SELEX (MCF7, MCF10A, HCAEC, and MDA-MB-415)……….60
Figure 2.5: Flow cytometry monitoring results of R0, R21 MGB2, R4 MGB1, R30 MCF7 and R13 MDA-MB-415 against cell SELEX cell lines……….. 62-63
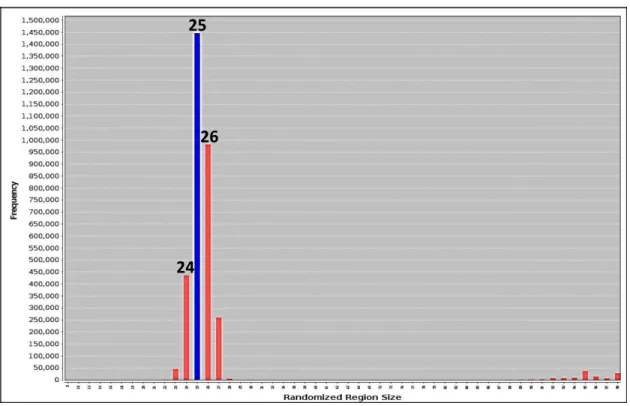
Figure 2.6: Analysis of the random region size of MGB2 last round pool using AptaCluster……65
Figure 2.7: The experimental details of both A: MGB2 and B: MGB1 as showed by AptaCluster software………. 68
xiii
Figure 2.8: The predicted secondary structure of the chosen aptamers of MGB2 and MGB1 using RNAstructure software……… 72-73
Figure 2.9: Screening results of the aptamer candidates against cell-SELEX cell lines……….. 75
Figure 3.1: Binding curves of 6-FAM-labeled aptamer sequences to MCF7 cells (MAMB1 and MAMB12, (left) and the predicted secondary structure of MAMB1 and MAMB12 (right)………94
Figure 3.2: Binding curves of 6-FAM-labeled aptamer sequences to MCF7 cells (MAMA2 and MAMA12, (left) and the predicted secondary structure of MAMA2 and MAMA12 (right)…….95
Figure 3.3: The specificity of MGB2 (A) and MGB1 (B) aptamers to different cell lines…………. 97
Figure 3.4: Fluorescence microscopy images of aptamers MAMB1 and MAMA2 binding to target cancer and counter selection cell lines ………98-99
Figure 3.5: Mean of fluorescence intensity of cancer cell lines vs normal cells (PBMC) for MAMB1 and
MAMA2 aptamers in plasma………. 103-104
Figure 3.6: Mean of fluorescence intensity of cancer cell lines vs normal cells (PBMC) for
MAMB1 and MAMA2 aptamers in whole bloodlysate………...105-106
Figure 3.7: Flow cytometric analysis of the recognition of MDA-MB-415 cells in spiked whole blood
lysate by 6-FAM labelled MAMA2 aptamer……….. 109-110
Figure 3.8: Flow cytometric analysis of the recognition of MCF7 cells in spiked whole blood lysate
by 6-FAM labelled MAMB1 aptamer……… 111-112
Figure 4.1: SDS-PAGE image for MAMB1 and MAMA2 aptamer- purified proteins………131
Figure 4.2: Western blot analysis of MAMB1 aptamer- protein complex after performing pull-down assay on MCF7 surface protein extract………132
xiv
Figure 4.4: microscopy images of HEK293 cells after transfection with GFP plasmid ………..134
Figure 4.5: Binding of MAMB1 and MAMA2 aptamers and MGB2 and MGB1 antibodies to non-transfected HEK293, MCF7, and MDA-MB-415 cells ……….136
Figure 4.6: Competition binding assays of MAMB1, MAMA2 aptamers and anti MGB, anti MGB1 antibodies on transfected HEK293 cells with MGB2 and MGB1 plasmids……….139
Figure 4.7: Competition binding assays of MAMB1, MAMA2 aptamers and anti MGB, anti MGB1 antibodies on transfected HEK293 cells with PUC10 empty plasmids ………140
Figure 4.8: Selectivity test performed on transfected HEK293 cells with MGB2 and MGB1 plasmids ………..141
Figure 4.9: EMSA gels images after electrophoresis……….139
Figure 5.1: Schematic diagram of the terahertz (THz) chemical microscope (TCM) sensing plate and the prototype system………145
Figure 5.2: Using TCM to study antigen- antibody interaction………131
Figure 5.3: Using TCM to detect protein complex………131
Figure 5.4: Fluorescence images of the wafer chips after aptamer immobilization………...158
Figure 5.5: THz peak amplitude mapping for MAMAB1 chip………..159
xv
Figure 5.7: THz peak amplitude mapping of different numbers of MCF7 cancer cells on the surface of MAMB1 sensing plate (first
trial)………...164
Figure 5.8: THz peak amplitude mapping of different numbers of MCF7 cancer cells on the surface of MAMB1 sensing plate (second trial)………....165
Figure 5.9: THz peak amplitude mapping of different numbers of MDA-MB-415 cancer cells on the surface of MAMA2 sensing plate (first trial)………166
Figure 5.10: THz peak amplitude mapping of different numbers of MDA-MB-415 cancer cells on the surface of MAMA2 sensing plate (second trial)……….167
Figure 5.11: THz peak amplitude mapping obtained for MAMB1 and MAMA2 sensing plates after the selectivity test……….169-170
Figure 5.12: THz peak amplitude mapping for MAMB1 and MAMA2 chips at 106 of breast cancer cells………176
Figure 5.13: THz peak amplitude mapping for MAMB1 and MAMA2 chips at 105 of breast cancer cells………177
Figure 5.14: THz peak amplitude mapping for MAMB1 and MAMA2 chips at 104 of breast cancer cells………178
Figure 5.15: THz peak amplitude mapping for MAMB1 and MAMA2 chips at 103 of breast cancer cells………179
Figure 5.16: THz peak amplitude mapping for MAMB1 and MAMA2 chips at 102 of breast cancer cells………180
Figure 5.17: THz peak amplitude mapping for MAMB1 and MAMA2 chips at 10 cells of breast cancer
xvi
Figure 5.18: THz peak amplitude mapping of different numbers of MCF7 cancer cells on the surface of MAMB1 sensing plate………182
Figure 5.19: THz peak amplitude mapping of different numbers of MDA-MB-415 cancer cells on the surface of MAMA2 sensing plate……….………183
Figure 5.20: THz peak amplitude mapping obtained for MAMB1 sensing plate after the
selectivity test ………..……185
Figure 5.21: THz peak amplitude mapping obtained for MAMA2 sensing plate after the
selectivity test ………..……186
Figure A.1: Fluorescence microscopy images of aptamers MAMB1 and MAMA2 binding to
different cancer and normal cell lines ………..…………..……192
Q
List of Schemes
Scheme 3.1: Schematic diagram of the experimental design of plasma and whole blood lysate studies ... 105
Scheme 4.1: Schematic diagram of the experimental design of pull-down assay using MAMB1 and MAMA2 aptamers on cell surface protein extracts of MCF7 and MDA-MB-415 cells
...13 5
Scheme 5.1: The process of Silanization and aptamers (MGB2 and MGB1) immobilization on the surface of the wafer
xviii List of Abbreviations ACS AML APTES ATCC BPE BRCA1 BRCA2 BSA CCS CD45-APC CE-SELEX CEUS CKs CK-PE CPG CRP CSCs CTCs DAPI DCIS DI DMEM Ds ECM EDTA EGFR EGTA EMEM EpCAM ER EMSA EMT FACS FBS FCS FDA FISH FSC GA GFP
American Cancer Society Acute Myeloid Leukemia
(3-Aminopropyl) triethoxysilane American Type Culture Collection Bovine Pituitary Extract
Breast Cancer 1 Breast Cancer 2
Bovine Serum Albumin Canadian Cancer Society CD45-Allophycocyan
Capillary Electrophoresis SELEX Contrast-Enhanced Ultrasound Cytokeratins
Cytokeratin Phycoerythrin Controlled Pore Glass C-Reactive Protein Cancer Stem Cells Circulating Tumor Cells
4′,6-Diamidino-2-Phenylindole Ductal Carcinoma In Situ Deionized Water
Dulbecco's modified Eagle's Medium, double-stranded
Extracellular Matrix
Ethylenediaminetetraacetic acid Epidermal Growth Factor Receptor Ethylene Glycol Tetraacetic Acid Eagle's Minimum Essential Medium Epithelial Cell Adhesion Molecule Estrogen-Receptor
Electrophoretic Mobility Shift Assay Epithelial to Mesenchymal Transition Fluorescence-Activated Cell Sorter Fetal Bovine Serum
Fetal Calf Serum
Food and Drug Administration, Fluorescence In Situ Hybridization Forward Scatter
Gentamicin-Amphotericin Green Fluorescence Protein
xix GNR GST HBSS HCAEC hEGF HER-2 hMAM HTS IDC-NST IGF-1 IHC Kd LCIS LOD LOQ MBC MEGM MET MFI µFFE MGB1 MGB2 MRI MS NAT NGS OPN PAGE PBMC PCR PN PNDA-3 PR PVDF RAN RBCs RT RT-PCR SELEX SDS SLS SPR Ss SSC TBS-T TCM
Gold Nano Rods
Glutathione S transferase Hank's Balanced Salt Solution
Human Primary Coronary Artery Endothelial Cells human Epidermal Growth Factor
Human Epidermal Growth Factor Receptor 2 human Mammaglobin
High Throughput Sequencing,
Invasive Ductal Carcinoma of No Special Type Insulin-like Growth Factor-1
Immunohistochemistry Dissociation Constant Lobular Carcinoma In Situ Limit of Detection
Limit of Quantification Metastatic Breast Cancer
Mammary Epithelial Cell Growth Medium Mesenchymal to Epithelial Transition Mean of Fluorescence Intensity Micro- Free Flow Electrophoresis Mammaglobin A
Mammaglobin B
Magnetic Resonance Imaging Mass Spectrometry
Ni- Nitrilotriacetic
Next- Generation Sequencing Osteopontin
Polyacrylamide Gel Electrophoresis
Primary Peripheral Blood Mononuclear Cells Polymerase Chain Reaction
Periostin
Benzyl-d(U)TP-Modified DNA Aptamers-3 Progesterone-Receptor
Polyvinylidene Difluoride Random
Red Blood Cells Room Temperature Real Time PCR
Systematic Evolution of Ligands by EXponential enrichment Sodium Dodecyl Sulfate
Sodium Lauroyl Sarcosinate Surface Plasmon Resonance single-stranded
Side Scatter
Tris Buffer Saline-Tween
xx TECS-SELEX
THz VEGF
Target Expressed on Cell Surface-SELEX Terahertz
1
CHAPTER 1
Introduction
Some parts of this chapter were reviewed in: Hassan EM, Willmore WG, and DeRosa, MC
Aptamers: Promising Tools for the Detection of Circulating Tumor Cells. Nucleic Acid Therapeutics. 2016
1.1 Breast Cancer
Cancer is a complex disease that originates as a result of multiple genomic mutations leading to a disruption of normal cellular homeostasis. Mutant cells gain unlimited proliferative capacity, the ability to invade surrounding tissues and metastasize, insensitivity to growth signals, sustained angiogenesis, and resistance to apoptosis [1,2]. The main factor behind malignant transformation is genetic mutations by inheritance or acquisition over time due to loss of the DNA repair system [1,2].
Breast cancer is the most common cancer diagnosed in women, with an estimated 1.67 million new cases diagnosed worldwide in 2012 [3]. The incidence of breast cancer is highest in developed countries with a rate of 80 per 100,000 in the European Union and 92 per 100,000 in North America [4]. Breast cancer is the leading incident cancer and second-leading (following lung cancer) cause of cancer death among Canadian women [5]. In 2015, an estimated 25,000 Canadian women were diagnosed with breast cancer. Breast cancer remains to be the most commonly diagnosed cancer in Canadian women, accounting for 26% of all newly diagnosed cancers in women [5].
One of the most important risk factors for developing breast cancer is having a family history of breast cancer [6]. Women with inherited mutations in the Breast Cancer 1 (BRCA1) and Breast Cancer 2 (BRCA2) genes have a lifetime risk of breast cancer of 50%–85% [7,8].
2
Other factors related to the reproductive system such as early menarche, late menopause, and having children have been demonstrated by American Cancer Society (ACS) and Canadian Cancer Society (CCS) to increase the risk of having breast cancer. The increase in risk may be due to a longer lifetime exposure to the hormones estrogen and progesterone [9,10]. Women who were exposed or treated with radiation in the chest, neck, and arm pit area are more likely to develop breast cancer in their lifetime [11,12]. Lifestyle-related factors have been shown to increase the risk of having breast cancer, these factors include: drinking alcohol, being overweight or obese, smoking [13-15], using birth control [16,17], and hormone replacement therapy [18,19].
1.2 Classification of breast cancer
Breast cancer is a disease in which malignant cells are found either lining the milk ducts or in the milk-producing lobules of the breast. Lobules and ducts are formed from three lineages of cells in two germ layers: the myoepithelial layer is common to both structures and forms the basal layer, while ductal epithelial cells line the ducts, and alveolar epithelial cells synthesize the milk within the lobules [20]. Almost all breast cancers (>95%) are epithelial in origin, and are classified as adenocarcinomas [21]. Cancers of the breast are classified according to their histological type (growth pattern) as in situ (cancers which are contained within the breast lobule or duct) or invasive breast cancers (cancers which are not contained by the lobular or ductal walls and have invaded the breast stroma) [21]. Ductal Carcinoma In Situ (DCIS) or Lobular Carcinoma
In Situ (LCIS) are the two most common types of in situ breast cancer. Both are non-invasive
cancerous lesions of the breast and are classified as stage 0. They rarely produce symptoms or breast lumps [22]. Invasive Ductal Carcinoma of No Special Type (IDC-NST) is the most common carcinoma of the breast accounting for 40% to 75% of invasive breast cancers [23]. The cancerous cells invade the surrounding normal tissue and replace them. Special types of breast cancer account for up to 25% of all breast cancers and the latest edition of the World Health Organization classification recognizes the presence of at least 17 different histological special types of breast cancer [24]. Some of the cancers, including tubular, invasive cribriform, medullary, and infiltrating lobular breast cancers have confirmed more favorable prognoses compared with IDC-NST [22,25]. These cancers typically demonstrate rates of 10-year survival that generally exceed 80% [26].
3
On the other hand, other special types of cancer, such as mixed or solid lobular, mixed ductal and lobular, or ductal/NST have shown considerably lower rates of 10-year survival [26].
Breast cancers are further subtyped based on the stage of development, which includes tumor size, where it first started in the body, and the locations to which it has travelled. TNM staging is determined by the collective score on three components, including: tumor size (T), involvement of the regional lymph nodes (armpits, neck, and the chest) (N) and presence of distant metastasis (M) [26]. Breast cancers diagnosed at a later stage (large size and metastasis to lymph nodes and other parts of the body) are associated with poorer prognoses. The four main stages of breast cancers are: stage 0 which describe the in situ types of breast cancers (DCIS and LCIS), stage 1-3: breast cancer spread within the breast or lymph nodes, stage 4: breast cancers spread to different parts of the body [26].
Histologic grade is also strongly linked with breast cancer survival and recurrence. Grading assesses the morphological features of a breast cancer by measuring: a) the degree of differentiation (which reflects how closely they resemble normal breast epithelial cells), b) the tubule formation and nuclear pleomorphism parameters, and c) the proliferative activity by the mitotic index parameter [27]. The Elston-Ellis modification to the Scarff-Bloom-Richardson grading system (Nottingham grading system) is the most commonly used histologic grading system, in which each of the parameters is assigned a score from 1 to 3 [27]. Tumors are considered well-differentiated if the overall score is 3 to 5 (histologic grade I), moderately-differentiated if the score was 6 to 7 (histologic grade II) or poorly-moderately-differentiated if the score was 8 to 9 (histologic grade III). It has been reported that the survival of breast cancer patients was significantly decreased for those with a histologic grade of II vs. I, and III vs. I [28]. Also, rates of disease-free survival were also less for breast cancer patients with a higher histological grade. However this association only reached statistical significance for grade III vs. I [27]. A study by van Diest et al. demonstrated a poorer prognosis for breast cancer patients with a higher mitotic index compared to those with a lower index [29].
4
Breast cancers are further classified by their expression levels of steroid hormone receptors (Estrogen-Receptors (ER) and Progesterone-Receptors (PR)) measured with Immunohistochemistry (IHC), as well as expression of Human Epidermal Growth Factor Receptor 2/neu (HER-2), measured with IHC and Fluorescence In Situ Hybridization (FISH) [30,31]. ER is expressed in 60-80% of invasive breast tumors [22] and over half of ER+ tumors are also PR+ [32]. Less than 10% of breast cancers are ER-/PR+ [32]. The HER-2 oncogene is overexpressed in an estimated 20% of invasive breast tumors [22]. Compared with ER+/PR+/HER-2- tumors, ER-/PR-/HER-2+ and ER-/PR-/HER-2- (triple negative) tumors are more likely to be diagnosed at a later stage and at higher histologic grade [33]. Moreover, triple negative tumors have low rates of overall survival [33,34]. The expression profile of ER, PR and HER-2 receptors direct which molecular pathway affects a tumor, and thus are used to determine the type of endocrine therapy. ER+ tumors depend mainly on ER levels for their growth; therefore they can be treated with drugs to reduce either the effect of ER (e.g. tamoxifen) or the actual level of estrogen (e.g. aromatase inhibitors), and have a response rate of 60 to 70% [35,36]. ER- tumors however have a response rate of less than 10% to hormone therapy [37]. HER-2+ breast cancer patients are treated with anti-HER-2 therapies such as trastuzumab (Herceptin) and pertuzumab which are used in combination with chemotherapy and had been reported to improve the response in HER2+ breast cancers [38,39]. Triple negative breast cancer lacks the expression of the three receptors which make it more difficult to treat because most chemotherapies target at least one of the three receptors. Due to this lack of receptors, triple-negative cancers often involve combination therapies. No specific drug therapy has been identified for triple negative tumors, therefore chemotherapy remains the mainstay in treatment of these cancers [38,40,41].
5 1.3 Metastatic breast cancer
Metastatic Breast Cancer (MBC) (also known as advanced or stage IV breast cancer) is a stage of breast cancer where the disease has spread from the axillary lymph nodes to distant parts of the body (e.g. bones, liver, lung, or brain) [42]. In the US and Canada, approximately 5 and 10% of all breast cancer patients have distant metastases at initial diagnosis, respectively [43,44]. Approximately 30% of women who are first diagnosed with early stage breast cancer will develop MBC later in their lives [43,44]. Metastasis is the main cause of death for the majority of breast cancer patients [45]. In Canada, the five year survival rate of metastatic breast cancer patients is only 20%, as indicated by CCS [5].
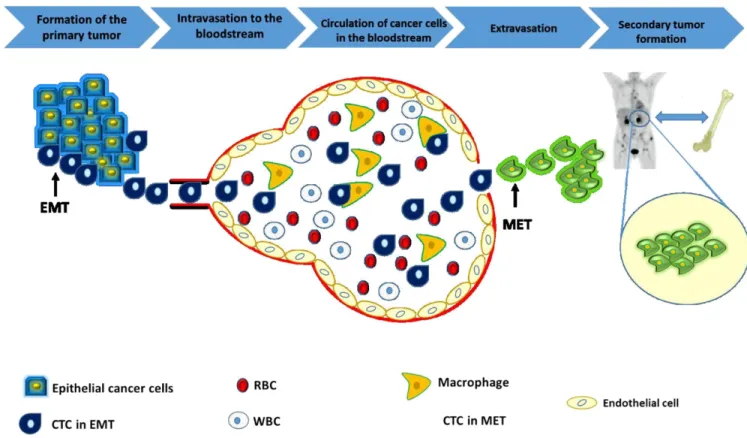
In order to metastasize, breast cancer cells must complete a cascade of events from invasion of local tissues, entry into the blood and colony establishment at distance sites, resulting in the development of a secondary tumor (Figure 1.1). During the initial stages, some of the cancer cells gain invasive properties and leave the primary tumor to intravasate into the blood stream or lymphatic system. Subsequently, the cells circulate through the body in the blood, adhere at the secondary site and extravasate from the circulatory system into the secondary tissue. Cancer cells must then maintain growth in the secondary site to form micro-metastases, which then form macro-metastases (along with the correspondingly associated angiogenesis) at the secondary site [46-48]. The process of metastasis is complex and the localization in a secondary tumor is non-random, usually depending upon the primary tumor characteristics [49] and certain genes that drive the metastatic process [50]. In breast cancer, more than 70 gene signatures have been associated with distant metastasis [51]. Bone metastasis was found in up to 70% of advanced breast cancer patients with osteolytic sites being the most dominant type of metastasis [52].
6
1.3.1 Circulating tumor cells
It is well known that cancer cells are heterogeneous, and thus not all cancer cells are capable of initiating metastasis [53]. Circulating Tumor Cells (CTCs) are cancer cells that detach from a primary tumor, circulate within the blood and then invade other distant organs in the body to form a secondary tumor [53]. CTCs have stem cell-like properties, and thus are capable of initiating the metastatic process (Figure 1.1). In 1994, John Dick and his colleagues were the first ones to isolate and characterize Cancer Stem Cells (CSCs) in Acute Myeloid Leukemia (AML) [54]. They discovered that only a certain population of cells (CD34+CD38−) had the ability to initiate and sustain the leukemia. After isolating CD34+CD38−cells and CD34-CD38-cells and injecting them into NOD/SCID mice, it was observed that only the CD34+CD38− cells developed into leukemia cells [55]. This study was the first spark for the CSC research. Subsequently, there is now evidence supporting the existence of CSC populations in brain, prostate, colon, and pancreatic tumors, as well as in melanomas [56-58]. In breast cancer, CSCs were identified based on high CD44 and low CD24 expression (CD44high/CD24low) on the cell surface. These cells showed CSC properties (self-renewal and the initiation and sustainment of breast cancer growth) when injected into immunocompromised mice [59]. Based on their ability to give rise to tumors, a small subset of CTCs from metastatic breast cancer patients have been reported to have CSC characteristics, and thus all CSCs may be considered CTCs [60-63].
1.3.2 The metastatic cascade: a closer look
Epithelial to Mesenchymal Transition (EMT) was first identified in embryonic development and is the conversion of epithelial cells to a mesenchymal phenotype [64]. CTCs have the ability to initiate the metastatic cascade by converting differentiated epithelial cancer cells into dedifferentiated cells that have more mesenchymal characteristics. EMT is considered a crucial event in the metastatic process (Figure 1.1) [65]. The most important events that take place in EMT are: 1) down-regulation of E-cadherin, which is considered the most dominant cell adhesion protein on the surface of the cancer cell, 2) the decline of the expression of epithelial markers, such as cytokeratin [93], 3) increased expression of vimentin, a mesenchymal marker, and 4) change of the expression of integrin, an extracellular matrix molecule [66,67].
7
During EMT, several signaling pathways control the expression of various factors on the molecular level. The growth factor transforming growth factor-β (TGF-β) has been shown to induce reversible EMT, along with the Wnt pathway proteins (in particular β-catenin), Notch, and Hedgehog signaling pathways. These pathways often act in a sequential manner to induce EMT [68-71]. Furthermore, transcription factors such as Snail and NF-ĸB have been shown to induce apoptotic resistance to tumor cells undergoing EMT [72,73]. The EMT cells break through the basement membrane, blood vessels, or interstitial spaces and start entering the circulation in a process called intravasation (Figure 1.1), allowing them to initiate distant metastasis. It is worth mentioning that intravasation could take place early in cancer development, even before the diagnosis of the primary tumor [74]. In breast cancer, it has been reported that tumor cells start to disseminate out of the primary tumor early in the disease (initial diagnosis), but it is not sufficient for metastatic outgrowth [75].
A solid tumor of 1 cm size (approximately 109 cancer cells) could shed one million cancer cells into the circulation per day [76]. These cancer cells will be carried either via the blood (CTCs) or via the lymph. CTCs do not spend long circulating in the bloodstream. Indeed, most of them are collected by the first capillary bed they encounter within minutes of entering the circulation due their large size and inability to pass through capillaries [74]. It is well known that the majority of secondary tumors are formed in organs that are not connected to lymph nodes (e.g. brain, liver, lung, and bone) [77].
The phenotypic transition of CTCs is reversible and it has been reported that once CTCs reach their destination, they will convert back into an epithelial phenotype in a process called Mesenchymal to Epithelial Transition (MET). This transition is crucial for tumor growth at the secondary site (Figure 1.1) [78]. Little is known about the role that MET plays in the formation of a secondary tumor, but recently researchers have begun to examine MET as one of many potential therapeutic targets in the prevention of metastases [79,80].
8
Metastasis is a complex process and it is unlikely that all cancer cells successfully complete all the steps necessary to form clinically relevant metastases. Therefore, metastasis is described as a highly inefficient process. Few cancer cells pass through all the metastasis steps and finally make it to their destination. From a million cancer cells that escape the primary tumor, only a small number (~0.1%) remain alive in the circulation after 24 h, and an even smaller number of cells (0.01%) could start metastasis [53,81]. Indeed, the majority of CTCs (85%) get washed from the circulations afew hours of intravasation
Figure 1.1: Metastasis cascade: In the first stage, which includes the formation of the primary tumor, cancer cells start to invade a local epithelial tissue and divide there. Some of them (CSCs) have the ability to initiate metastasis and undergo EMT to be considered as CTCs 2: CTCs, which have the properties of CSCs, enter the bloodstream and circulate with the blood components, some of which are eliminated by macrophage cells (part of the immune system). 3: The rest of CTCs will exit the blood in a process called extravasation. 4: After they exit the blood, CTCs undergo MET and start to invade distant organs (in the case of breast cancer, it is most often the bone) forming secondary tumors. (Reprinted with permission from Hassan et al. (2016).
9
CTCs are very rare, with a frequency of typically 1 per 106–7 leukocytes [83]. CTCs exhibit
highly pleomorphic characteristics, and therefore it is difficult to distinguish them from other blood cells [84,85]. Breast cancer CTCs have a diameter of 13.1 μm [86] vs 10 μm for blood leukocytes [87]. To be considered as CTCs, cancer cells must have a nucleus, visible cytoplasm, expression of cytokeratin and absence of CD45 expression [88]. Detection of CTCs in breast cancer patients is commonly associated with an increased risk of metastases and poor prognosis [89]. However, variation of the detection rate of CTCs and its correlation with prognosis has been reported [90]. Although, to date, the use of CTCs as a routine prognostic clinical tool is not applied [91]. Many clinical studies have demonstrated the importance of CTCs in monitoring disease progression or treatment failure. For instance, MBC patients who had a reduction in their CTC count after initial treatment showed identical prognosis to CTC-negative patients [92]. Moreover, patients who had higher initial counts of CTCs and reduced CTC counts following treatment showed better prognoses than those whose CTC count did not change [93]. Other studies failed to observe whether a change in chemotherapy would improve the overall survival rate in breast cancer patients with increasing CTC levels [94].
In summary, there is solid evidence that a sub-population of cells that have stem-cell like properties (CTCs) can contribute to tumor initiation. The functional role of such cells in tumor metastasis such as breast metastasis and treatment remains poorly understood.
1.4 Current methods of the detection and quantification of CTCs
The study of CTCs allows for a better understanding of the metastasis process. In comparison to traditional tissue biopsy, the isolation of CTCs (which has been called “liquid biopsy”) offers many advantages: collection of peripheral blood is easy to perform, the technique is relatively inexpensive with less risk to patients, and it is easily repeatable over time [95,96]. The idea of monitoring CTCs over time (real time) is very attractive to researchers as it allows for the tracking of the changes which occur in cancer cells during metastasis. Isolation of CTCs also allows for better understanding of the metastatic progression, as well as the reasons for the resistance of CTCs to current therapies [95,96].
10
Many methods have been developed to detect CTCs in the blood of cancer patients. Some of these methods are based on the physical properties of CTCs, including density and size, as well as immune and cell-surface electrical properties [97]. Other methods detect CTCs as a result of the interaction of a certain biological probe (e.g. antibody) to a protein (bio-marker) on the surface of CTCs in an instrument such as the CellSearch
®
system.It has been demonstrated that tumor cells exhibit epithelial properties and thus express on their surface molecules of epithelial origin [98]. Epithelial Cell Adhesion Molecule (EpCAM) is expressed in tumors of epithelial origin and allows distinguishing CTCs from blood cells [99]. EpCAM is a transmembrane glycoprotein first identified as a tumor antigen, and is highly expressed in epithelial cancers in comparison to normal epithelial tissue [100]. EpCAM has a role in cell signaling, migration, proliferation, and differentiation [101-103]. It has been reported that EpCAM plays a role in tumorgenesis and metastasis, so it can be used as a prognostic marker and a target for therapy in patients with epithelial cancers [104].
The only system that has been approved by the U.S. Food and Drug Administration (FDA) and uses EpCAM to detect CTCs is the CellSearch system. CellSearch detects and quantifies CTCs in human blood from epithelial carcinomas (breast, prostate or colorectal cancers) using fluorescence microscopy and immunology-based techniques [105-107]. CTCs are enriched and separated from a 7.5 ml blood sample in the CellTracks AutoPrep system by antibody-mediated ferrofluid-based magnetic separation in which monoclonal antibodies against EpCAM are conjugated to iron magnetic nanoparticles to specifically target CTCs. Anti-Cytokeratin Phycoerythrin (CK-PE), a second monoclonal antibody, is used to stain CTCs, followed by the DNA stain 4′,6-Diamidino-2-Phenylindole (DAPI). Blood leukocytes are then separated from epithelial cells by using anti-CD45-Allophycocyan (CD45-APC) [108]. The CellTracks Magnet analyzes the enriched CTCs using the CellTracks Analyzer II, a semi-automated fluorescence-based microscopy system that obtains images using a 10X objective lens, and filters corresponding to the different DAPI, PE, and APC stains [109]. A gallery of CTC images is then created. Qualitative analysis software selects CTCs based on the differential staining method mentioned earlier.
11
EpCAM+, CK+, and CD45- cells are counted as CTCs [108]. Quantification of the actual number of CTCs, as well as assessment of the morphology of CTCs can be accomplished using the CellSearch system. It is difficult to set criteria of what counts as a CTC due to the diversity in their viability or apoptotic stage, which makes their population very heterogeneous [110].
The percentage of CTCs not detected by the CellSearch system is unknown. During the EMT process, the expression of epithelial markers decreases and therefore the expression of EpCAM is not the same amongst all CTCs. For example, some studies showed a change in the level of EpCAM expression in mammary carcinomas [111]. It has been reported that in patients with MBC, CTCs tend not to express EpCAM on their surface, but instead exhibit stem cell features [112]. Moreover some breast cancer subtypes lack the expression of Cytokeratins (CKs) 8/18/19 [113]. A study investigating EpCAM expression in 50 breast cancer cell lines showed that 20% of cell lines had low levels of EpCAM expression [114]. These cells were reported to have a basal-like phenotype, high level of vimentin (a mesenchymal marker) and low levels of epithelial markers CKs 8/18/19 and E-cadherin, indicating a mesenchymal phenotype. Therefore, the CellSearch system would not be efficient in detecting CTCs in those patients. Studies have shown the successful clinical usage of the CellSearch system to monitor the prognosis by counting CTCs in metastatic breast cancer patients, treated for long periods.. The results of these studies confirmed the prognostic value of CTCs, but they failed to evaluate the effectiveness of chemotherapy in those patients [115,116].
In conclusion, the detection of CTCs specifically in MBC, is a challenge due to a) their low abundance in the blood stream and b) the lack of reliable markers present to recognize these cells. Therefore, new markers are still required for the detection and isolation of different sub-types of tumor cells in MBC with high specificity and sensitivity. Moreover, increasing the sensitivity and specificity by investigating new ligands other than antibodies is required and this represents the central topic of this thesis.
12
1.5 Aptamers as powerful ligands in the detection of CTCs in metastatic breast cancer
1.5.1 Aptamers
Aptamers were described for the first time in 1990 [117]. They are non-natural, short (∼ 15–100 nucleotides in length) single-stranded DNA or RNA oligonucleotides that bind to their targets with high affinity and selectivity, with a unique three- dimensional interaction [118].
Aptamers can replace their antibody counterparts due to their similar recognition properties [119]. Aptamers are chemically synthesized at a relatively low cost, without the use of animals, which are required for antibody production [119]. Because of their chemical and thermal stability, aptamers can be used under a wide range of experimental conditions; unlike antibodies which are restricted to their host conditions, rapidly losing their tertiary structure at higher temperatures. Antibodies have batch-to-batch variations, whereas aptamers do not. In addition, the modification (labeling for proteins) can affect the structure and the function of antibodies while aptamers, when synthesized, allow for the introduction of functional groups on specific sites without the disruption of their structure or function [120]. As mentioned earlier, aptamers can be selected against a wide range of targets with different sizes and structures, whereas the affinity of antibodies is limited to those molecules that can trigger immune responses [121]. The first RNA sequence that could discriminate between different targets was the one that binds to theophylline, with 104 times higher binding affinity to theophylline than to caffeine, which differ
by only a methyl group [122].
Recently, slow off-rate modified aptamers (SOMAmers) were established by Brody et al. These new aptamers were capable of binding to their protein targets with very high affinity (in the very low nanomolar range and with picomolar dissociation constants) and have been tested in clinical samples [123]. Table 1.1 summarizes the different properties that aptamers have versus antibodies [118, 120].
13
Table 1.1: Characteristics of aptamers versus antibodies
Properties
Aptamers
Antibodies
Stability Stable at wide range of
Stable only at certain temperatures
temperatures (reversible
denaturation)
Target Potential Wide range of targets from The targets are limited to mostly ions to bacteria or whole proteins/peptides
mammalian cells, also non- immunogenic or toxic targets
Immunogenicity Not recognized by the immune The immune system reacts against system due to their small size them due to their size
Production Produced via in vitro process Produced in vivo with the need of
animals or cell culture
Shelf life Long shelf life due to the Short shelf life due to in-
stability of aptamers (when stability, since they are limited to dried they can stay at room their host conditions
temperature)
Ability to be Easy to chemically modify at Difficult to chemically modify and Modified relatively low cost expensive
Nuclease Subject to nuclease Nucleases cannot degrade Degradation degradation antibodies, since they made of
but can be overcome
amino acids
with modification
14
1.5.2 Systematic Evolution of Ligands by EXponential enrichment
Aptamers are produced in vitro in a process called Systematic Evolution of Ligands by EXponential enrichment (SELEX). Aptamers can be selected for a wide range of targets, starting with ions and ending with whole mammalian cells [124-127]. Therefore, SELEX can be performed against different targets, with different conditions according to the researcher’s needs. Many improvements to SELEX have taken place since the original SELEX was established in 1990 to select aptamers with higher affinity and selectivity to their targets [128].
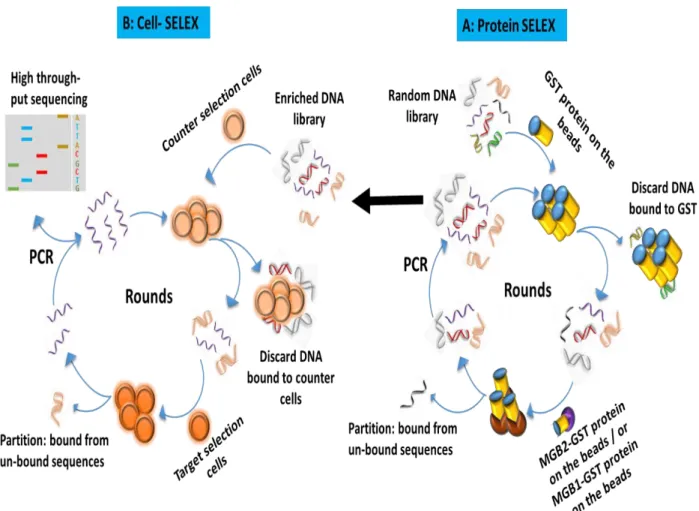
In general, SELEX has multiple steps (Figure 1.2). The first step is the selection step, where the target, which is either immobilized on a solid support or is free in solution (according to the final application of the selected aptamers), is incubated with a random library of DNA or RNA (depends on whether the application needed DNA or RNA aptamers). This library is flanked with two conserved primer binding sites to be used later for amplification. The number of random sequences in the library can be 1013-1016 (Figure 1.2). In thesecond step, partitioning of the
nonbinding sequences from those that bound the target takes place. Nonbinding sequences are washed away, and the sequences which bound the target are eluted in the third step. The amplification of the eluted sequences takes place using the Polymerase Chain Reaction (PCR), using the conserved regions of the randomized library for primer-binding (Figure 1.2). The selection process can be repeated several times (rounds) until the percentage recovery of the DNA (monitored during the selection) reaches a plateau. Usually a counter selection of a similar target takes place after or before the main selection to ensure the specificity of all the selected aptamers for the target of interest [129]. Throughout the selection process, it is recommended to increase the stringency to improve binder enrichment in the library thus generating higher affinity aptamers. This increased stringency can be achieved by decreasing the target concentration to encourage competition, changing the ionic strength of the binding and washing buffer or/ and increasing the number of washing steps for the unbound sequences [129].
15
1.5.3 Cell- SELEX
The idea of using complex targets for the generation of specific aptamers was first suggested in 1998 [130]. This idea was confirmed when an aptamer against red blood cell membranes was identified in 2000 [131].
Figure 1.2: General Scheme of SELEX: SELEX starts with counter selection step (A) in which a random DNA libraryis incubated with a target similar to the target of interest. The unbound sequences (from washing step) are then incubated with the target of interest for the positive selection (B). Unbound sequences are washed off and binding sequences are eluted off the target. The eluted sequences are amplified by PCR, and the rounds are then repeated.
At that time, the application of aptamers for cancer detection was limited due to the absence of aptamers able to bind target cancer cells, or target proteins on the cell
16
surface [132]. Cell- SELEX technology offers many advantages over other types of SELEX: 1. A prior knowledge of the protein receptors on the surface is unnecessary since the generated aptamers will recognize the molecular features only on the abnormal cells. Moreover, the aptamers bind to the native state of the targets. In this manner it is important to mention that a counter selection is an important step in cell-SELEX. In the case of cancer cell-SELEX, the ideal counter selection should be normal cells from the same type of tissue i.e. breast cancer cells vs healthy normal cells surrounding the cancer cells [132]. 2. Multiple aptamers can be selected for many different targets and thus provide accurate diagnosis of the disease (e.g. cancer) [132]. 3. The generation of new aptamers to unknown targets on the surface of the cells help to identify new biomarkers. Cell-SELEX for cancer may serve to improve the understanding of many complicated processes that occur during the development of cancer including metastasis [132].
The cell-SELEX procedure is similar to that of conventional SELEX, but differs in the partitioning step, in which washing or centrifugation is used to separate the bound from unbound sequences. In cell-SELEX, heating is usually used for isolating aptamer-target cell complexes [133]. Despite the short history of cell-SELEX, it has become a promising platform for generating large numbers of aptamers against a wide range of cell lines, especially cancer cells [132]. Although considerable progress has been made, cell-SELEX is still facing many challenges. One challenge is the complexity of the cell-SELEX process, as selection for whole cells takes many rounds (up to 35) to identify the aptamer candidates, which is time consuming and labor intensive. It is hard to see a significant enrichment for the starting library [134]. Another challenge for cell-SELEX is the diversity of the ligands on the cell surface.Althoughthis diversity increases the chance of identifying new bio-markers, it affects the progression of the SELEX process as aptamers prefer to bind the more abundant targets (common targets on all cells types) versus the low abundance ones. If the more abundant targets were not the desired ones, this might affect the enrichment of the aptamers [132]. The abundance of such targets (e.g. membrane proteins) may change during the cell growth and passages, therefore cell culture maintenance is important for cell-SELEX [132]. Target identification after cell-SELEX is necessary in order to use these aptamers in further applications, especially the ones selected against cancer cell lines [133].
17
This step is a serious limitation due to the difficulties in the separation and purification of aptamer targets, especially the membrane protein targets [133]. For this reason, a limited number of aptamer targets have been identified [135-138].
In order to overcome these challenges, many modified cell-SELEX platforms have been reported [139-142]. One of the reasons behind the variations in enrichment in cell-SELEX is the contamination from dead cells. Dead cells tend to adsorb non-specifically to single-stranded nucleic acids and thus reduce the enrichment factor of the positive selection step [143]. Fluorescence-Activated Cell Sorting (FACS) has been reported to eliminate the dead cells from a mixture of cells [144]. Raddatz et al. used FACS for the positive selection step to eliminate dead cells and successfully identified DNA aptamers against Burkitt lymphoma cells [144]. FACS separates distinct subpopulations of cells from other subpopulations within composite cell mixtures. For example, live and dead cells could be separated on the basis of their different light-scattering characteristics, or their ability to convert cell-permeable dyes into a fluorescent form enzymatically [145]. It is hard to maintain the activity of cells over long periods of time, and thus different cells may be used for selection in different rounds in cell SELEX. In cancer cells for example, variations between cells could affect the SELEX process, as cancer cells are heterogeneous. Microfluidic systems have been integrated into cell-SELEX to shorten the selection process and make it more efficient [146]. An automated on chip cell-SELEX has been demonstrated. In this system, the entire cell-SELEX is performed on a single chip. In order to achieve this, three modules, including a microfluidic control module, a magnetic bead-based aptamer extraction module, and a temperature control module for cooling reagents and rapid nucleic acid amplification have been used [147]. It has been reported that on chip cell–SELEX has been successfully used in the identification of aptamers against ovarian cancer; these aptamers binds to target cells specifically with high affinity [148].
Targeting of specific cell surface proteins in their native forms using cell-SELEX helps to take the application of cell-SELEX even further, especially in cancer research where identifying new biomarkers is a great benefit to improve the diagnosis and treatment of cancer patients. This part of cell SELEX will be discussed in detail in chapter two as a core topic.
18
1.6 High throughput sequencing and aptamer characterization
Integration of High Throughput Sequencing (HTS) or Next- Generation Sequencing (NGS) methods in SELEX is of great benefit, due to the many advantages that it provides compared with traditional cloning/sequencing methods. Using traditional methods, sequences from enriched nucleic acid libraries are cloned into a plasmid and a few hundred individual clones, at most, would be sequenced to identify individual high affinity aptamers [149,150]. HTS allows for sequencing of millions of DNA strands in parallel, yielding substantially more throughput and reducing the need for the cloning method [150]. Cloning is typically applied only after the last selection round, where as HTS can be applied to the nucleic acid libraries after each selection round, thus avoiding the need for a high number of selection rounds, reducing time, PCR bias and artefacts [150]. Comprehensive characterization of obtained aptamers, identification of their functional and rare motifs, and a comparison of functional motifs in each oligonucleotide population along with quantification of their abundance can be done by combining HTS to bio-informatics tools and powerful software
[151]. HTS has contributed noticeably to in vitro selection techniques as in many other research fields, including personalized medicine [152]. HTS was first combined with SELEX in 2002 in a SELEX-SAGE method in which CTF/NFI transcription factor (TF) ligands were identified in genomic DNA [153]. Many improvements have been made on HTS in the following years to identify many targets [154-156]. Recently HTS was combined with whole cell SELEX and applied to identify DNA aptamers targeting the HER2 receptor in breast cancer patients [157]. In this work, they applied HTS after each round of selection, reducing the number of rounds to only five and increasing the specificity and affinity of the identified aptamers [157]. Many software tools are now available to analyze HTS data, including AptaCluster [158] and FASTAptamer [159].
The Dissociation Constant (Kd) describes how tightly a ligand binds to its target under
equilibrium conditions. For aptamers, the Kd is the concentration of aptamer at which the
concentration of target with aptamer bound equals the concentration of target with no aptamer bound [160,161]. Kd reflects the affinity of the aptamers to their targets and has a molar unit when
the binding stoichiometry is 1:1. The smaller the Kd, the higher the affinity [160,161]. The Kd of
19
[162]. Several methods have been established to measure the Kd of aptamers [163]. The methods
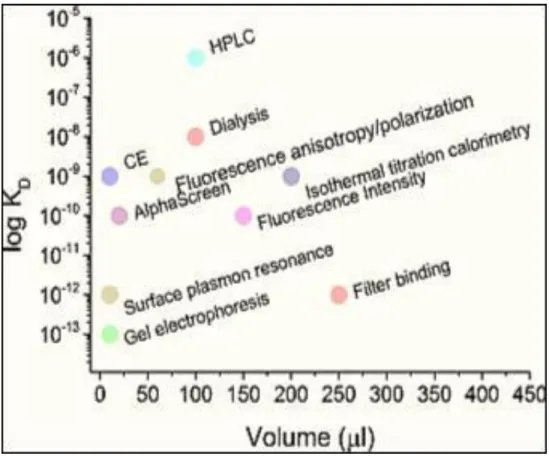
range from simple, low cost methods such as dialysis and filter binding assays, to complicated ones such as Fluorescence anisotropy and Surface Plasmon Resonance (SPR) [164,165]. Figure 1.3 shows the most popular methods used for aptamer affinity determination. These methods vary in their sensitivities and the sample volume needed for analysis, as well as the analysis time required. Moreover, the post-selection labelling or immobilization of the aptamers in these methods could affect the value of Kd [161]. Thus a particular aptamer could have many values of
Kd considering the factors above when applied to different methods of Kd determination.
Therefore, it is recommended to use the method that most closely simulates the circumstances in which the aptamer is planned to be used [161].
Figure 1.3: The different methods used to measure the dissociation constant (Kd) of
aptamer–protein complexes. The graph shows the Kd values with the respective
methods as a function of the volume required for the analysis. Reprinted with permission from Szeitner et al.[161].
20
1.7 Aptamers generated for the detection of metastatic breast cancer and breast CTCs
As mentioned earlier, aptamers can rival antibodies in their specificity and affinity for the target [166], therefore, they are good candidate probes for capturing CTCs in the bloodstream [167] The overexpression of surface biomarkers is often related to tumorigenesis [167], therefore cell surface biomarkers are attractive targets for cancer diagnosis including CTCs detection [166,167]. As mentioned earlier, EpCAM is the most abundant protein reported to be overexpressed in patients with epithelial carcinomas [99]. Moreover, it has been reported that EpCAM is a biomarker for CTCs in these patients as it can be used to distinguish between cancer cells in the blood and other blood cells [99]. Although it has been reported that EpCAM expression changes during EMT process (as mentioned earlier in this chapter) and might be absent in some breast cancer patients [111,112,114], many studies have been developed using aptamers against EpCAM to detect CTCs in a mixture of cancer cells [168-170]. In a study by Song Y et al. a DNA aptamer (SYL3C) against EpCAM protein was successfully selected and used to capture CTCs [171]. SYL3C has a high affinity to the metastatic form of breast cancer cells (MDA-MB-231) in vitro [171]. Moreover, SYL3C was able to capture the target cancer cells from a mixture of cancer cells with up to 63% cancer cell capture efficiency and about 80% purity [171].
Human Periostin (PN) is a protein produced and secreted by fibroblasts as a component of the Extracellular Matrix (ECM) [172]. PN is a very interesting protein, as it has a role in the interaction with multiple cell-surface receptors, particularly integrins [173,174] or with the PI3-K/Akt pathway which when activated, stimulates cell survival, angiogenesis, invasion, metastasis, and more importantly, epithelial-mesenchymal transition of carcinoma cells [175,176]. In breast cancer, the overexpression of PN is correlated with the poorest outcomes [172]. Characterizing PN functional roles in breast cancer progression could improve the outcome of breast cancer. Benzyl-d(U)TP-Modified DNA Aptamers-3 (PNDA-3) were selected against PN [177] PNDA-3 inhibits periostin-mediated breast cancer cell invasion in vitro and metastasis in vivo [177]. PNDA-3 aptamer could be used to target metastatic breast cancer cells [177].