SCALES AND OBJECTIVES FOR UNDER-FREQUENCY LOAD SHEDDING
Barnabé POTEL, Vincent DEBUSSCHERE Florent CADOUX Leticia DE ALVARO GARCIA Univ. Grenoble Alpes, CNRS Fondation Partenariale de Grenoble INP Enedis, France
Grenoble INP, G2Elab, Grenoble, France G2Elab, Grenoble, France [email protected] [email protected] [email protected]
ABSTRACT
To prevent black-outs due to over-consumption, electrical power systems usually rely on under-frequency load shedding (UFLS). In France, it is implemented by disconnecting pre-selected MV feeders from the distribution system. The feeders taking part in the UFLS scheme are chosen according to a specific objective in terms of total amount of power to be shed. Various ways to define and calculate this objective may be considered. This is particularly true when a significant distributed generation (DG) capacity is present and must be considered in the UFLS scheme. This article studies how the choice of the definition, and means of calculation, of the objective impacts UFLS performance – the production from the DG may be such that the local objective to shed becomes negative. This analysis is based on the real consumption data of all MV feeders from six French regions, provided by the main French DSO, Enedis.
INTRODUCTION
To prevent total black-outs due to large generation-consumption unbalance, the defence plan of the electrical power systems (EPS) usually implements an under-frequency load shedding (UFLS) mechanism. The UFLS automatically disconnects loads from the EPS in order to restore the generation-consumption balance. This unbalance determines the evolution of frequency. To realise this automatic disconnection, in France, the substations are equipped with under-frequency relays which are programmed to disconnect pre-chosen MV feeders when frequency reaches specific thresholds. These feeders are allocated to a step of the UFLS scheme once a year by the DSO. The purpose of this re-allocation is:
- To update the scheme according to new local constraints (e.g. not to shed priority users as hospital, government facilities, etc. [1]).
- To reassess whether the total “weight” of each UFLS step does match the objective to shed.
This objective was historically defined as a ratio of the distribution system load as the under-frequency relays are located only there: each step of the UFLS had to shed 20% of load of the DSO.
The Network Code on Emergency and Restoration (NC-ER) [2] – which entered into force in December 2017 – redefines the framework of the UFLS schemes across Europe. Especially, the load to shed (i.e. the objective) is now defined as a ratio of the total load at the national
level. This total load is defined as a net demand seen from a given point of the EPS. With the increase of the distributed generation (DG), the choice of a given point has an impact on the amount of load which can be shed – the proposition of using the feeder as the given point is proposed in [3].
The purpose of this paper is to quantify this impact by calculating the evolution of the net demand at different levels from two different given points: the feeder and the substation. The considered levels are varying from feeder to a 6-regions aggregation via substation and “department” (French administrative subdivision).
This paper is organized as follows. The first section deals with the principle of the UFLS, the structure of the French EPS and the various notions of consumption which can be considered in the objective of the UFLS. The second part investigates the influence of the point of calculation on the objective. The two objectives are calculated at different levels to confirm the proper functioning of the UFLS in the case of a large insertion of DG.
UFLS PRINCIPLE AND OBJECTIVE CALCULATION
The “swing equation”
The aim of the UFLS scheme is to shed consumption in order to restore the power balance. The power imbalance is proportional to the first time derivative of frequency, commonly named “rate of change of frequency”:
- If generation is higher than consumption, frequency increases.
- If consumption is higher than generation, frequency decreases – the UFLS can trigger under such a case. This evolution is ruled by the swing equation (1):
f is the frequency of the EPS (Hz). f0 is the nominal frequency (Hz).
Pm is the mechanical power from the synchronous
machines (W).
Pem is the electromagnetic power from the
synchronous machines (W).
S is the rated power of the machines (VA). H is the inertia of the EPS (s).
With f the frequency and p the unbalance between production and consumption – both in p.u. According to (2), shedding a share of the national consumption allows to control the evolution of frequency.
Commonly, dynamic simulations are realized using a model of the EPS or by using directly this equation (which is easier to implement) [4]. Various scenarios with different unbalances and different UFLS schemes are simulated to determine which scheme leads to the most robust response.
Rated power and net demand
When the NC-ER defines a load to shed as a ratio of a national consumption, this national consumption is represented by the rated apparent power S. This rated power can be defined as the total generation of the EPS. Its value depends on the considered inertia. For example, it is possible to make the distinction between the synchronous generation which increase the stored energy H*S (kinetic energy) and the non-synchronous generation which just increase S without adding kinetic energy.
Adding power generation from non-synchronous machine – like photovoltaic generation – can be seen as an increase of the rated power S and a corresponding decrease of the inertia value H, in order to keep constant the product H*S which represents the kinetic energy stored into the rotating machines connected to the EPS. We do not introduce and use the notion of virtual inertia which could be created from non-synchronous generation in this paper. This definition of rated power includes every types of generators. It can be quantified by retrieving data from
meters and simulating the ones without (typically small-power DGs).
Table 1 presents a NC-ER compliant UFLS scheme for Continental Europe, composed of six steps shedding each 7.5% of the national load to stop the unbalance.
However, these percentage values are expressed as a ratio of a reference of power, and the definition of the latter is important and not obvious. According to the definition provided in the Article 3 from the NC-ER, the load is specified as a ‘net demand’: “‘net demand’ means the net value of active power seen from a given point of the system, computed as (load — generation), generally expressed in kilowatts (kW) or megawatts (MW), at a given instant or averaged over any designated interval of time”
The choice of using a net demand from a given point of the system is a different definition from the rated apparent power S used in the swing equation.
The French implementation of the UFLS
To determine which given point of the system should be used, the overlapping cells constituting the French EPS is described in Fig. 2. These cells will be used to study the method of calculation of the new rated power Pr.
The national cell is composed of the distribution system and large industrial electricity consumers (transportation, industrial chemistry, etc.) which are directly fed through the transmission system and do not take part into the UFLS scheme.
The distribution system is divided into regions. In France, the load shedding is technically realized only at this level of granularity (where under-frequency relays are deployed). The regions are divided into departments (typically 3 to 5). A region is an operated management cell
for the DSO. The departments contain primary substations. The UFLS is implemented at this level and includes local constraints such as priority users that shall not take part into the UFLS scheme.
The primary substations are the operated cell of the DSO, where the under-frequency relays are located. It is at this scale that the DSO decided which MV feeders should be disconnected in order to fit with the local objective of the department.
The under-frequency relays are automated. Their parameters are set once a year. It consists in choosing for each step, which MV feeders are disconnected when the frequency will reach the specific thresholds.
From this structure, there are two levels which could be used to consider the net demand to shed:
- the substation; - the feeder.
Indirectly, they correspond to the TSO’s point of view (substation) and the DSO’s point of view (feeder), respectively. Historically, the consumption of a substation corresponded to the sum of the consumptions of the feeders.
The consumption of a MV feeder
The consumption of a MV feeder is composed of typical loads, such as residential or industrial customers. But, as the penetration rate of DG is increasing, the feeders are not composed only of loads but also of generation units. Thus, three types of feeders are differentiated:
- Feeders only composed of consuming loads: net consumption = gross consumption.
- Feeders only composed of generation units, called dedicated feeders. They are excluded from the French UFLS.
- Feeders composed of loads and generation units: net consumption = gross consumption - local production, these are mixed feeders.
Currently, it is considered that around 65% of the DG capacity is deployed into dedicated feeders – and 35% is deployed into mixed feeders [5].
Rated powers
To calculate the two rated powers from the substation’s point Pr,s and the feeder’s point Pr,f, a new distinction of the rating power is done: not as synchronous and non-synchronous generations, but from the transmission and distribution systems generations as shown in Fig. 3.
The TSO generation corresponds to the national generation (local generation), excluding exports but including imports. The DSO generation corresponds to the DG deployed in dedicated and mixed feeders.
The corresponding rated powers, as shown in Fig. 3, are:
These rated powers may be used to calculate the corresponding power-unbalance:
Impact on the inertia and the rated power
Considering that the DG from the distribution system is not taking part into the rated power is equivalent as seeing this DG as a negative consumption. Shedding such DG increases the inertia constant of the system. As they are mainly composed of inverters, they do not provide power in the form of kinetic energy or another energy source to create virtual inertia. Thus, the equivalent inertia of the system would increase. Nevertheless, the simulated frequency response of the system may be different depending on the consideration of this DG in the rated power in the studies.
APPLICATION TO A PART OF THE FRENCH SYSTEM
Example of feeder’s consumption
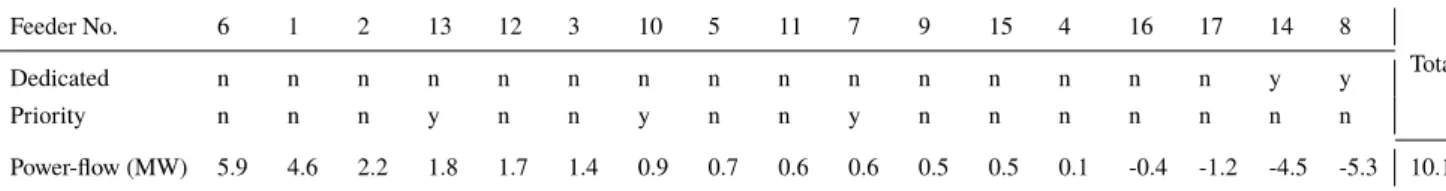
Table 2 shows the power-flows of the feeders of a substation at a chosen instant. This substation is composed of 17 MV feeders.
From these 17 feeders:
- 2 are dedicated for production
- 3 are composed of priority users that cannot be shed - 2, not dedicated, have a negative power-flow (for the
chosen instant)
The active powers of the substation are: - 21.5 MW gross consumption
- 19.9 MW consumption Pr,f of the substation, which is calculated by subtracting dedicated feeders to the gross consumption
- 18.2 MW available load to be shed (from the non-dedicated and non-priority feeders): Pallocable
- 10.1 MW “net” consumption which is the Pr,s of the substation.
Example of substation’s consumption
Table 3 shows the rated powers Pr,fand Pr,sat a specific time instant of the year 2016 for the substations of a chosen department. The chosen department includes a significant amount of DG and is not representative of the average
department in France.
The studied extract of database used in this article contains 19 substations. From those 19 substations:
- 6 substations are sending back power to the transmission system at the considered instant (their corresponding Pr,sare negative); one of this substation has a negative Pr,f: DG on mixed feeders is producing more than the consumption on the only-consuming and mixed feeders.
- 7 substations have the same Pr,s=Pr,f (no observable feeder with a negative power-flow at this instant). - The rated powers of the department are Pr,f =220.2MW
and Pr,s =139 MW-48.9 MW = 90.1 MW.
From this example, the DSO can see that there is at least 130MW more consumption that can be observable in its system, by choosing the feeder level to calculate the net demand. This consumption does not appear in the injection from the TSO at the substation level, as it is compensated by local DG.
Evolution in time of the rated powers
Fig. 4 shows the time-evolution of the rated powers Pr,s
and Pr,f and the allocable consumption Pallocable. These evolutions are shown at different levels of the EPS: the department initially considered, the corresponding region and the aggregation of the six regions (data provided by Enedis, the French main DSO). Table 4 shows the average values of these powers.
At the department scale, the rated power Pr,s, calculated from the net demand at the substation point, reaches negative values: it means that during some period of the year, the distribution system, in this department area, is feeding back power to the transmission system. With the definition of the rated power Pr,f which excludes the dedicated MV feeders, the objective remains positive. Averagely, during the whole year, the rated power calculated from the substation point is 30% less important than the one calculated from the feeder point.
At the region scale, the rated power Pr,s has still large variations but it remains positive all along the year. The
average difference between the two rated powers is now 13%.
For the six-aggregated regions, the impact of the DG is negligible: the two rated powers are equivalent (3% difference). Thus, considering a large EPS with DG implemented only in few parts, the proper functioning of UFLS is not challenged. Nevertheless, as the DG is expected to increase in a significant way for the next years/decades, it is essential to choose the appropriate point of calculation for the UFLS to avoid a negative rated power.
For the three considered levels, the allocable consumption is representing ~76-79% of the rated power Pr,f with similar variations. It is because of the priority users which are deployed uniformly in mixed and only-consuming feeders.
Limits of the study
As presented in Fig. 2, the consumption within the distribution system (through the feeders) represents only a part (~75% [6]) of the whole French EPS consumption. The net demand fom the large consumers directly fed by the transmission system should be added into the calculation of the rated power.
As there are no under-frequency relays deployed for these large consumers, it is necessary to insure that the allocable consumption from the distribution system is still enough to shed the cumulative ratio of net demand from Table 1: 45% of the chosen objective (rated power). Another possibility would be to implement load shedding also to the consumers directly fed by the transmission system.
CONCLUSION
The evolution of the UFLS schemes in Europe, driven by the NC-ER, gives an objective of shedding a ratio of the national load for every country. Such an objective derives from the swing equation commonly used to study the UFLS performances. This equation involves the equivalent inertia and a rated power (corresponding to the total load). The values of these quantities are not explicit, even more considering the DG. The NC-ER defines the total load as a net demand from a given point of the EPS. In this paper we quantify this net demand at the substation:
Pr,s and at the feeder excluding the DG which is located into generation-dedicated feeders: Pr,f. These two definitions are applied to different parts of the French EPS: from a substation to an aggregation of six-regions. The calculations show that, some power-flows of the initially considered substations may be negative: the DG is such that the distribution system feeds power back to the transmission system. Thus, for the corresponding department, the rated power using the substation as the calculation point – Pr,s – reaches negative values during
some periods of the year. As a part of the DG is excluded from the rating power Pr,f, the latter remains positive. The impact of the DG is more limited when considering a larger scale. The difference between the two defined objectives Pr,f and Pr,s is reduced from 30% at the department level to few % at the 6-regions aggregation. If a significant number of DG would be installed into
pre-existing MV feeders with consumption, an optimised choice of the feeders taking part into the UFLS scheme should be done to keep a proper functioning of the UFLS by insuring to have a positive objective to shed and enough allocable consumption to reach the cumulative ratio of it. For extreme cases of high-insertion of DG into pre-existing feeders, others solutions need to be investigated as changing the operated cell to a downstream part of the feeder (e.g. at the MV/LV transformer level).
ACKNOWLEDGMENTS
The work reported in the paper has been developed in the framework of the Enedis Industrial Research Chair on Smart Grids.
REFERENCES
[1] Arrêté du 5 juillet 1990 fixant les consignes générales de délestages sur les réseaux électriques [Ministerial Decree of the 5th July 1990 setting the general rules of load shedding of electrical power systems]. [2] ENTSO-E. Network Code on Emergency and
Restoration, 2017.
[3] VDE, "Technische Anforderungen an die automatische Frequenzentlastung" [Technical Requirements for Frequency Load Shedding], Technical Note, FNN, Jun 2012.
[4] ENTSO-E. "Technical background for the Low Frequency Demand Disconnection requirements", Nov 2014.
[5] O. Arguence, 2018, "Modélisation des ilots non-intentionnels et caractérisation des méthodes passives de détection d'ilotage" [Modeling of non-intentional islanding and characterization of passive islanding detection methods] Doctoral dissertation, Université Grenoble Alpes.
[6] Commission de régulation de l'énergie (2007). Rapport d'enquête de la commission de régulation de l'énergie sur la panne d'électricité du samedi 4 novembre 2006 [Report of the electrical blackout of the 4th November, 2006].