Study of the Uncertainties Influencing the Energy
Performance Assessments of Two Very Different Urban
Houses in Wallonia
S Monfils1, J-M Hauglustaine1
1Energy and Sustainable Development, Department of Environmental Sciences and Management, University of Liege, 185 Avenue de Longwy, 6700 Arlon, Belgium Stephane.monfils@uliege.be
Abstract. Implemented by the European EPB directives, the Energy Performance Certification has
been designed by authorities to “provide clear information about the energy performance of a building”. Studies led in Wallonia show however that official results are often too distant from reality and difficult to understand for the lay person. This paper focuses on the comparison between two certified old urban brick single-family houses in the Walloon residential stock: a highly efficiently renovated “exemplary building”, described in detail, versus an inefficient and poorly described second house. After presentation of the case studies, this paper will investigate the uncertainties that surround the description of the “energy systems” and the standardized calculation method. This research explores the possibilities of elevating the confidence in the certification results by adding information on the description of the envelope and systems, by re-integrating the human factor in the equations (through a questionnaire collecting by interview the dwellers’ energy-related behaviours and practices), and by using dynamic simulations. The comparison of the results to the official standardised results indicates that additional data on the household’s composition, practices and energy-related behaviours are as much needed as a more accurate description of the energy system, which is penalized by default values and a severe standardisation of the calculation method.
1. Introduction
The EPC (Energy Performance Certificate) has been designed by authorities to “provide clear information about the energy performance of a building”, in order to influence the real-estate market by bringing the general public to integrate energy into their dwelling decision-making processes, promote energy performance improvements and help build up comprehensive benchmarking databases, fundamental for shaping strategies on a local or regional level.
The certification procedure has been imposed by the 2002/91/CE [1] and 2010/31/UE [2] European Directives, and the definition of the calculation method was left to the member states (or regions, in the case of Belgium). The Walloon regulatory calculation method is described in [3] and had to be adapted in its Annex D [4] for the assessment of existing residential buildings. The EPC regulatory calculation method is standardized in the honorable and understandable objective to ease the comparison between buildings. This leads to the use of a tight and strict protocol in the certification procedure that regulates the acceptable proofs of performance, and delivers many default values to fill the holes.
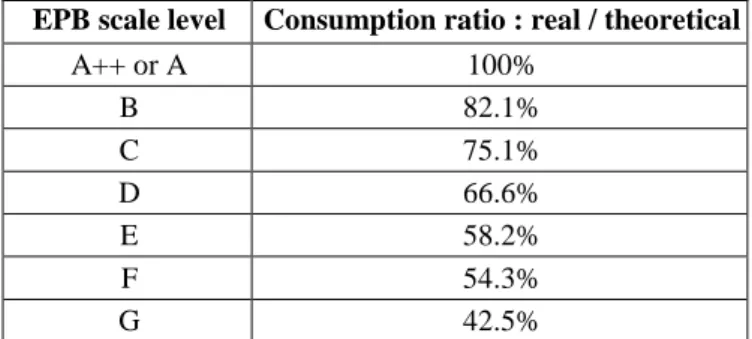
The general picture, nearly ten years later, shows results that are often distant from reality. The Table 1 hereunder gives an overview of average gaps between EPCs and actual energy performance of buildings, evaluated by [11].
Table 1. Conversion of consumption per EPB scale level.
EPB scale level Consumption ratio : real / theoretical
A++ or A 100% B 82.1% C 75.1% D 66.6% E 58.2% F 54.3% G 42.5%
It seems also that EPC results are too difficult to understand by the lay person. By expressing performance in kWh of “primary energy”, it bypasses the fact that consumers’ only knowledge of their energy consumption are the final energy bills, expressed in money terms. It is believed that the input data used in the quasi-steady state calculation method used in Wallonia could be used to display more understandable complementary results. Additional data on the household’s composition, their practices and behaviors related to energy consumption, as well as a more accurate search in the description of the energy system, could help close the gap between real and theoretical consumptions, allowing future owners to better understand and appropriate the EPC results, foresee a rough monthly energy bill, and make better decisions for their real-estate renovation ambitions.
2. Uncertainties
The uncertainties that appear in the Walloon EPC procedure can be distinguished between the ones related to the procedure (the protocol that brings simplifications and shortcuts by design) and those related to the standardization of the calculation method. Only the second kind will be of interest in this study, resulting from the use, in Wallonia, of a standardized consumption calculation method (asset rating). Standardization usually means that the targeted parameters cannot be replaced by other values, even if they are known with precision. This is the case of several default values used in the Walloon calculation method, such as the definition of the set temperature (constant all year long at 18°C) or the heated volume (equal to 100% of the volume, all year long). The standardization aims to take the human factor out of the equations, by using objective parameters and statistical values as a replacement (the protected volume (Vp) is used with this objective in the Walloon method). It may objectify the assessments, but denies all known influences on energy consumption from the building state and condition, its age and typologies characteristics, its dwellers and their characteristics.
A list of accepted sources of accurate data in the dwelling description (“acceptable proofs”) has been developed to impose a rigid EPC assessment method, leaving few liberties to the assessors in the process. Default values also dominate the methodology, when no acceptable proof of a more accurate value is available. This research proves that, of all those default values, those describing the envelope are most influential on the results, as default values can rule on the presence of insulation, depending on the age of the construction or the renovation, impose thicknesses and thermal properties of all materials, including the insulation layers.
3. Methodology
This research is based on the manipulation of the certification method for two case studies, in order to try and bring the results closer to their real consumption results. This implies the need to:
- Describe, as accurately as possible, those two houses and their energy systems;
- Interview their owners in order to gain additional data on the house, their data of real energy consumption, their habits and behaviors that are believed to be needed in order to de-standardize the calculation method;
- Re-write some parts of the calculation method, and integrate this “new method” (tested several times in order to insure the absence of errors) in an Excel spreadsheet in order to obtain the new de-standardized results;
Those two case studies are extracted from a larger group of 16 houses studied in [6]. The goal of that research was to explore the qualitative requirements to close the gap between real and theoretical EPC consumptions. The objective was not statistical: where individual buildings are concerned, EPC values are bound to vary from actual consumption values, depending on a wide range of factors, relating to the buildings “energy systems” themselves, weather patterns and behaviors, which are among the standardized uncertainties studied in these example. Although the EPC, as a regulatory scheme, might not seem the right tool to evaluate actual performance, one of the constraints of the research is to prove the potentialities of the EPC scheme without the need for too deep a change in the calculation method. As said above, it is believed that the input data used in the quasi-steady state calculation method used in Wallonia could be used to display more understandable complementary results.
3.1. Case studies
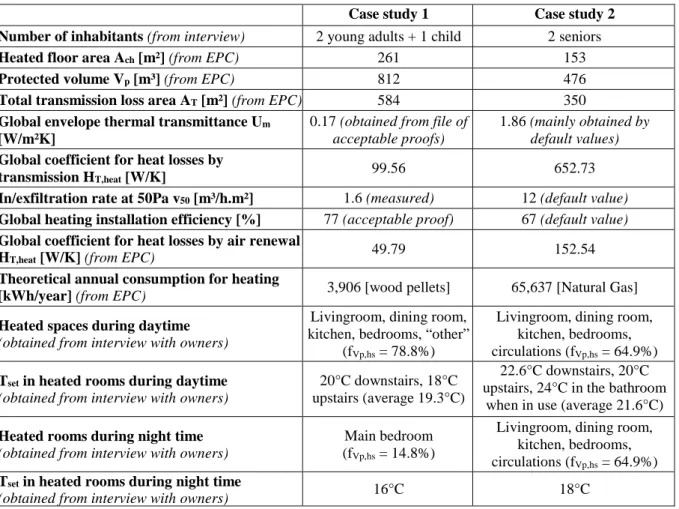
Both houses studied in this paper date from the 1950’s, and are located in the suburbs of Liege, in Wallonia, Belgium. Their main characteristics are displayed in Table 2 hereunder.
Table 2. Overview of the main energy characteristics of both case studies.
Case study 1 Case study 2 Number of inhabitants (from interview) 2 young adults + 1 child 2 seniors
Heated floor area Ach [m²] (from EPC) 261 153
Protected volume Vp [m³] (from EPC) 812 476
Total transmission loss area AT [m²] (from EPC) 584 350
Global envelope thermal transmittance Um
[W/m²K]
0.17 (obtained from file of
acceptable proofs)
1.86 (mainly obtained by
default values)
Global coefficient for heat losses by
transmission HT,heat [W/K] 99.56 652.73
In/exfiltration rate at 50Pa v50 [m³/h.m²] 1.6 (measured) 12 (default value)
Global heating installation efficiency [%] 77 (acceptable proof) 67 (default value)
Global coefficient for heat losses by air renewal
HT,heat [W/K] (from EPC) 49.79 152.54
Theoretical annual consumption for heating
[kWh/year] (from EPC) 3,906 [wood pellets] 65,637 [Natural Gas] Heated spaces during daytime
(obtained from interview with owners)
Livingroom, dining room, kitchen, bedrooms, “other”
(fVp,hs = 78.8%)
Livingroom, dining room, kitchen, bedrooms, circulations (fVp,hs = 64.9%)
Tset in heated rooms during daytime
(obtained from interview with owners)
20°C downstairs, 18°C upstairs (average 19.3°C)
22.6°C downstairs, 20°C upstairs, 24°C in the bathroom
when in use (average 21.6°C)
Heated rooms during night time
(obtained from interview with owners)
Main bedroom (fVp,hs = 14.8%)
Livingroom, dining room, kitchen, bedrooms, circulations (fVp,hs = 64.9%)
Tset in heated rooms during night time
(obtained from interview with owners) 16°C 18°C
The first house has been renovated in 2016-2017 to reach a highly efficient standard (it is now labelled A+ on the official certification scale). The whole existing envelope has been covered with thick layers of thermal insulation that allowed to reach better thermal transmittance than those asked today for new buildings in Wallonia. It has been equipped with highly efficient systems, using wood pellets for its production of heat and Domestic Hot Water (DHW), and a completely mechanical ventilation system
with heat recovery. There was, for this house, a complete file of acceptable proofs in order to use the most accurate values everywhere possible, from the U-values of the different walls, to the in/exfiltration rate and systems efficiencies.
The second house shows far less impressive characteristics, its envelope seems to have stayed in its original condition (without any insulation layers). It is equipped with a natural gas boiler for the production of heat, an electric boiler for DHW production, and no ventilation system whatsoever. The owner of this house could not mention any presence of insulation in the house, nor could she give any acceptable proof to feed the description. No insulation was visible, suspected, or found in the walls of the house (without dismantling or destructive tests), so that default values govern most of its description in the software.
This paper will focus entirely on the heating consumptions. The owners of the first case study have followed closely the settings and parametrization of the systems in order to maximize their efficiencies and minimize their consumptions. Besides showing validation that there is an element of fun, interest and intellectual stimulation and real energy saving potential in a technology that can be appropriated by the owner [8], this behavior allowed them to separate their wood pellets consumptions between DHW and heating uses, and detail their solar production. In the second case study, heating is the only end-use consuming natural gas; all other equipment, including cooking appliances and DHW installations, use electricity.
The revaluation of energy consumptions related to heating will mainly focus on the revaluation of net heat demands, through redefinitions of set temperatures and heated volumes, and revaluation of internal loads and heat losses.
3.2. De-standardization
The consumption of energy for space heating is calculated using a single zone, quasi-steady-state, monthly calculation method. This imposes to keep a monthly approach on the evaluation of heating demands and consumptions, implying the use of average monthly values to define each parameter of the calculation, such as the climate, set temperature, heat losses by transmission and air renewal, internal and solar gains… It is the uncertainty on these monthly values that is questioned in this research. While leaning on the existing calculation method, there is a clear need to inquire about the heating patterns and energy consuming habits of the households, in order to allow a revaluation of the net heat demand. It appears possible, therefore, to discretize inputs and so replace a big uncertainty on monthly averages inputs by a string of smaller uncertainties on periods of time that are better described in occupancy and heating. This method remains subjected to averages and default values, on which the uncertainty should be lowered, either by a better description of the building, of the household, or their energy consuming habits.
In order to gain additional data on inhabitants’ behavior and energy consumption habits, a questionnaire has been built, submitted by the author to the respondents during in-depth, open-ended interview in which questions are worked into a conversational flow. It also permitted witnessing some habits and behaviors that were not considered or not verbalized by respondents. Apart from a selection of additional data on the building and its users (socio-demographic variables), the questionnaire mainly asks the owners to specify their heating habits (days and hours of heating, set temperatures, presence of temperature controls…) for the six main spaces listed above; their ventilation habits in four of them (living room, kitchen, bedrooms and bathrooms); a list of “rational use of energy behaviors”; a list of appliances and equipment to reevaluate the internal gains; and, of course, their real consumption data (with the corresponding periods, in order to adjust the climatic data accordingly).
The discretizing process consists in splitting monthly lengths into sub-periods of time, depending on the owners’ answers to the questionnaire. It appeared that each day could be divided into eight periods: “sleep”, “wake up and get ready”, “morning”, “noon”, “afternoon (school schedule)”, “afternoon (rest)”, “evening”, and “ready for bed and turn off”. The second and last one of them are mainly devoted to the periods of time the bathrooms are used (and often heated more than usual).
The definitive calculation method keeps the single-zone model and its important parameters, such as the protected volume (Vp), heated floor area (Ach), total heat loss area (AT), coefficient of heat losses by transmission (HT,heat), etc. Contrary to the regulatory calculation method hypotheses that consider the whole protected volume as heated, all year round, at the same set temperature of 18°C, this method needs recalculating the global temperature of the building for each of those periods, depending on heating patterns that have been created based on the owners’ interviews. It uses the discretization only to reassess the global internal temperature that translates the influence of the proportion of Vp that is directly heated and the comfort temperatures demanded in those parts. As a consequence, Net Heat Demands (NHDs) have to be revaluated for the whole dwelling, heated and unheated spaces alike.
For that purpose, the mono-zone model needs a hypothesis on the temperature of unheated (or indirectly heated) spaces in order to estimate the global average internal temperature of the dwelling. At first, this temperature in unheated spaces is defined thus in this research:
T , = T , + ∆T − (T , + ∆T ) − θ2 , × 1 − f , × f∆ , × f (1)
where:
- Tuhs,m = monthly average temperature in unheated spaces during heating periods [°C];
- Tset,hs = set temperature in heated spaces [°C];
- ΔTtset = positive or negative increment in set temperature according to sensitivity to cold [°C] (data extracted from the questionnaire);
- θe,m = monthly average exterior temperature [°C];
- fVp,hs = ratio of the heated spaces’ volumes on the total protected volume, during the heating period considered.
- fΔT,uhs = empirical factor (0.8 to 1.2), depends on the tendency to close doors between them (data
extracted from the questionnaire).
- fpct = multiplicative factor considering the quality of the envelope as influence on temperature homogenization, equal to the sum of transmission and air change heat loss coefficients, divided by the protected volume [W/m³.K].
The average periodic temperature Tset,i, and the resulting global monthly internal temperature Tset,m can then be defined thusly:
T , = T , × f , + T × 1 − f , (2) T , = T ,t∗ t , # , , # $% $& (3)
The software developed for the regulatory EPC assessment of existing dwellings, PACE (for “Procédure d’Avis et de Certification Energétique” – “Energy Certification and Audit Procedure”), does not allow alterations on the calculation method. The software used in this research, therefore, is an Excel spreadsheet in which the method could be implemented and modified. A series of input parameters were gathered from the PACE software then directly introduced in the spreadsheet, such as the average thermal transmission coefficient (Um), the solar gains; or the efficiencies for the technical systems. Tests have been run, between the PACE software and the spreadsheet to ensure the correspondence of results, before implementing any other modification made necessary by the objectives of this research and integrate the (coded) answers to the questionnaire.
4. Results
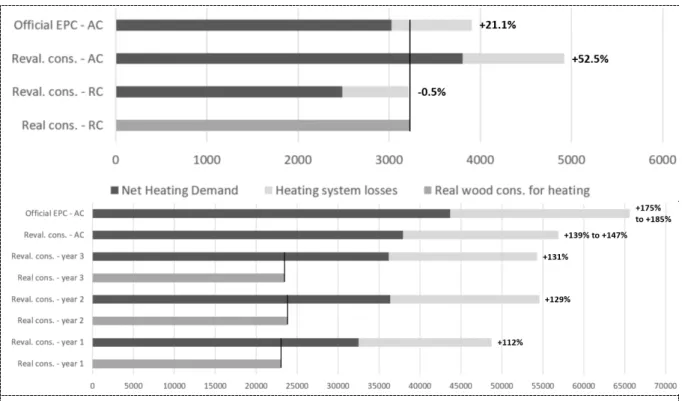
These results are very convincingly close to reality, as the revaluations made under real climatic data hypotheses only show a 0.5% gap with the real consumption data given by the owners. Revaluations under the average climatic data are overestimated by 52.5%, which emphasizes the need to use adequate
climatic data in order to reach accurate results. The average climate used in the EPB regulatory method is based on the data registered in Uccle (near Brussels) during the last 50 years.
Figure 1. Results in final energy consumptions (kWh/year for heating) for (a) the first case study and (b) the second case study. “Reval.” = Revaluations; RC = Real Climate (obtained from local weather stations); AC = Average Climate (Belgian average used in regulatory EPC calculations). In the second case study, there is a discrepancy between the revaluations and the real consumption data that cannot be wiped away by the de-standardization proposed here. The theoretical EPC results (65,637kWh of natural gas final consumption) were estimated 2.8 times higher than the average real consumption data (23,427kWh). Revaluations lowered these theoretical consumptions, which remained as high as twice the real data. It is believed that the parametrization of the calculation method cannot be the only questionable determiner of this discrepancy.
The ratio between natural gas consumptions revaluations and real data shows a wider range of variation when using the real climatic data, which means that the real consumptions data vary less, from one year to another (standard deviation of 421kWh), than the evaluations that were made using the real climatic data (standard deviation of 3,290kWh). This would incriminate the characterization of the energy system in this case: should its envelope and heating installation be more accurately described, revaluations results would better follow the dynamics of real data, and be less influenced by climate. Looking closely, the first year’s revaluations are “particularly low” (+112%), whereas the second and third year are both overestimated by 130%. A behavioral change in habits at that time, or in the energy system, might bring a better explanation; unfortunately, this kind of dynamics is not possible in a “one-shot” interview and description of the heating habits.
To try and bring those results closer to real consumption data, several additional results were sought: First, the presence of an un-witnessed presence of thermal insulation could partially explain the gap. A hypothetical insulation layer of 6cm of mineral wool in the roof brings the Um to 1.49W/m²K, and lowers the theoretical consumptions by an average 12,600kWh under average climate, 11,527kWh under real climate (10,765 to 12,327kWh, depending on the year). The standard deviation mentioned above slightly decreases to 3,158kWh, but this improvement does not allow to better explain the consumption dynamics on the period covered, nor does it allow to close the “prebound” gap. At their lowest, these
consumption revaluations are still on average 72.6% higher than the real consumption data. The hypothetical insulation layer in the roof could be thicker than 6cm, but this hypothesis has a limit, both in credibility and on the total heat losses by transmission, as 480W/K of them are attributed to the other uninsulated walls and windows.
Then in addition to a permeability test (in order to get a more accurate infiltration air rate, which proved to be around 9 m³/h.m² under a 50 PA pressure difference), a monitoring campaign of this case study’s internal temperatures has been realized between February 21st, 2018 and March 4th, 2018, a cold period in Wallonia. Sensors have been placed in exterior (protected from wind and sun influences, to monitor θe,m in Eq. 1); in heated spaces (living room, where the thermostat is placed, kitchen, bathroom and two bedrooms, including the main one) and in unheated spaces inside the Vp (those which temperature is revaluated by Eq 1: the garage and veranda). This monitoring campaign allowed to draw the following conclusions:
- The heating pattern was no so far off the reality. The bathroom temperature often rises above 27°C, which is more than the model hypothesis of 24°C but can be explained by the running of hot water in such a small space. During [10AM – 10PM] “daytime” periods, the monitored average temperature is 22.08°C in daytime spaces (lower than the 22.6°C used as input in the model), and 20.82°C in night-time spaces (higher than the 20°C used as hypothesis). This is an example of compensation, where overestimated consumptions for one end-use offset another end-use’s consumption underestimation. Furthermore, the heating system needs more than two hours to raise the living room temperature, which never fell under 18°C, above 22°C. This sheds another light on the calculation method, which considers the heated share of the volume to reach the set temperature within seconds. Old, uninsulated, thermally inert and globally inefficient homes need time for the installation to heat the dwelling up, whereas efficient buildings reach comfortable temperature quicker, which might partly explain their more accurate results so far. The adjustment of the heating pattern to these monitored data results saw a reduction of the total final energy consumption of around 2 to 3%, which is mainly attributed to the first “start of the heating system” period.
- There does not seem to be any indication of a night time heating, despite the declared setting. The thermal inertia of the house, and the high temperature to which it is constantly heated daily, allow a slow reduction of the internal temperature during the cold nights of the campaigns without resorting to active heating. The choice was made to keep the night time settings in the calculation method, hoping that it would come to the same conclusions by itself.
- The veranda is central in the definition of the Vp. Its temperature curve shows that it should probably be excluded from it, which would be quite in accordance with the owner’s use of the space (they only use it in the summer, never when the heating system is on) but had to be included when considering the certification protocol. The garage would then become the only unheated space in the Vp, and the Eq 1 then becomes accurate enough to define its theoretical temperature. However, the exclusion of the veranda from the Vp means some important changes in simulations parameters (Vp, Ach, AT, Um, HT,heat, fVp,hs). The reduction in solar gains is also important, from 14,798 annual kWh in the initial EPC, to 4,640kWh/year after the exclusion of the veranda’s windows from the Vp envelope. The heat gains were probably overestimated before this change, as the owners keep the access to the veranda shut during winter times and do not use the solar gains that are captured by the veranda’s glazed areas but for the small share that reaches the living room. Now that the veranda is out, the calculation method cancels any solar gains that could be considered coming through the 3.6m² of window that separate the living room from the veranda. This scenario delivers more surprising revaluated results, thanks to the diverse consequences on the results that this scenario brings: there is a compensation between effects, as the revaluated results of final energy consumption do not change much on average. 5. Discussion
Multi-zone dynamic calculations could perhaps render more precise (and closer) results, but this study, in order to evaluate the potential of the existing protocol and assessment method, is purposefully based on the existing steady-state regulatory calculation method. “All models are wrong, but some are useful” [9]. Dynamic simulations are also expected to ask for a more precise input data collection, in order to deliver a precision in results that is not really sought in the EPC procedure. There are, however, two major parameters of the dynamic method that could perhaps be wisely integrated into the EPC calculation method: the available power of the systems, and the thermal inertia.
The collection of accurate acceptable data is not the assessor’s job, but the applicant’s, which implies that all assessors should start their EPC with the same information, use the same default values when there are no information, and therefore reach similar results. When no such data exists, or is available, the method proposes many default values. They allow a simplification of the protocol, so that the certification procedure can remain affordable for the owner, and worthwhile for the assessor. It is an admitted principle in EPB procedures in Wallonia, that the use of default values should be disadvantageous for the results. “Choosing more realistic default values can help bridging the prediction gap. However, this would oppose itself to the role of conservative default values, namely to admonish building teams to perform better and to verify their results, by rewarding these efforts through better energy labels based on measured values.” Additionally, “more positive default values could even result in some kind of impunity for those buildings that really do perform badly.” [7]
Last but not least, the prediction of energy bills is, by essence, uncertain, and in that regard, behavior can be the main determiner of annual variations. As the refinement of calculation parameters progresses, the influence of the remaining pool of unknown (or default) parameters increases. Exact correspondence between real consumption data and theoretical revaluations is limited by the high number of uncertainty parameters in the method to control. These revaluations only considered the “habitual consumption resulting from routine conscious and unconscious management”, one of the three dimensions of consumption patterning identified by [10] (the other two being the “structural consumption that occurs when the building is unoccupied”, and the “daily variation consumption resulting from unusual events”). 6. Conclusions
This research has been devoted to explain past energy consumptions by increasing the accuracy of their determiners in the calculation method. The objective is clearly not statistical, given the low numbers of case studies in this paper (2) or in the thesis [6] from which they are extracted (16). With the necessary understanding that the EPC calculation method needs to remain standardized in order to allow the comparison of buildings, this research mainly aimed to answer to the question “could it also give more accurate complementary predictions in energy consumption, with a number of additional data?”
It seems possible to predict with an interesting accuracy margin, the final energy consumptions of a household which profile is known, in a house which is accurately described. It is quite clear, when comparing those two case studies’ results, that the calculation method is more accurate for new buildings than existing ones; or rather, for insulated buildings which owners can prove their information, than for inefficient or undocumented buildings. The EPC calculation method was designed on the basis of the Walloon EPB regulatory calculation method, which was initially developed for new and efficient buildings. Its standardization, considering 100% of the Vp heated at 18°C, is closer to the reality of the first case study.
This research (along with other case studies presented in [6]) permitted to highlight the inaccuracy of the envelope description as most likely source of that remaining gap. The next challenge, therefore, concerns the possibilities to refine the set of default values, without increasing the cost of data collection, bearing in mind that building documentation is not available for the majority of the building stock in need of renovation. A more thorough analysis of the existing Walloon dwelling stock could lead to a matrix of more accurate default values based on typologies, to replace the actual list of values that characterize the whole building stock.
Although the standardized view on the stock’s energy performance is much needed, this research stresses the importance of an increased accuracy in the energy system’s description, and the need for
nuance in the results given by energy audits. One way to achieve that could be based on statistics and added information, in order to deliver more accurate results in final energy consumption, and the integration in the calculation method, of behavioral determiners of energy consumption.
References
[1] European Parliament and Council, 2002. Directive 2002/91/CE Approved the 16th of December 2002, about Energy Performance of Buildings. 2002. Official Journal of the European Communities 4.1.2003 L 1/65 Available online: http://eur-lex.europa.eu/eli/dir/2002/91/oj (accessed on November 9th, 2016)
[2] European Parliament and Council, 2010. Directive 2010/31/UE Approved the 19th of May 2010, on energy performance of buildings (recast). 2010. Official Journal of the European Union 18.6.2010 L 153/13 Available online: http://data.europa.eu/eli/dir/2010/31/oj (accessed on April 10th, 2019)
[3] Service Public de Wallonie. 2014. Arrêté du Gouvernement Wallon du 30 Juillet 2014 Portant Exécution du Décret du 28 Novembre 2013 Relatif à la Performance Énergétique des Bâtiments; Moniteur Belge: Namur, Belgium; pp. 56172–56294.
[4] Service Public de Wallonie, 2014. Annexe D: Méthode de Détermination de la Consommation Spécifique des Bâtiments Résidentiels dans le Cadre de la Certification PEB; moniteur Belge: Namur, Belgium; pp. 61636–61767.
[5] M. Delghust, W. Roelens, T. Tanghe, Y. De Weerdt, A. Janssens, 2015. Regulatory energy calculations versus real energy use in high-performance houses, Building Research & Information, 43:6, 675-690
[6] Monfils, S., 2018. The human factor in the energy performance assessments for renovation strategies of existing houses in Wallonia, PhD thesis, University of Liege, Belgium
[7] M. Deurinck, D. Saelens, S. Roels, 2012. Assessment of the physical part of the temperature takeback for residential retrofits, Elsevier Energy and Buildings 52: 112-121
[8] N. Kalampalikis, M. W. Bauer, T. Apostolidis, 2013. International review of social psychology, Presses universitaires de Grenoble, France, 232 p.
[9] G. E.P. Box, 1979. Robustness in the strategy of scientific model building, p.202 of Robustness in Statistics, R.L. Launer and G.N. Wilkinson, Editors.
[10] M. J. III Bernard, J. R. McBride, D. J. Desmond, N. E. Collins, 1988. Events-The third variable in daily household energy consumption. Proc. Am. Cour/c. Energy Effie. Eeon., pp. 11.11-14. Washington, DC: ACEEE Press
[11] Secrétariat général du Service public de Wallonie, Département du Développement durable, 2010. Etude « Alliance Emploi Environnement » : Proposition de modalités opérationnelles et affectation des moyens budgétaires aux mesures envisagées par le groupe de travail financement, Namur, Belgium, p. 2 and 8.