Université de Montréal
Développement et caractérisation d’une méthode photonique pour créer des distributions spatiales de protéines
par Jonathan Bélisle
Institut de Génie Biomédical Faculté de Médecine
Thèse présentée à la Faculté de Médecine
en vue de l’obtention du grade de Philosophiae Doctor (Ph.D) en Génie Biomédical
Décembre 2011
Université de Montréal
Faculté des études supérieures et postdoctorales
Cette thèse intitulée :
Développement et caractérisation d’une méthode photonique pour créer des distributions spatiales de protéines
présentée par : Jonathan Bélisle
a été évaluée par un jury composé des personnes suivantes :
Rikard Blunck, président-rapporteur Santiago Costantino, directeur de recherche
Frédéric Lesage, membre du jury Albert Folch, examinateur externe Paul Cisek, représentant du doyen de la FES
i
Résumé
Les cellules sont capables de détecter les distributions spatiales de protéines et ainsi de migrer ou s’étendre dans la direction appropriée. Une compréhension de la réponse cellulaire aux modifications de ces distributions spatiales de protéines est essentielle pour l’avancement des connaissances dans plusieurs domaines de recherches tels que le développement, l’immunologie ou l’oncologie. Un exemple particulièrement complexe est le guidage d’axones se déroulant pendant le développement du système nerveux. Ce dernier nécessite la présence de plusieurs distributions de molécules de guidages étant attractives ou répulsives pour connecter correctement ce réseau complexe qu’est le système nerveux. Puisque plusieurs indices de guidage collaborent, il est particulièrement difficile d’identifier la contribution individuelle ou la voie de signalisation qui est déclenchée in
vivo, il est donc nécessaire d’utiliser des méthodes pour reproduire ces distributions de
protéines in vitro. Plusieurs méthodes existent pour produire des gradients de protéines solubles ou liées aux substrats. Quelques méthodes pour produire des gradients solubles sont déjà couramment utilisées dans plusieurs laboratoires, mais elles limitent l’étude aux distributions de protéines qui sont normalement sécrétées in vivo. Les méthodes permettant de produire des distributions liées au substrat sont particulièrement complexes, ce qui restreint leur utilisation à quelques laboratoires.
Premièrement, nous présentons une méthode simple qui exploite le photoblanchiment de molécules fluorescentes pour créer des motifs de protéines liées au
substrat : Laser-assisted protein adsorption by photobleaching (LAPAP). Cette méthode permet de produire des motifs de protéines complexes d’une résolution micrométrique et d’une grande portée dynamique. Une caractérisation de la technique a été faite et en tant que preuve de fonctionnalité, des axones de neurones du ganglion spinal ont été guidés sur des gradients d’un peptide provenant de la laminine.
Deuxièmement, LAPAP a été amélioré de manière à pouvoir fabriquer des motifs avec plusieurs composantes grâce à l’utilisation de lasers à différentes longueurs d’onde et d’anticorps conjugués à des fluorophores correspondants à ces longueurs d’onde. De plus, pour accélérer et simplifier le processus de fabrication, nous avons développé LAPAP à illumination à champ large qui utilise un modulateur spatial de lumière, une diode électroluminescente et un microscope standard pour imprimer directement un motif de protéines. Cette méthode est particulièrement simple comparativement à la version originale de LAPAP puisqu’elle n’implique pas le contrôle de la puissance laser et de platines motorisées, mais seulement d’envoyer l’image du motif désiré au modulateur spatial.
Finalement, nous avons utilisé LAPAP pour démontrer que notre technique peut être utilisée dans des analyses de haut contenu pour quantifier les changements morphologiques résultant de la croissance neuronale sur des gradients de protéines de guidage. Nous avons produit des milliers de gradients de laminin-1 ayant différentes pentes et analysé les variations au niveau du guidage de neurites provenant d’une lignée cellulaire neuronale (RGC-5). Un algorithme pour analyser les images des cellules sur les gradients a
iii
été développé pour détecter chaque cellule et quantifier la position du centroïde du soma ainsi que les angles d’initiation, final et de braquage de chaque neurite. Ces données ont démontré que les gradients de laminine influencent l’angle d’initiation des neurites des RGC-5, mais n’influencent pas leur braquage.
Nous croyons que les résultats présentés dans cette thèse faciliteront l’utilisation de motifs de protéines liées au substrat dans les laboratoires des sciences de la vie, puisque LAPAP peut être effectué à l’aide d’un microscope confocal ou d’un microscope standard légèrement modifié. Cela pourrait contribuer à l’augmentation du nombre de laboratoires travaillant sur le guidage avec des gradients liés au substrat afin d’atteindre la masse critique nécessaire à des percées majeures en neuroscience.
v
Abstract
Cells are able to sense spatial distribution of proteins and accordingly migrate or extend in the appropriate direction. Understanding cellular responses to modifications in molecular spatial distributions is essential for advances in several fields such as development, immunology and oncology. A particularly complex example is axonal guidance that occurs during the development of the nervous system, which relies on distributions of attractive and repulsive guidance molecules to correctly wire this intricate network. Since several guidance cues collaborate to development of the nervous system, it is particularly difficult to assess the individual contribution of each cue and the signaling cascade each trigger in vivo; therefore methods to reproduce those distributions individually
in vitro are necessary to study in detail the effect of each guidance cue. Several methods
exist to produce graded distributions of protein that are either soluble or substrate-bound. A few methods making solution gradients are already widely used in several laboratories to perform experiments with the guidance cues that are normally diffusing in vivo. However, current methods allowing the fabrication of substrate-bound gradients are quite complex, which restrict their use to a few laboratories.
First, we present a straightforward method exploiting photobleaching of a fluorescently tagged molecule using a visible laser to generating substrate-bound protein patterns: Laser-assisted protein adsorption by photobleaching (LAPAP). This method allows producing complex patterns of protein with micron spatial resolution and high
dynamic range. An extensive characterization of the technique was performed and as proof of functionality, axons from dorsal root ganglions cells were guided on laminin peptide gradients.
Secondly, LAPAP was improved in order to produce multicomponent patterns by using lasers at different wavelengths and antibodies conjugated to fluorophores corresponding to these wavelengths. Moreover, to speed-up the fabrication process and simplify the device, we developed widefield illumination LAPAP which uses a spatial light modulator, a light emitting diode and a standard microscope to directly print patterns. This patterning method is relatively simple compared to the original LAPAP setup, since it does not involve controlling the laser power or a motorized stage, but only sends an image of the desired pattern to a spatial light modulator.
Finally, we used LAPAP to show how it could be used in automated high-content screening assays to quantify the morphological changes resulting from axon growth on gradients of guidance proteins. We produced thousands of laminin-1 gradients of different slopes and analyzed the variations in neurite guidance of neuron-like cells (RGC-5). An image analysis algorithm was developed to process bright field microscopy images, detecting each cell and quantifying the soma centroid and the initiation, terminal and turning angles of the maximal neurite. This data showed that laminin gradients influence the initiation angle of neurite extension of RGC-5, but does not contribute to its turning.
vii
We believe that the results presented in this thesis will facilitate the use of substrate-bound protein patterning in typical life science laboratories, since a confocal microscope or a slightly modified standard microscope is the only specialized equipment needed to fabricate patterns by LAPAP. This could increase the number of laboratories working with substrate-bound protein patterns in order to reach the critical mass necessary for major advances in neuroscience.
ix
Table of contents
Résumé ... i
Abstract ... v
Table of contents ... ix
List of figures ... xiii
List of abbreviations and symbols ... xix
1 Introduction ... 1
1.1 The nervous system ... 3
1.2 Axon guidance ... 4 1.2.1 Ephrins ... 6 1.2.2 Semaphorins ... 10 1.2.3 Netrins ... 11 1.2.4 Slits ... 14 1.2.5 Morphogens ... 16
1.2.6 Extracellular matrix, growth factors and neurotransmitters ... 19
1.2.7 Cytoskeleton remodeling ... 20
1.3 Protein patterning ... 25
1.3.1 Zigmond and Dunn chambers ... 26
1.3.3 Soft lithography ... 30
1.3.4 Microfluidics ... 31
1.3.4.1 Flow and diffusion devices ... 31
1.3.4.2 Diffusion-only devices ... 35 1.3.4.3 Flow-only device ... 38 1.3.4.4 Depletion device ... 39 1.3.5 Microcontact printing (µCP) ... 40 1.3.6 Biological hydrogels ... 41 1.3.7 Photopatterning ... 43 1.3.7.1 Photoresists ... 44
1.3.7.2 Photosensitizers with near UV light ... 46
1.3.7.3 Thin layer modifications with far UV light ... 47
1.3.7.4 Photopatterning with visible light ... 49
2 First article ... 51
2.1 Patterning protein concentration using laser-assisted adsorption by photobleaching, LAPAP ... 52
2.1.1 Introduction ... 52
2.1.2 Article ... 53
2.1.3 Acknowledgements ... 62
3 Second article ... 69
xi
3.1.1 Abstract ... 70
3.1.2 Introduction ... 71
3.1.3 Results ... 73
3.1.3.1 Widefield illumination LAPAP ... 73
3.1.3.2 Fluorescently tagged secondary antibody patterns ... 75
3.1.3.3 Single step multicomponent antibody patterns ... 76
3.1.3.4 Multicomponent patterns using subsequent illumination ... 77
3.1.4 Experimental ... 78
3.1.4.1 Widefield illumination LAPAP ... 78
3.1.4.2 Patterns using fluorescently tagged antibodies ... 79
3.1.4.3 Single step multicomponent antibody patterns ... 80
3.1.4.4 Multicomponent patterns using subsequent illumination ... 80
3.1.5 Discussion ... 81
3.1.6 Conclusion ... 84
3.1.7 Acknowledgements ... 85
4 Third article ... 91
4.1 High-content neurite guidance assay using optically patterned substrates ... 92
4.1.1 Abstract ... 92
4.1.2 Introduction ... 93
4.1.3 Materials and methods ... 96
4.1.3.2 Cell culture and differentiation ... 98
4.1.3.3 Microscopy ... 98
4.1.3.4 Automated image analysis ... 99
4.1.4 Results and discussion ... 101
4.1.5 Conclusion ... 104
5 Discussion ... 119
5.1 LAPAP’s advantages ... 119
5.2 Answering new questions about axon guidance ... 122
5.3 LAPAP by a confocal microscope ... 123
5.4 Improvements in widefield LAPAP ... 124
5.5 Protocols improvements ... 126
5.6 3D protein patterning with LAPAP ... 130
5.7 Determining real bound protein densities ... 133
Conclusion ... 137
References ... 141
Annex I: Conference proceedings ... 180
Annex II: One step patterning ... 187
Annex III: BSA structure fabrication ... 188
xiii
List of figures
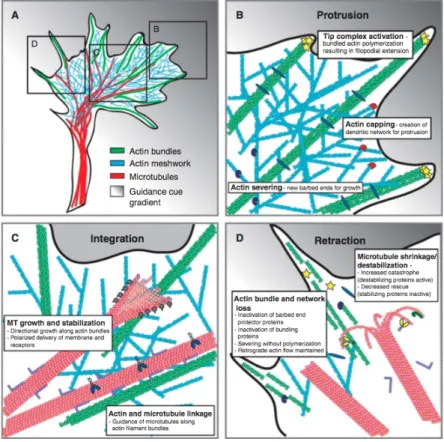
Figure 1.1: A diagram from Traité de l’homme by René Descartes ... 1 Figure 1.2: Representation of a neuron showing its different components ... 4 Figure 1.3: Stripes assay showing preference of temporal axons for growth on the anterior tectum instead of the posterior, but no difference for nasal axons. ... 7 Figure 1.4: Schematic distributions of EphA and EphB receptors of axons from cells in the retina and the distributions of ephrin A and B in the optical tectum ... 9 Figure 1.5: Netrin-1 (red) distribution secreted from the floor plate (fp) in a cross-section of spinal cord. ... 12 Figure 1.6: In the presence of laminin, netrin-1 becomes repulsive to growth cone from RGCs ... 13 Figure 1.7: Switching response to Slits, netrin-1 and semaphorin-3s at the ventral midline of the spinal cord and the role of Comm and Rig-1. ... 15 Figure 1.8: Schematic view of RGCs axon elongation and the presence of Slits around the chiasm which allow growth only in restricted regions. ... 16 Figure 1.9: Gradients of the mophogens BMPs, Shh and Wnts first contribute to specify cell fate and later in the appropriate guidance of axons from commissural neurons. .. 18 Figure 1.10: Growth cone fluorescent image showing F-actin (a) and microtubules (b) and an overlay of both (c and d), actin in green and microtubule in red ... 21
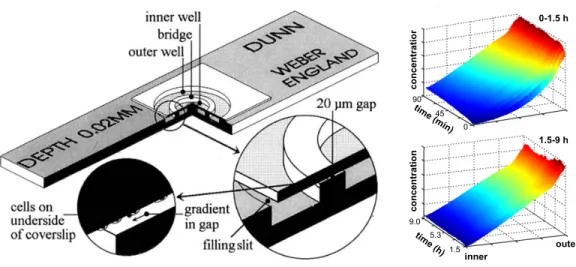
Figure 1.11: Proteins directly implicated in cytoskeletal modifications of F-actin (green) and microtubule (pink) during axonal guidance ... 22 Figure 1.12: Model of cytoskeletal reorganization during growth cone turning due to an attractive guidance cue. ... 23 Figure 1.13: Zigmond chamber showing two wells acting as reservoirs that will produce a diffusion gradient ... 27 Figure 1.14: Left part of the figure shows the Dunn chamber with an inner well filled with regular medium and an other well filled with the guidance cue to produce a gradient by diffusion ... 28 Figure 1.15: Guidance from micropipette generated gradient from chick dorsal root axon. Dotted lines show the location of the micropipette at different time points (reproduced from [114]). ... 30 Figure 1.16: Schematic representation of the serpentine premier to produce substrate-bound or soluble gradients. ... 32 Figure 1.17: Hill-shape gradient profiles at various positions in the growth chamber. (a) Schematic representation of direct-mixing device with three inlets to produce hill-shaped gradient.. ... 34 Figure 1.18: Universal microfluidic gradient generator. ... 35 Figure 1.19: Membrane-based gradient generator that produce a graded molecular distribution by diffusion while the membranes high fluidic resistance avoid flow ... 36
xv
Figure 1.20: Complex-shaped concentration profiles inside microchannels in close contact with a diffusion gradient inside agarose. ... 37 Figure 1.21: Microjets device produces a gradient in an open chamber configuration and its position can be controlled by changing the pressure of the sink and the source ... 38 Figure 1.22: On the left, a cross-section sketch of the multipurpose microfluidic probe showing the injection aperture (QI) and the aspiration aperture (QA) that allow to
adsorb controlled amount of proteins on a adjacent substrate ... 39 Figure 1.23: Gradients of eprinA5 produced by µCP ... 41 Figure 1.24: Commissural neurons attracted by (a) the floor-plate of the spinal cord or (b) an aggregate of COS cells expressing netrin-1 ... 42 Figure 1.25: 3D guidance of DRG cells on helical patterns of IKVAV peptide. (a) Schematic representation (gray) and 3D reconstruction from confocal microscopy images of IKVAV helical patterns (green) ... 43 Figure 1.26: Key steps in photolithographical patterning of alkyl-trichlorosilane (inhibitor) and amino-trihydroxysilane (promotor). ... 45 Figure 1.27: (a) Continuous IKVAV gradient produce by UV laser scanning revealed by immunofluorescence labeling and (b) profile of the fluorescence image compared to simulation ... 47 Figure 1.28: Alexa 488 labeled streptavidin (green) and Alexa 594 antibody (red) shows the ability to produce dual component protein patterns via photobleaching of florescent dyes with visible light ... 49
Figure 2.1: Examples of protein gradients and patterns obtained by Laser-Assisted Protein
Adsorption by Photobleaching (LAPAP) and Setup. ... 63
Figure 2.2: Characterization of the patterning method and growth cone guidance assay. (a) Adsorbed protein concentration as measured by fluorescence as a function of beam dwell time shows an exponential behavior. ... 65
Figure. 2.3: Concentration of substrate-bound protein (Streptavidin-Cy5) as a function of both laser power and dwell time ... 67
Figure 3.1: Widefield illumination LAPAP. ... 86
Figure 3.2: Characterisation of widefield illumination LAPAP ... 87
Figure 3.3: Patterns of antibodies produced by LAPAP. ... 88
Figure 3.4: Two-component patterns by photobleaching FITC and Cy5 conjugated antibodies simultaneously illuminated by 473nm and 671nm lasers. ... 89
Figure 3.5: Three-component protein pattern. ... 90
Figure 4.1: Patterns of laminin-1 were produced using LAPAP. ... 106
Figure 4.2: RGC-5 cells on a low-slope laminin-1 gradient where a streptavidin-Cy5 gradient was imaged by fluorescence microscopy with cells in bright field mode using a 20X 0.75 NA objective. ... 108
Figure 4.3: Histograms of most distal end-point relative to soma centroid position for all cell images in both low-slope and high-slope gradients at time points before and during differentiation with staurosporine. ... 110
xvii
Figure 4.4: Various parameters of cells extending neurites on high-slope gradients 1 hour after differentiation. ... 111 Figure 4.5: Effect of varying the restriction angle used to define whether an extending neurite was guided or unguided by the gradient, using data from high-slope gradients, three hours after differentiation. ... 112 Figure 4.6: Histograms of the initiation angle of cells imaged on low-slope and high-slope gradients at different time points before and during differentiation by staurosporine. ... 113 Figure 4.7: Histograms of the terminal angle of cells imaged on low-slope and high-slope gradients at different time points before and during differentiation by staurosporine.. ... 114 Figure 4.8: Histograms of the turning angle of cells imaged on low-slope and high-slope gradients at different time points before and during differentiation by staurosporine. ... 115 Figure 4.9: Histograms of the x-position of the centroid of the cell soma along the gradient (low-slope gradient). ... 116 Figure 4.10: Histograms of the branching points of cells imaged on low-slope and
high-slope gradients at different time points before and during differentiation by staurosporine. ... 117 Figure 4.11: Histograms of the x-position of the centroid of the cell soma along the gradients (high-slope gradient). ... 118
Figure 5.1: Widefield LAPAP using holographic illumination to create desired pattern. .. 126 Figure 5.2: Schematic representation of a PDL or PLL stripe pattern (yellow) leading to a protein gradient (red). ... 128 Figure 5.3: One-step protein patterning procedure next to a living neuron done by laser scanning on a confocal microscope.. ... 129 Figure 5.4: Schematic representation of two-photon absorption LAPAP (2P-LAPAP) performed in a hydrogel. ... 131 Figure 5.5: 3D pattern of the earth produced by 2P-LAPAP inside agarose. ... 132 Figure 5.6: Steric effects influence how the density of final protein is amplified by streptavidin, biotinylated secondary antibody and primary antibody ... 135 Figure I.1: LAPAP setup includes a 473nm diode pumped solid state (DPSS) laser which is focused by a microscope objective on the top surface of a coverglass where a drop of biotin-4-fluorescein (B4F) is placed ... 182 Figure II.1: One step patterning of rabbit anti-laminin mixed with FITC as a photosensitizer. ... 187 Figure III.1: Thick BSA structures fabricated with our LAPAP setup and RCG-5 cells growing along them ... 188 Figure IV.1: Sonic Hedgehog and netrin-1 stripe patterns revealed by immunostaining. .. 190
xix
List of abbreviations and symbols
+TIP plus-end-tracking protein° degree
°C degree Celsius
µCP microcontact printing
µg microgram
µm micrometer
µVCD microvalve chemotaxis device
2D two-dimensional
3D three-dimensional
AOM acousto-optical modulator AOTF acousto-optical tunable filter B4F biotin-4-fluorescein
BDNF brain-derived neurotrophic factor BMP bone morphogenetic protein BSA bovine serum albumine Ca2+ calcium ion
cAMP cyclic adenosine monophosphate CCD charge-‐coupled device
CNS central nervous system CO2 carbon dioxide
Comm commissureless Cy5 cyanine-5
DCC deleted in colorectal carcinoma DMEM Dulbecco’s modified Eagle medium DMS dimethyldichlorosilane
DNA deoxyribonucleic acid Dpp decapentaplegic DRG dorsal root ganglion
EDS 3-[(2-aminoethyl)amino]propyltrimethoxysilane EGF epidermal growth factor
F-actin filamentous actin
FAD flavin adenine dinucleotide FITC fluorescein isothiocyanate
GF growth factor
GPI glycosylphosphatidylinositol
Hh hedgehog
HRP horseradish peroxidase
ICAM-1 intercellular adhesion molecule-1 IFN-γ interferon-gamma
xxi
IgG immunoglobulin G
IL-2 interleukin-2 IL-8 interleukin-8 kDa kilodalton
LAPAP laser-assisted protein adsorption by photobleaching LCD liquid crystal display
LED light-emitting diode
MAP microtubule stabilizing proteins
min minute
mL milliliter
mM millimolar
mW milliwatt
NA numerical aperture NGF nerve growth factor
nm nanometer
nM nanomolar
NrCAM neural cell adhesion molecule NSC neural stem cells
NVOC nitroveratryloxycarbonyl ONH optic nerve head
PC polycarbonate PDL poly-D-lysine
PDMS polydimethylsiloxane PEG polyethylene glycol
PI-PLC phosphatidylinositol-specific phospholipase PLL poly-L-lysine
PLL-g-PEG poly-L-lysine-grafted-polyethylene glycol PMMA polymethylmethacrylate
PNS peripheral nervous system RAGS repulsive axon guidance signal RGC retinal ganglion cells
Robo roundabout
SAM self assembled monolayer
s seconds
Shh sonic hedgehog SC superior colliculus
SVGA super video graphics array TGF-β transforming growth factor-β
TRITC tetramethylrhodamine isothiocyanate USAF United States Air Force
xxiii
VEGFA vascular endothelial growth factor A Wnt wingless integration
xxv
Remerciements
Je voudrais tout d’abord remercier mon superviseur le Dr Santiago Costantino de m’avoir fait confiance pour être son premier étudiant gradué et de m’avoir confié ce projet qui est au centre de ses intérêts de recherche. Je lui suis reconnaissant pour l’encadrement stimulant, sa grande disponibilité ainsi que le jugement critique qu’il a su me transmettre au cours de ces quatre années. Je voudrais également remercier Dr Dario Kunik et Dr Javier Mazzaferri, deux chercheurs postdoctoraux du laboratoire qui m’ont aidé au cours de mon projet de recherche et qui ont contribué à créer une excellente ambiance de travail. Un merci aussi à tous les étudiants du laboratoire : Carolyne Dion, Kanwarpal Singh, Mikhaela Anca Marian, Samuel Boutin, Charles-André Couture, Dominique Matte, Sarah Power et Faezeh Lorghaba. Je voudrais également remercier Dr Timothy Kennedy et James Correia d’avoir contribué à mon projet de doctorat. Je voudrais également remercier Dr Elliot Drobetsky ainsi que ses étudiants Raphaël Rouget et Yannick Auclair de m’avoir initié à la réparation de l’ADN par excision de nucléotides dans le cadre d’un projet connexe. Un autre remerciement au Dr Stephane Lefrançois et ainsi qu’à ses étudiants Dr Aline Mamo, Felix Jules, Karine Dumaresq-Doiron et Andreanne Goyette de m’avoir permis d’en apprendre davantage sur le transport des protéines aux lysosomes. Je voudrais également en profiter pour exprimer ma gratitude au Dr Leonard Levin et les membres de son laboratoire Rachel Beaubien, Wesley Chan, Maria-Magdalena Catrinescu et Dr Akiyasu Kanamori de m’avoir appris la culture des cellules ganglionnaires de la rétine et de m’avoir permis de
mettre à contribution mon expertise en optique pour collaborer à un projet portant sur la dégénération des axones suite à un dommage à la rétine. Je remercie aussi Alan Vlautin pour sa lecture attentive permettant d’améliorer la qualité de la langue de cette thèse.
Finalement, je voudrais remercier ma famille, mes parents Johanne et Michel et ma sœur Ève qui m’ont toujours encouragé à persévérer dans mes études. Un merci très spécial à ma conjointe Laurence qui m’a toujours supporté lors des bons et moins bons moments de mon doctorat ainsi qu’à mes deux fils Édouard et Victor qui ont vu le jour au cours des travaux qui ont mené à cette thèse et m’ont fait comprendre le véritable miracle qu’est le développement d’un être vivant.
1 Introduction
The nervous system has fascinated mankind for a long time. The earliest evidence coming from a papyrus dated from approximately 1700 BC reveals that Egyptians studied brain injury [1]. During antiquity, Plato correctly believed that the brain was directly responsible for reasoning, however his views on the subject were not accepted among fellow philosophers. Leonardo da Vinci undertook research in order to show how the brain perceived exterior stimulus; concentrating mostly on vision and olfaction [2]. In Traité de
l’homme, René Descartes proposed that the visual world as perceived by the eye is
projected in a Cartesian manner to the brain forming an accurate map of the outside world in the brain (Figure 1.1).
Figure 1.1: A diagram from Traité de l’homme by René Descartes showing that a map of the external world is first formed on the retina, which is later reproduced in the brain. This mapping will later become one major research field for axonal guidance.
By the end of the 19th century, the field of neuroscience made a major step forward due to improvements in staining made by Camillo Golgi and its use by Santiago Ramon y Cajal to visualize neurons. Since the late 1950s, the development of techniques in molecular biology allowed to better understand how neurons correctly extend their axons and dendrites to form an intricate network. Several guidance cues that showed graded distributions at various stages of development helped to explain how the axon correctly navigates to its destination. However, several questions about the shape of the gradients or their combinations still remain unanswered. For example, how minute changes in protein distributions would influence guidance? How small discontinuities or variations in protein gradients would be perceived? Is there a noise limit in a gradient for growth cones or cells to correctly sense direction? However, most of the techniques already existing to mimic in
vitro the protein distributions that are found in vivo are not precise enough, and when they
are, most of the time their complexity limits their usage in typical life science laboratories.
This thesis presents a novel technique to fabricate substrate-bound protein patterns, laser-assisted protein adsorption by photobleaching (LAPAP). This technique can fabricate protein patterns with micrometer resolution, 2D control on protein distributions and great dynamic range in terms of concentration. This introduction will provide a basic background of the nervous system, axonal guidance and the various families of cues, as well as a description of commonly used protein patterning techniques.
3
1.1 The nervous system
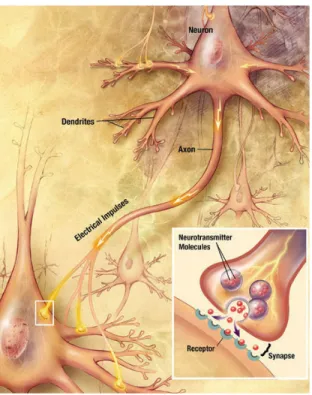
During development, cells of living organisms orchestrate an amazing process during which they divide and differentiate in various cell types required for a functional system. Early in the embryogenesis of complex animals, the embryo forms three germ layers: mesoderm, endoderm and ectoderm. At the midline of the embryo, the ectoderm forms the neural plate, which folds on itself to form the neural tube that will later give rise to the central nervous system (CNS). The CNS is composed of the brain, spinal cord and retina. The peripheral nervous system (PNS) is composed of sensory and motor neurons, ganglia (mass of nerve cell bodies) and the nerves that connect them to muscle, tissue and CNS. Two categories of cells form most on the nervous system: glial cells and neurons. Glial cells main function is to provide structural support and bring nutrient to neurons as well as to form myelin in order to electrically insulate axons. Neurons, the most fundamental component of the nervous system, have the property of being able to communicate with other neurons via electrical or chemical synapses (Figure 1.2). To communicate, neurons receive signals via their dendrites, which are arborized processes extending away from the soma, the cell body of the neuron. If sufficient synapses receive signals in a coordinated manner, the sum of electrical signals directed towards the soma by the dendrites will reach the threshold required for an action potential to be formed and travel along the axon to communicate with other neurons or specific cells. The axon is a tube-like structure that can extend over long distances with particularly high accuracy
during development; this phenomenon called axon guidance has been investigated for more than hundred years and several questions still remain elusive [3-6].
Figure 1.2: Representation of a neuron showing its different components: cell body (soma), dendrites, axon and synapse. Electrical signals are directed towards the soma via the dendrites and induce an action potential that will travel along the axon to induce the release of neurotransmitters at the synapse to communicate with another neuron (Reproduced from the brochure ‘‘Alzheimer's Disease: Unraveling the Mystery’’ from the National Institute of Aging).
1.2 Axon guidance
More than a century ago, Ramon y Cajal showed that the nervous system was composed of individual cells, the neurons, and not from a continuous network as it was
5
previously thought. Moreover, he made observations of a club-shaped structure at the end of axons that he named ‘growth cones’. Even though, he was observing growth cones in static images, he correctly hypothesized that these structures were responsible for guiding the axon to their appropriate target. In 1907, Ross G. Harrison developed a new tissue culture technique that allowed seeing, for the first time, the motility of the growth cone [7]. One fundamental question still remained: How was the growth cone at the tip of the axon guided? During the 30’s and the 40’s, it was widely believed that axons were guided in a restrictive mechanical manner [8]. However, work from Roger W. Sperry showed that axonal guidance was most probably due to distributions of chemical cues [9]. In this work, he severed the optic nerve linking the retina to the optical tectum of Xenopus and then rotated the position of the eye 180 degrees in its socket, before he allowed the nerve to regenerate. The position of retinal ganglion cells (RGC) in the retina was inverted compared to their original location. If axons were to regenerate in restrictive mechanical manner, the axons would extend to the optical tectum and connect to target corresponding to their new position, resulting in accurate vision for the frog. However, axons of RGCs were able to reconnect to their original target in the optical tectum and the frog saw an inverted world. From these findings, Sperry suggested the presence of at least two different perpendicular molecular gradients that would be responsible for the retino-tectal mapping. The search for these molecular cues led to the discovery of one of the family of guidance proteins: the ephrins.
In this section we will cover the four principal families of guidance cues: ephrins, semaphorins, netrins and Slits, and other guidance cues such as morphogens, extracellular matrix, growth factors and neurotransmitters, as well as their effect on the cytoskeleton to induce growth cone turning.
1.2.1 Ephrins
The group of Bonhoeffer developed an in vitro technique named the ‘stripe assay’ that allowed testing the preference of RGCs axonal growth between membrane fragments originating from different locations [10]. It is worth noting that this ‘stripe assay’ was the first PDMS microfluidic device used for patterning. Alternating stripes of membranes from the anterior or posterior regions of the tectum were used as a substrate to grow axons from retinal explants. Nasal axons grew on the stripes showing no preference for anterior or posterior tectum. However, temporal axons showed a marked preference for extending on the anterior tectum, which is their natural target (Fig. 1.3). In a subsequent study, heat treatment helped elucidating that temporal axons most probably recognized a repulsive protein that did not affect nasal axons [11]. Years later it was found, by incubating tectal membrane with phosphatidylinositol-specific phospholipase (PI-PLC), that the repulsive protein was anchored to cell membrane by glycosylphosphatidylinositol (GPI) [12]. This 25 kDa protein (first called RAGS for repulsive axon guidance signal, but now known has ephrinA5) was later isolated and comparison of its amino acid sequence showed significant
7
homology with ligands for Eph receptor tyrosine kinases [13]. The same year, it was also shown that ephrinA2 (ELF-1) and its receptor EphA3 (Mek4) were expressed in complementary gradients in the retina and the tectum, respectively [14]. Further evidence showed that EphA receptor and ephrinA interaction was necessary for RGCs axon guidance [15]. Moreover, experiments performed on mice shows that the retinal mapping in the superior colliculus (SC), was dependent on the relative levels of EphAs compared to neighboring cells [16], not the absolute value [17].
690 J. Walter, B. Kern-Veits, J. Huf, B. Stolze and F. B'onhoeffer
y Capillary pore filter
Ahoui 1 mm
Striped membrane carpet , Nitrocellulose filter
. Weight .Retinal explant
Temporal Nasal
Ventral
Fig. 5. (A) Schematic drawing of the experimental design. Two explant stripes out of the central retina (see inset) have been explanted on a striped carpet with anterior and posterior tectal membranes. (B,C) The micrographs represent typical growth patterns of temporal (B) and nasal axons (C) after two days in culture. The lower part gives the rhodamine picture and indicates the distribution of axons. The part above gives the green fluorescence of the FITC beads which were added to the type A membranes (posterior in this case). Type B membranes (from anterior tectum) fill the space between the type A membranes. Nasal axons do not show a preference for one of the stripes. Temporal axons grow
preferentially in the stripes of anterior tectal membranes and leave the stripes of posterior membranes free of neurites. Bar 100[im.
FITC
RITC
Temporal axons Nasal axons
Figure 1.3: Stripes assay showing preference of temporal axons for growth on the anterior tectum instead of the posterior, but no difference for nasal axons. (a) Two retinal explants cultured on alternating stripes of membrane fragments from cells of the anterior (dark stripes) and posterior (FITC labeled stripes) part of the optical tectum. (b and c) Temporal axons preferably grow on anterior membrane stripes while nasal axons show no preference (reproduced from [10]).
Even though EphA receptor family interaction with ephrinA ligands family explained the retino-tectal mapping along the nasotemporal (anteroposterior) axis, this mapping was still not understood for the dorso-ventral (lateral-midline) axis. This was however explained by the discovery of ephrinB, a trans-membrane protein that binds to the EphB receptor [18-20]. EphrinB1 has been shown to attract branches of axons that express EphB receptor [20]. Since the initial axon overshoots its final destination, the portion of axon that travelled too far is eliminated later on and the branching is then responsible for mapping on the lateral-midline axis. Even though the retino-tectal mapping can be explained by two gradients, one of ephrinA and the other of ephrinB in the optical tectum (superior colliculus in mammals) and graded level of their respective receptors, Eph A and B, on the axons of RGCs (Fig. 1.4), this is an overly simplistic model and several protein distributions are necessary for accurate guidance [21].
Ephrins and Eph receptors also play other roles apart from retino-tectal mapping, for example, EphrinB2 and EphB1 have also shown to mediate the axonal divergence at the optic chiasm, which is necessary to establish binocular vision [22]. Even if ephrins are usually the ligands and Ephs the receptors, this can be inverted with Ephs acting as ligands and ephrins as receptors [21]. For example, axons from commissural neurons express high levels of ephrinB1 (acting as receptor) that are guided by EphB receptor (acting as ligand) [23]. The bidirectional signaling of ephrins is also present for GPI-anchored EphrinA [24]
9
and has been shown to contribute to retino-tectal mapping [25] and topographic targeting of vomeronasal axons to the olfactory bulb [26].
Figure 1.4: Schematic distributions of EphA and EphB receptors of axons from cells in the retina and the distributions of ephrin A and B in the optical tectum. The level EphA receptor on growth cones from RGCs is graded (green) as a function of position, with highest concentration from temporal neurons and lowest from nasal neurons. Its ligand, ephrinA, found on the membrane of cells in the optical tectum also forms a gradient (purple) with increasing concentration from anterior to posterior regions. EphB receptors on RGCs also form a gradient (yellow) that increases from dorsal to ventral neurons as well as their ligand, ephrinB, that is graded (red) with increasing concentration from the lateral to the midline region of the optical tectum (reproduced from [5]).
1.2.2 Semaphorins
Semaphorins are a family of signalling proteins that are implicated in the development of the nervous system and other organs [27]. The first semaphorin was identified in grasshoppers [28] and axonal repulsion was demonstrated in vitro by the growth cone collapsing of neurons from chick embryos [29] which led to the discovery of the semaphorin family [30]. Semaphorins are divided into 8 classes (1-7 and V), classes 1 and 2 are found in invertebrates, classes 3-7 in vertebrates and class V in viruses [4]. Semaphorins can either be transmembrane, GPI-anchored or secreted proteins. Class 3 semaphorins (semaphorin-3A-3G), which effect on axonal guidance is the most widely studied, is a secreted protein. The main receptor of class 3 semaphorins receptors that have been identified are the Neuropilins and the Plexins [31]. Neuropilin-1 [32, 33] and Neuropilin-2 [33, 34] can either form homodimers or heterodimers to bind with a dimerized form of semaphorin-3 to either induce axon repulsion (semaphoring-3A) or block that repulsion via competitive binding (semaphoring-3B and -3C) [31]. In Drosophila, Neuropilins are not present, Plexin A [35] and the tyrosine kinase OTK [36] acts together as a receptor complex of semaphorin-1s. In vertebrates, Plexins form protein complexes with Neuropilins to transduce the signal from secreted semaphorin-3s or it can also directly bind other semaphorins [37-40]. Other proteins can also take part in complexes such as the neural cell adhesion molecule (NrCAM) and the tyrosine kinase Met [41-43], as well as β1-integrin [44]. Most of the time, semaphorins act as short-range repellant cues [27]; for
11
example, it repels axons from RGCs once they have reached the midline of the optical chiasm [45] or repels them at the tectum to contribute to the dorsoventral axis mapping [46]. Semaphorins have been repulsive for other neuron types such as commisurals [47], dorsal root ganglion [48], olfactory [49], thalamocortical [50]. It has also been demonstrated that semaphorins can act as an attractive cue [43, 51, 52], moreover repulsion can be converted into attraction by the presence of cyclic nucleotides (cGMP) [53].
1.2.3 Netrins
Netrins genes were first discovered in C. elegans and named unc-6 where they were involved with unc-5 and unc-40 in guiding pioneering axons [54]. DNA sequencing later showed that the protein coded by unc-6, UNC-6, was closely related to the structural protein, laminin [55]. In parallel to these finding, the group of Tessier-Lavigne was looking for a guidance cue for commisural axons attraction from the roof to the floor plate of the spinal cord [56]. This intriguing guidance cue was found to be the vertebrate homologue of UNC-6 [57-59] and named ‘netrin’ based on the Sanskrit word netr meaning ‘to guide’. Floor plate and neural epithelial cells in the spinal cord respectively secrete netrin-1 and netrin-2. Clear turning from commissural neurons in vitro was observed when they were in the presence of a netrin-1 source in co-cultures in biological hydrogel [57, 60]. Direct observation of netrin-1 gradient in the spinal cord later confirmed that it works as a long-range guidance cue [61] (Fig. 1.5). It must be mentioned that netrin-1 is a secreted protein
with high affinity for cell membranes and it is not well understood how far it can diffuse in
vivo [4, 57, 58]. It was also demonstrated that netrin-4 was able to bind laminin-111 by
interacting with its γ1 arms [62]. As it was the case for ephrins and semaphorins, netrins can act both as attractive and repulsive cues [63-65]. Moreover, the concentrations of cytosolic cyclic nucleotide (cAMP) [66] or Ca2+ [67] are able to modulate the response of axons to netrin-1 distributions. The two other genes discovered in C. elegans with unc-6 (coding for netrins homologue) that were responsible for proper guidance of pioneering axons in C. elegans are evolutionary conserved in vertebrates and code for DCC (unc-40 gene) and UNC-5 (unc-5 gene) [68], two receptors of netrins.
Figure 1.5: Netrin-1 (red) distribution secreted from the floor plate (fp) in a cross-section of spinal cord which contributes to the guidance of axons from commissural neurons (cn) towards the ventral midline (reproduced from [61]).
The DCC receptor controls attraction to netrins [68-70], while UNC-5 seems only to be involved in repulsion [65]. It was also found in Xenopus spinal neurons that DCC and
13
UNC-5 could form a complex via their cytosolic domain to regulate the repulsion to netrin-1 [7netrin-1]. It was also reported that the adenosine 2b receptor was also able to bind netrin-netrin-1 [72], however this finding has been challenged by other researchers [73]. Netrins are not only involved in the guidance of commissural neurons; they also help the navigation of RGCs [70, 74] to their correct target and it has been found that at the optic disk, the presence of laminin turns netrin-1 from an attractive to repulsive cue [75] (Fig. 1.6). Similarly, the presence of laminin stops the attraction of vagal sensory axons by netrin-1 [76]. Recently, the influence of netrins on angiogenesis was demonstrated in vitro on human endothelial cells as well as in vivo on zebrafish [77].
958 F. Mann et al.
Netrin-1 guides visual axons out of the eye
One of the first pathfinding tasks of visual axons is to exit the eye through the optic disk, at the retina-optic nerve junction (Fig. 1). RGC axons initially extend along the vitreal surface of the neural retina and follow a centripetal route towards the centre of the retina. Once they reach the optic disk, growth cones make a 90º turn to dive deep in the retina and exit the eye through the optic nerve head. Within the retina, RGC axons grow in close contact with Müller glial cell endfeet and with the vitreal basal lamina, both of which have been shown to express cell adhesion and extracellular matrix molecules, such as NCAM, L1 and chondroitin-sulfate proteoglycans that might stimulate axon growth and provide guidance signal to RGC axons (for review see Stuermer and Bastmeyer, 2000). It remains unclear, however, whether additional signals such as chemoattractants contribute to direct the navigation of RGC axons towards the optic disk. The search for candidate molecules involved in intraretinal pathfinding led to a focus on netrin-1, a laminin-related secreted protein, produced by glial cells at the optic disk and optic nerve head in fish (Lauderdale et al., 1997, Strahle et al., 1997), frogs (de la Torre et al., 1997) and rodents (Deiner et al., 1997), see Fig. 1. Netrin-1 was first reported to function as a long-range chemoattractive cue for commissural axons in the spinal cord (Kennedy et al., 1994, Serafini et al., 1994, Shirasaki et al., 1996). In the retina, however, it is unlikely that netrin-1 acts at long-range to attract RGC axons, since no alteration of the optic disk-directed growth of RGC axons was observed in netrin-1 deficient mice (Deiner et al., 1997). In this mutant, however, although RGC axons can reach the optic disk, they fail to enter the optic nerve head and instead grow aberrantly in other regions of the retina. This failure of many RGC axons to
exit the eye results in a smaller optic nerve and hypo-pigmented streaks at the surface of the retinal pigmented epithelium, probably formed by ectopic axons growing between pigmented cells (Deiner
et al., 1997). Thus netrin-1 appears to act at a short-range to attract RGC growth cones into the optic nerve head. This effect is mediated by signaling involving the netrin-1 receptor, ‘deleted in colorectal cancer’ (DCC) expressed on RGC axons, since netrin-1 and DCC knock out mice exhibit similar retinal abnormalities.
Consistent with the proposed role of netrin-1 as a short-range chemoattractant, recombinant netrin-1 causes attractive turning of Xenopus retinal growth cone in vitro, an effect that can be blocked with antibodies to DCC (de la Torre et al., 1997). In addition, this response can be modulated by the level of cytosolic cyclic nucleotides (Ming et al., 1997, Song and Poo, 1999). For instance, it was shown that, in the presence of a cAMP analogue that activates protein kinase A (PKA), netrin-1-mediated attraction of retinal growth cones is converted into a repulsive activity (de la Torre et al., 1997). Thus, the behaviour of RGC growth cones in response to netrin-1 might be dependent on other concomitant signals that modulate the level of intracellular cAMP. This is the case, for example, for the extracellular matrix protein laminin-1 which is able to abrogate the netrin-1-induced cAMP rise in cultured RGC axons. As a result, laminin-1 changes netrin-1 attraction into repulsion through a mechanism that involves !1 integrin receptor expressed on RGC axons (Höpker et al., 1999). In the developing retina, laminin-1 is abundant in the vitreal basal lamina along which RGC axons navigate. Thus laminin-1 and netrin-1 are co-expressed at the vitreal surface of the optic disk, whereas only netrin-1 but not laminin-1 is found deeper in the optic nerve head (Fig. 1B). The addition of a mimetic peptide of laminin to a Xenopus retinal cup grown in vitro induces the failure of some RGC axon fascicules to leave the eye through the optic disk (Höpker et al., 1999). These results are consistent with the idea that the restricted co-expression of laminin-1 and netrin-1 at the entrance to the optic nerve head results in a repulsive signal that serves to ‘push’ the growth cone away from the retinal surface and grow deep into the attractive netrin-1-rich/laminin-1-poor optic nerve head (Fig. 1B).
Developmental changes in netrin-1 responsiveness in RGC axons
Netrin-1 is expressed in the optic disk/nerve head but also further along the visual pathway (see summary diagram in Fig. 4) where it governs RGC axonguidance, as shown by the abnormal course of visual axons within the ventral hypothalamus of netrin-1- and DCC-deficient mice (Deiner and Sretavan, 1999). Analysis of netrin-1 expression in the brain of Xenopus embryos revealed that netrin-1 expression domains correspond to regions devoid of visual afferents that flank the trajectory of RGC axons (Shewan et al., 2002). This suggests that, although netrin-1 can attract RGC axons in the optic disk, it might function later on as a repellent and tell visual axons where not to go. Consistent with this idea, the in vitro response of RGC axons to a gradient of netrin-1 critically depends on the developmental stages at which axons are assayed. This was shown in a “whole pathway” explant preparation, where RGC axons are challenged with netrin-1 at various points in their journey along the visual pathway (Shewan et al., 2002). Unlike young axons that have not yet exited the eye and show attraction
Fig. 1. Netrin-1 helps to guide the growth of axons out of the eye. (A)
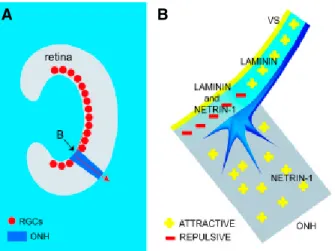
The arrangement of retinal ganglion cells (RGCs; red) along the vitreal surface of the retina (grey) where laminin is located. Axons grow across the vitreal surface and make a sharp bend at the entrance to the optic nerve head (ONH, dark blue; arrow at B) where netrin-1 is localized. (B) A growth cone entering the ONH where it encounters laminin and netrin-1 on the vitreal surface and netrin-netrin-1 only in the ONH. It is hypothesised that the laminin and netrin-1 signals combine to repel axons away from the surface and force axons into the netrin-1-rich ONH, and so out of the eye.
A B
Figure 1.6: In the presence of laminin, netrin-1 becomes repulsive to growth cone from RGCs. (a) RGCs’ axon need to do a right turn to enter the optic nerve head (ONH). (b) Laminin and netrin-1 both act as attractive cues when acting individually, but when combined at the entry of the optic nerve head, netrin-1 act as a repellant which ensure the growth cone turning in the ONH (reproduced from [6]).
1.2.4 Slits
Genetic screening on Drosophila first allowed the discovery of two new genes influencing commissural projections: commissureless and roundabout [78]. Subsequent work showed that Roundabout (Robo) is a new family of receptors evolutionary conserved [79] and Commissureless (Comm) is regulating surface levels of Robo at the growth cone [80]. The midline line repellant of Robo is Slit, a large extracellular matrix protein secreted by midline glial cells [81, 82]. It was also found that Slit repulsive function was evolutionary conserved in vertebrates in the presence of three Slits (1-3) and three Robos (1-3) [83, 84]. Slits presence is necessary to avoid commissural axons to cross the midline a second time, suggesting that the growth cone sensitivity to Slits can switch at the midline. In vertebrates, this switching is coordinated with other guidance cues in such a manner that before crossing axons are attracted by netrin-1 [57, 58] and insensitive to Slits and semaphorin-3s [47], but after crossing they lose their attraction to netrin-1 [85] and become repelled by Slits and semaphorin-3s (see Fig. 1.10). The precise molecular mechanism underlying this switching is not fully understood, but has begun to be elucidated [86]. For example, Rig-1 (Robo3) is acting as a negative regulator of Robo1 before midline crossing, making the growth cone insensitive to Slits [84, 87]. After crossing, Rig-1 is downregulated, which leads to the upregulation of Robo1 and prevents axon recrossing at the midline. In Drosophila, Comm, which is involved in intracellular sorting, when activated traffics Robo for degradation, therefore decreasing the concentration of Robo at
15
the growth cone surface [80, 88]. After crossing the ventral midline, Comm is probably inactivated and Robo concentration at the growth cone increases again preventing the axon to cross a second time (see Fig. 1.7).
Slits and Robos have been identified (Brose et al., 1999; Itoh et
al., 1998; Long et al., 2004). Whether the same combinatorial
Robo code also operates in vertebrates is not clear. One notable difference is that mice lacking Slit1 and Slit2 display midline defects in major forebrain tracts and at the optic chiasm, yet spinal commissural axons appear unaffected (Bagri et al., 2002;
Plump et al., 2002). This is despite Robo1 and 2 also being
conserved in both structure and expression pattern (Kidd et al.,
1998; Long et al., 2004). Only in triple knockouts missing all
three Slits do commissural axons linger at the midline (Long et al., 2004). In the vertebrate forebrain, Slit2 also guides axons before they have crossed the midline. Therefore, in this system, Slit has a different role whereby its repulsive action maintains
axons within a defined channel (Shu et al., 2003). The
groundwork provided by the fly model has also been extended in vertebrates by the finding that, after crossing, the commis-sural axons become additionally responsive to Semas which act in conjunction with Slit to increase the repulsion away from the midline (Zou et al., 2000). An interesting role has been proposed for the more divergent, third vertebrate Robo, named Rig1 (Yuan et al., 1999). Like the other two Robos, Rig1 binds Slit and is produced by commissural axons with the striking difference that it is expressed at high levels before midline
crossing and is downregulated afterwards (Sabatier et al., 2004).
Furthermore, in Rig1 knockout mice, commissural axons fail to cross the midline. This observation, combined with in vitro data, suggests that Rig1 masks the action of Slit upon the other Robo receptors, preventing them from being prematurely repelled by the midline. The surprising conclusion is therefore that its overall effect is actually similar to Comm (Sabatier et al., 2004). Following the exposure of commissural axons to Slit ligand, the cytoplasmic domain of DCC may interact with that of Robo
resulting in a silencing of Netrin-mediated chemoattraction (Stein and Tessier-Lavigne, 2001). This coordination would explain how longitudinal axons can be drawn in by Netrin to enter commissures but do not subsequently re-cross in response to continued attraction. After crossing, the upregulation of Robo serves a dual purpose: to resensitise axons to Slit whilst the Robo–DCC interaction prevents a tug-of-war with Netrin (Fig. 5). Thus, the response to Netrin and Slit can be modulated cell-autonomously by changing the availability and/or interactions of their receptors. This allows a context-dependent reaction to a given guidance molecule and more subtle modification of cues, beyond simply repulsion or attraction. The implications of this and the mechanisms by which it is achieved are examined in a later section.
New tricks for old dogs
Several years have passed since the characterisation of the four families described above. As the human and mouse genomes are annotated in ever greater detail, we will soon have a definitive list, and there will be no more fishing trips for novel molecules. Researchers would be left to explain how millions of axons form precise and intricate connections, directed by only hundreds of genes. One solution is to consider the involvement of molecules traditionally associated with other neuronal functions or even other organs. The reverse certainly occurs since, for example, Slits, Semaphorins, Ephrins and Netrin are all required for vasculogenesis (Eichmann et al., 2005). There is
Fig. 4. Left-hand side: growth cones of longitudinal axons expressing Robo (red) are repelled by a gradient of Slit (yellow shading) produced at the midline (dashed). Comm expression (blue) downregulates Robo and axons cross. After crossing, Comm is turned off and Robo returns to the growth cone. Right-hand side: the complement of Robo receptors on a longitudinal axon determines its sensitivity to the Slit gradient and its lateral position.
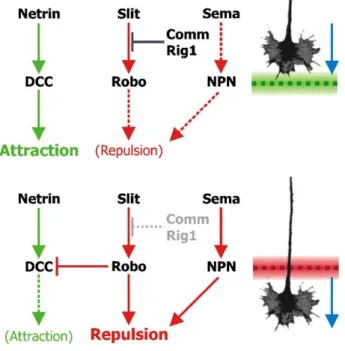
Fig. 5. Different receptors combine to coordinate midline crossing. As a growth cone approaches the midline (top half), netrin binds to DCC to attract the growth cone (gray). Comm (in Drosophila) and Rig1 (in vertebrates) block the action of Robo and inhibit the repulsive action of Slit. The midline is a net attractant (green dashes). After crossing (bottom half), Comm/Rig1 is downregulated, relieving the block on Robo which leads to repulsion by Slit. Robo also inhibits DCC and the attraction by netrin. In addition, growth cones become sensitive to chemorepellent Semaphorin. The midline becomes repulsive (red dashes) and pushes the growth cone away.
17 J.K. Chilton / Developmental Biology 292 (2006) 13–24
Figure 1.7: Switching response to Slits, netrin-1 and semaphorin-3s at the ventral midline of the spinal cord and the role of Comm and Rig-1. Before crossing the midline, commissural neurons are attracted by netrin via their DCC receptors, but are insensitive to Slits due to Comm or Rig1 acting as negative regulators of Robo. After crossing the midline, Comm and Rig1 are inactivated and neurons become repelled by Slit to avoid recrossing and lose their attraction to netrin. Semaphorin is also implicated to avoid recrossing of axons (reproduced from [5]).
Slits are also implicated in the guidance of several neuronal cell types; they act as a repellent for axons from the olfactory bulb [89] and restrict RGCs growth to a defined
regions at the optical chiasm [90-93] and along the optic tract [94] (see Fig. 1.8). Similarly to netrins and semaphorins, Slits can have various functions since they also influence branching and elongation of sensory neurons [95].
the responsivity of the axons to netrin remains to be determined. Several other factors, including reverse-signalling by EphBs acting as guidance cues, BMP receptor 1B and NrCAM also contribute to the targeting of RGC axons to the optic disc and
subsequent exit from the eye (Birgbauer et al., 2000, 2001;
Liu et al., 2003; Zelina et al., 2005). Guidance at the optic chiasm
After leaving the eye, RGC axons run into the developing optic stalk, where they are curtailed to the optic pathway by
inhibitory Sema5A signalling (Oster et al., 2003;Fig. 3B), and
grow toward the brain where they enter at the ventral-most aspect of the diencephalon. There, axons from the two eyes cross over each other to form a characteristic X-shape known as
the optic chiasm (Fig. 2). The factors determining the invariant
place at which the chiasm forms are beginning to be elucidated (Table 1).
Shh, in addition to be expressed at the retina, is present along the entire axial midline of the chick embryo prior to the arrival of the RGC axons. As the first RGC axons approach this area, Shh is downregulated specifically at the optic recess level, a spatiotemporal change that, by alleviating a block on RGC
axon extension, is critical for chiasm formation (Trousse et al.,
2001). In Pax2 null mice and the equivalent noi zebrafish
mutant, the chiasm fails to develop and this is associated with
persistent expression of Shh in the optic recess (Torres et al.,
1996; Macdonald et al., 1997). This suggests that, in contrast to
the retina (see above) Shh acts in the chiasmatic region as an inhibitor of RGC axon extension. In vitro, Shh has a dual effect
on RGC axons depending on its concentration (Kolpak et al.,
2005). Thus, one possibility for this differential responsivity of
RGC axons in the retina and chiasm is different levels of Shh expression. Alternatively, intrinsic changes in the RGC axons as they navigate through the optic pathway, for example in cyclic
nucleotide levels (see below) or receptor expression (Bourikas
et al., 2005) could modulate the response. Further studies will be required to elucidate the basis for this change in Shh function in the retina and chiasm. Slit molecules also are expressed in the diencephalic area and, through inhibitory signalling via Robo2, outline the precise position along the
midline neuroaxis at which the optic chiasm develops (Erskine
et al., 2000; Fricke et al., 2001; Hutson and Chien, 2002; Plump et al., 2002) (Fig. 3B).
In binocular species, once RGC axons are in the right position and approaching the midline, they have to decide whether to cross or remain uncrossed. Work in Xenopus indicated that ephrin-Bs play an important role in inducing
divergence at the midline (Nakagawa et al., 2000). Further
studies in mice expanded upon these findings and demonstrated that ephrinB2/EphB1 signalling is crucial for the formation of
the ipsilateral projection (Table 1). EphrinB2 is expressed by
chiasmatic radial glia at the time ipsilateral axons are turning at the midline and is not only sufficient but also necessary for the
formation of the ipsilateral projection (Williams et al., 2003;
Fig. 3B). A receptor for ephrinB2, EphB1, is expressed highly
Fig. 3. Key families of guidance cues encountered by RGC axons as they navigate through the mouse optic pathway. (A) Guidance within the retina. Slits acting via Robo2, Shh and cell adhesion molecules (not shown) direct growth to the optic disc where netrin-1 acts locally to guide the RGC axons out of the eye. (B) Guidance at the chiasm. Growth is constrained to the optic nerve through repulsive signalling mediated by Sema5A and at the chiasm, by inhibitory Slits and Shh. At the midline, RGC axons from the VT region of the retina that express EphB1 are repelled by ephrinB2 generating an ipsilateral projection with crossing of the midline being facilitated in part by NrCAM. (C) Topographic mapping of RGC axons in the superior colliculus (SC). Relative levels of EphA receptors on the RGCs and gradients of ephrinAs in the SC determine topographic mapping of the RGC axons along the A–P axis of the SC. The balance of attractive EphBs/ephrinBs and repulsive Wnt/Ryk signalling regulates mapping along the M–L axis. D, dorsal, L, lateral, M, medial, N, nasal, T, temporal, V, ventral. See text andTable 1for details.
Figure 1.8: Schematic view of RGCs axon elongation and the presence of Slits around the chiasm which allow growth only in restricted regions. Semaphorins are also present and act as repellant to restrict growth before the chiasm. EphrinB2 is as well present at the chiasm to determine which axons are allowed for crossing, depending on their original location in the retina (reproduced from [74]).
1.2.5 Morphogens
Even if ephrins, netrins, semaphorins and Slits are still considered the main four families of guidance molecules, they can’t explain the entire axonal path finding decisions. Recently, three families of morphogens have also showed their effect in the proper wiring of the nervous system: Hedgehog (Hh), Wingless/Wnt and Decapentaplegic/Bone Morphogenetic Protein/Transforming Growth Factor-β (Dpp/BMP/TGF-β) [96, 97]. We
17
have seen in previous sections how netrin-1, Slits and semaphorin-3s collaborate to appropriately guide axons from commissural neurons towards the floor plate, and subsequently turn and cross the midline [47, 57, 58, 84, 87]. As if this was not complicated enough, three morphogens also contribute to the guidance of commissural axons [96].
Morphogens are secreted proteins that control differentiation in the developing organisms, and they are often found in graded distributions [98, 99]. Along a morphogen gradient, cells are subjected to different absolute protein concentrations that will result in modulated gene expression. This will result in cell fate that will vary as a function of position in the gradient. A good example of their implication in neuroscience is the neuronal specification in the developing spinal cord [100]. More specifically, a gradient of the morphogen Sonic hedgehog (Shh) secreted from the notochord and the floor plate is in part responsible for the fate of neuronal progenitors in the ventral spinal cord [101, 102]. Other mophogens are also implicated in the fate of neuronal progenitors in the spinal cord; Wnt (contraction of wingless and integration) and BMP (bone morphogenetic protein) [97] (Fig. 1.9a).
Two BMPs secreted from cells in the roof plate, BMP7 and GDF7, have shown to repel commissural axons away from the floor plate [103] by forming heterodimers [104] (Fig. 1.9b). A gradient of Shh, similar to the Netrin-1 gradient also attracts the axons towards the floor pate [105] (Fig. 1.9b). Then once the axons have crossed the midline, they

![Figure 1.5: Netrin-1 (red) distribution secreted from the floor plate (fp) in a cross-section of spinal cord which contributes to the guidance of axons from commissural neurons (cn) towards the ventral midline (reproduced from [61])](https://thumb-eu.123doks.com/thumbv2/123doknet/2160329.9612/42.918.182.643.585.828/figure-netrin-distribution-secreted-contributes-guidance-commissural-reproduced.webp)


![Figure 1.11: Proteins directly implicated in cytoskeletal modifications of F-actin (green) and microtubule (pink) during axonal guidance (adapted from [129])](https://thumb-eu.123doks.com/thumbv2/123doknet/2160329.9612/52.918.89.750.462.711/figure-proteins-directly-implicated-cytoskeletal-modifications-microtubule-guidance.webp)