OATAO is an open access repository that collects the work of Toulouse
researchers and makes it freely available over the web where possible
Any correspondence concerning this service should be sent
to the repository administrator:
[email protected]
This is an author’s version published in:
https://oatao.univ-toulouse.fr/22038
To cite this version:
Islam, Saif ul and Pierson, Jean-Marc and Javaid, Nadeem A Novel
Utilization-aware Energy Consumption Model for Content
Distribution Networks. (2017) International Journal of Web and
Grid Services, 13 (3). 290-314. ISSN 1741-1106
A Novel Utilization-aware Energy Consumption Model
for Content Distribution Networks
Saif ul Islam
Department of Computer Science,
COMSATS Institute of Information Technology, Park Road, Islamabad 44000, Pakistan
E-mail: [email protected]
Jean-Marc Pierson
IRIT, University Paul Sabatier, 118 Route de Narbonne,
F-31062 Toulouse CEDEX 9, France E-mail: [email protected]
Nadeem Javaid
∗Department of Computer Science,
COMSATS Institute of Information Technology, Park Road, Islamabad 44000, Pakistan
E-mail: [email protected]
∗Corresponding author
AbstractRapid increase in Internet worldwide users is leading a trend towards grand geographical distributed systems. Content Distribution Networks (CDNs) are one of the popular large scale distributed systems managing around 40con-tribution in CO2 footprint, it is very important to manage resources efficiently and to control energy consumption in CDNs. Though different studies propose solutions to reduce energy consumption but there is less concentration on analyz-ing energy consumption and resource utilization. In this paper we have evaluated resource utilization and ultimately energy consumption under different scenarios. We have proposed utilization-aware energy consumption model. We have consid-ered one of the most popular request redirection policy i.e. load- balance. Quality of Experience (QoE) metrics like overall delay in client requests completion and dropped requests are also evaluated. Extensive simulation is performed by vary-ing CDN infrastructure size, client requests traffic volume and intensity of end user requests.
Keywords: Content Distribution Networks; Resource Utilization; Energy Consumption
Biographical notes: Saif ul Islam received his PhD in Computer Science at the University Toulouse III Paul Sabatier, France in 2015. Previously, he did his Mas-ter by Research in CompuMas-ter Science from University of Limoges, France. He is Assistant Professor at the Department of Computer Science, COMSATS In-stitute of Information Technology, Islamabad, Pakistan. He has been part of the
European Union funded research projects during his PhD. His research interests include resource and energy management in large scale distributed systems and in computer networks.
Jean-Marc Pierson serves as a Full Professor in Computer Science at the Univer-sity of Toulouse (France) since 2006. He received his PhD from the ENS-Lyon, France in 1996. He was an Associate Professor at the University Littoral Cote-d’Opale (1997-2001) in Calais, then at INSA-Lyon (2001-2006). He is a member of the IRIT Laboratory and Chair of the SEPIA Team on distributed systems. His main interests are related to large-scale distributed systems. He serves on several PCs and editorial boards in the Cloud, Grid, Pervasive, and Energy-aware com-puting area. Since the last years, his researches focus on energy aware distributed systems, in particular monitoring, job placement and scheduling, virtual machines techniques, green networking, autonomic computing, mathematical modeling. He was chairing the EU funded COST IC804 Action on “Energy Efficiency in Large Scale Distributed Systems” and participates in several national and euro-pean projects on energy efficiency in large scale distributed systems. For more information, please visit http://www.irit.fr/ Jean-Marc.Pierson.
Nadeem Javaid (Senior Member IEEE) completed his PhD from the University of Paris-Est, France, in 2010. Previously, he has done Masters in Electronics from Quid-I-Azam University, Islamabad, Pakistan. Recently, he is working as an Associate Professor, and founding head of ComSens (Communications over sensors) research group in the Department of Computer Science, COMSATS In-stitute of Information Technology, Islamabad, Pakistan. He has supervised 50 MS and 4 PhD theses. He has published 250+ papers in international journals and conferences. He is editor and reviewer of many journals. He has been organizer and TPC member of several international conferences, like, BWCCA, AINA, ANT, SEIT, Globecom, ICC, etc. His research interests include wireless ad-hoc networks, wireless sensor networks, energy optimization in smart grids, SDNs, etc.
1 Introduction
During last few years, there is explosive increase in Internet users as shown in Figure 1. These users are dispersed geographically all over the world. This rapid increase created a need to distribute services at a large scale. Also these systems should be powerful and scalable enough to accommodate widely spread users. This motivated researchers and orga-nizations to introduce large and effective systems. This change caused a trend towards large scale distributed systems. These systems require a huge amount of resources to perform their operations. All these resources need power to work. As a result, a big amount of energy is consumed by these systems. Power cost is an important part of overall product cost. Cus-tomers and manufacturers are interested in cheaper options. Similarly, increasing amount of energy consumption is a reason for augmenting CO2footprint in atmosphere by Information
and Communication Technologies (ICTs). Currently ICT industry is contributing around 2%. This is creating environmental problems. Government agencies and environmental or-ganizations are taking measures to overcome this problem [1]. Moreover, with the passage of time Internet usage is not simpler like sending email or consulting text web-pages. With the advancement in technology, Internet traffic also became advanced. Internet users access multimedia contents, graphically rich files and online television streaming etc. This kind of Internet traffic requires efficient services. Also, users demand an augmented quality of
experience. This trend created an atmosphere of competition among service providers. Ul-timately, Internet vendors are obliged to deploy high energy consuming devices to fulfill the requirements of Internet traffic and to provide better services as compared to their competi-tors. All above discussed issues caused an immense increase of energy consumption in large scale distributed systems. It has become very important to control energy increase in such systems. As a first step, it is obligatory to know energy consumption behavior in large scale distributed systems. This can lead us to point out potential areas to target energy reduction. Energy management in large scale distributed systems is hot research domain. Researchers are contributing in energy efficient large scale distributed systems [2, 3, 4, 5, 6, 7, 8] .
Figure 1 Internet users during last few years [9].
One of the popular example of large scale distributed systems is content distribution network, also called content delivery networks. According to [10], CDNs will handle around two-third (62%) of Internet traffic by 2019 globally, up from 39% in 2014. It consists of geographically distributed network of surrogate servers which are responsible to deliver web content and rich media to Internet users. It contains content as multiple copies on strategically dispersed surrogate servers. Figure 2 shows a typical CDN architecture. At large scale, it can have many hundreds of servers around the world, making it possible for the content provider to send the same web content to several users in an efficient and reliable way. Content delivery is performed even when bandwidth is limited or there are peaks in demand. The world’s largest content delivery network Akamai International have more than 175, 000 servers in more than 100 countries around the world. It uses a basic methodology of edge caching to speed the delivery of content to client computing devices. Edge caching is storing replicas of all type of content in many surrogate servers around the edges of the Internet, so that client requests can be served by a local edge server rather than by a remotely placed origin server. End users experience a faster delivery of websites and web applications. It is well appropriated for distributing audio, video, and Internet television (IPTV) programming. It depends on the requirements of Internet service provider (ISP) who can also use it to deliver static or dynamic Web contents. Explosive
increase in streaming of rich media contents and higher customer requirements about quality of experience (QoE) is setting a trend to deploy private CDNs. It provides content and applications owners like e-commerce web-sites, media properties, and cloud computing enterprises the benefits of improving users’ experience which ultimately increases customer loyalty, lower abandonment rates and augment ad impressions. It makes content delivery process more secure, for example to help to absorb and mitigate a denial of service attack. A.Feldmann et al. [11] have analyzed the energy trade-offs among different content delivery architectures. They took three content distribution architectures (data centers, Peer-to-peer and CDN). They conclude that CDNs are clear winner in terms of total energy costs among all three described content delivery architectures. Lynar et al. analyze different grid workloads and examine the impact of a number of resource allocation policies on energy consumption [12]. Different solutions have been proposed to conserve energy consumption in CDN. One of the popular techniques is to turn-off or to sleep surrogate servers which have lower loads. This technique uses the method of anti-load-balancing [13]. Cluster-level shut-down techniques are also proposed [14] to conserve energy. But, our purpose is not to propose energy conservation techniques, rather to analyze energy consumption trends under different scenarios. However, it can help researchers to find opportunities to conserve energy.
Load models focus on working hosts only and are sufficient to compute energy con-sumption for servers which are active 24/7 [15]. On the basis of computed values, it is equally possible to provide a general assessment of the system by the help of Green per-formance indicators [16]. Load models consider the utilization of servers. After switching on surrogate servers, their active energy consumption is function of their utilization. We adopted this form of model which is suitable in our case.
In order to evaluate a CDN, it is important to know how resources are utilized. It is observed that in normal conditions, surrogate servers average utilization remains low as compared to their capacity [13]. In this paper, we have evaluated surrogate servers average utilization under different scenarios i.e. by changing number of requests, varying frequency of client requests and using different number of surrogate servers. However, energy consumption behavior is very important to know to proceed towards energy saving mechanisms. In our work, we have evaluated energy consumption trends in surrogate servers under various scenarios as discussed previously. We also considered the energy cost of individual client request. It is important to note that energy consumption of transporting contents is not included in the scope of this study. The basic purpose is to enhance user experience. When a client makes a request for some particular content, he expects less delay in content serving. Higher delays in content serving effect quality of experience of end users. A metric of mean response time of client requests is used to have an idea of global user experience towards services. So, mean response time of user requests is important to evaluate. In this paper, we have evaluated mean response time of client requests under all proposed scenarios. Hit ratio is also computed to have a view of performance.
2 CDN Utilization
A surrogate server is considered to be utilized when it receives content request from end user. A content request can be served in three different ways depending upon request redirection mechanism.
Figure 2 A typical CDN architecture.
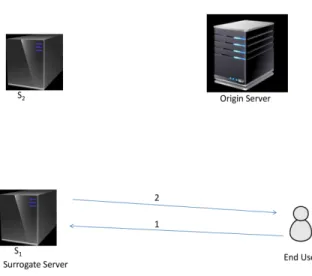
1. When an end user sends a request for a content. As shown in Figure 3, end user request is forwarded towards a surrogate server s1. When s1 receives a request, it locks a
resource. It checks for required content in its cache. If content exists in cache, it sends content to end user. Hence, content request is completed.
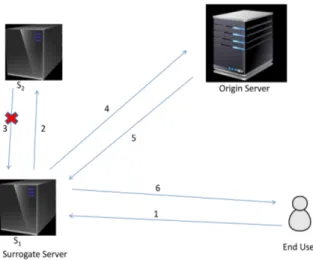
2. If s1does not have requested content, neighbors can cooperate to complete content
request as shown in Figure 4. In case of cooperation, it forward content request to s2.
Upon receiving content request, s2also locks a resource. It checks for content in cache.
If it has requested content, it sends to s1which updates cache and finally sends content
to end user.
3. If s1and its neighbors do not have requested content in the caches, then s1pulls content
from origin server as shown in Figure 5. s1 updates content in cache and sends it to
end user.
Utilization of a surrogate server s, can be modeled as ratio of current number of client requests s is serving to its capacity [17]. Utilization ratio (U tilRatio) of s during the time intervals from t1to t2is computed as
U tilRatios[t1,t2]=
ReqCurrs[t1,t2]
ReqM axs
(1)
ReqCurr shows current number of client requests surrogate server s is serving. A capacity of surrogate server is presented as ReqM ax. So, utilization (U til) of a surrogate server s between time intervals tiand tj(tj> ti) is computed as:
U tils[ti,tj ] =
Pj−1
k=iU tilRatios[tk,tk+1](tk+1− tk) tj− ti
Figure 3 Surrogate server s1have requested content in its cache and serves it to end user.
Figure 4 Surrogate server s1does not have requested content and cooperates with neighboring server s2to serve requested content to end user.
Hence, utilization U til of a surrogate server s during a life time T of an experiment will be:
Figure 5 Surrogate server s1pulls requested content from origin server, in case when neither s1 nor s2has requested content in their caches.
3 CDN Energy Consumption
Surrogate servers have the main role to distribute content in content distribution net-works. They are one of the major contributor of energy consumption. When a surrogate server has no activity, it spend constant power which is also called idle power consump-tion. When it is utilized, its power consumption is augmented from constant power. The power consumption caused by utilization of a surrogate server is called dynamic power consumption. In this context, energy consumption is considered to be proportional to the ratio of current requests a surrogate server is serving against maximum number of requests a surrogate server can handle. Energy consumption in surrogate servers is computed by using metric of surrogate server utilization. When a surrogate server s is turned on and it does not have any request to serve, it consumes a constant power PConss. It shows least possible power consumed by s. When a surrogate server is fully loaded by end user requests, it consumes PF ulls. Rest of power consumed by s depends on its utilization. Hence, power consumption of surrogate server s between time intervals t1and t2is Ps:
Ps[t1,t2]= PConss+
ReqCurrs[t1,t2]
ReqM axs
(PF ulls− PConss) (4)
Energy consumption between time tiand tjE[ti,tj]can be calculated as [17]:
Es[ti,tj ] = j−1 X k=i Ps[tk,tk+1]∗ (tk+1− tk) (5) Es[ti,tj ] = j−1 X k=i (PConss+ ReqCurrs[tk,tk+1] ReqM axs (PF ulls− PConss)) ∗ (tk+1− tk) (6)
Es[ti,tj ] = (tj− ti) ∗ PConss+ 1 ReqM axs (PF ulls− PConss) j−1 X k=i ReqCurrs[tk,tk+1]∗ (tk+1− tk) (7)
When we link utilization and energy consumption models, we obtain:
Es[ti,tj ] = (tj− ti) ∗ PConss+ (PF ulls− PConss) ∗ Us[ti,tj ] (8)
Energy consumed E by a surrogate server s from time when it is turned-on till the end of execution time T during an experiment is shown as follows:
Es= Es[0,T ] (9)
The model is based on generic linear utilization aware approach that is enough flexible and scalable to be suitable from individual server level to federated cloud systems.
4 Load-Balancing in CDN
One of the most popular request redirection policy in CDN, known as load-balancing is to distribute the load of client requests evenly among surrogate servers [13, 18, 19, 20, 21, 22, 23, 24]. The basic purpose of this policy is to enhance performance by spreading the load of requests across multiple servers in order to ensure that surrogate servers do not get overloaded. Load-balancing also avoids congestion of requests traffic towards fewer servers hence clients observe augmented quality of experience.
Different methods are used to get load-balancing mechanism. For example, Round robin, Least Connections and Predictive Node. According to Round robin technique, the load balancer distributes the traffic equally among all surrogate servers, regardless of existing load and performance. Least Connections techniques assign newly arrived requests to server in the pool with the least connections. In Predictive Node method, surrogate servers in the pool are observed over time and trends are analyzed. The load balancer sends requests to the surrogate server that it believes will soon have the best performance.
We have considered Load-balance policy for request redirection. According to this pol-icy, client requests are forwarded to surrogates randomly. We considered Zipf’s distribution to distribute load among surrogate servers. We used zipfUnbalance parameter having values from 0 to 1. For load-balance policy zipfUnbalance parameter z is set to 0. The value 0 of zipfUnbalance parameter z creates uniform distribution. According to this policy all the surrogate servers have equal probability to serve the client requests. So, the content requests from the clients to the servers can be redirected to any of them. Therefore all the surrogates have the equal chance to get the client demands throughout the execution time. The advan-tage of the policy is to improve the performance by balancing the workload intelligently. Instead of concentrating on fewer servers, the requests are distributed to all of the available servers. The availability of the surrogate servers is important in case of better quality of experience. This policy is useful when high availability of the services is required.
5 Simulation Testbed
In order to evaluate the energy consumption and quality of services of CDN over different configurations we need a testbed that provides us analytical simulation environment because the CDN real time applications are hard to get for research purposes. This environment includes:
• System model simulating the CDN infrastructure • Network topology generator
• Website generator
• Client request stream generator
5.1 System Model:
A suitable simulation environment for this purpose is CDNsim [25]. CDNsim simulates a main CDN infrastructure and is implemented in the C++ programming language. It is based on the OMNeT++ library which provides a discrete event simulation environment. All networking issues, like surrogate server selection, propagation, queuing, bottle-necks and processing delays are computed dynamically via CDNsim, which provides a detailed implementation of the TCP/IP protocol, implementing packet switching, packet retransmis-sion upon misses, freshness, etc. It allows to add new client redirection policies.
We consider the case of 100 identical surrogate servers where each server can handle 500 connections at the same time. These surrogate servers are located in different locations of the world. Cache size of the surrogate server is described in the percentage bytes of the total size of the content provider’s website. The caches of the surrogate servers are updated regularly using LRU cache replacement policy. It means that the most recently requested objects are retained in the cache and the older are removed to save the space. The clients are divided into 100 groups distributed all over the world.
5.2 Network Topology:
We used a real Internet topology of AS-level, having 3037 routers, that consists of routing data collected from 7 BGP peers dispersed at different locations. The backbone network topology has a set of routers. The other network entities like surrogate servers, origin server and clients are connected randomly to the router backbone. The clients and servers’ distributions have an impact on the system performance. According to Akmai International quarterly report [26], global average connection speed for broadband Internet remained 4.6M bs in the second quarter of 2014. Speed of the link is set to 6 Mbps, in order to have meaningful utilization of the surrogate servers without disturbing the generality.
5.3 Website Generation:
A synthetic but realistic website having 50000 objects of 1GB total size, is generated. For the size of the objects, Zipfian distribution is used [27]. Parameter z is used to modify the distribution.
5.4
Requests Stream Generation:
A request stream generator is used that takes the website graph and generates requests stream using random walks [27].
5.4.1
Popularity Distribution:
Not all the website objects are requested with the same frequency. Popularity of the objects in a website graph is considered using Zipfian distribution [27]. The higher values of the parameter z cause the handling of most of the requests to the smaller number of objects.
5.4.2
Popularity-size Correlation of Objects:
As different objects in a website can have different popularity and size. There may and may not be a correlation between size and popularity. The correlation between size and popularity is considered to have the values in a range from −1 to 1. Negative values indicate that an object smaller in size will have more popularity than the larger ones and vice versa. The value 0 lies in between the two extremes where objects popularity is not related to the size of the objects.
Table 1 shows summary of simulation parameters, used in our experiments.
5.5
Evaluation Metrics:
In order to proceed gradually, first we tested our approach with a warm-up phase of a 50000 requests of traffic (not shown here). After that we performed the experiments with the traffic of 1 million of requests, that is evaluated here. The following measures have been taken into account.
5.5.1
Utilization of Surrogate Servers.
We compute the average of each surrogate servers’ utilization. The values of surrogate servers’ utilization range from 0 to 1 (see Section 2). The higher values indicate that most of the time a surrogate server was busy to handle the content requests.
5.5.2
Surrogate Server Energy Consumption.
It is the power consumed by a surrogate server or a set of surrogates during a time period. We evaluated energy consumption in joules (see Section 3).
5.5.3
Energy Per Request.
It is average energy consumed in Joules by a request during the simulation process. It is obtained by dividing the total energy consumed during the simulation divided by the total number of requests.
5.5.4
Mean Response Time for Client Requests.
It exhibits the average user experience to the CDN. It is the ratio of the summation of the time taken to fulfill all client requests to the total request number. Lower values of mean response time are desired to quickly serve required contents.
Table 1 Summary of simulation parameters
Parameter Experiment set 1 Experiment set 2
Website size 1GB
Website number of objects 50000
Website z for size 1
Size vs. popularity correlation 0
Number of requests
2 × 10⁵, 4 × 10⁵,
6 × 10⁵, 8 × 10⁵, 106
106
Mean interval time of requests 0.0033
0.01, 0.005, 0.0033, 0.0025, 0.002, 0.00125 Distribution of the interval time exponential
Requests stream z 1
Link speed 16M bps
Network topology backbone type AS
Number of routers in network
back-bone 3037
Number of surrogate servers 10, 20, 30, 40, 50 30
Processing specifications Intel (R) Xeon (R) E5620 Number of incoming connections
per surrogate server 500
Number of outgoing connections
per surrogate server 500
Number of client groups 100
Number of content providers
(Ori-gin server) 1
Number of incoming connections
per origin server 3500
Cache size percentage of the
web-site’s size 40%
Cache replacement policy LRU
Load-unbalancing parameter
(Zi-fUnbalance) z value 0
5.5.5
Hit Ratio.
It is the ratio of served client requests to the total requests, served by a surrogate server without cooperation with other surrogate server or origin server. It is presented in percentage. Higher values of hit ratio are desired since they cause lower response times and minimal cooperation [28].
5.5.6
Failed Requests.
It exhibits client requests for contents which are not fulfilled. It is also called aborted requests. This is shown in percentage value. Lower values of failed requests shows better QoE. Higher number of failed requests are caused due to different factors like congestion on surrogate servers, unavailability of services etc.
6
Results
2 3 4 5 6 7 8 9 10 x 105 0 0.05 0.1 0.15 0.2 0.25 0.3 0.35Servers average utilization
Number of client requests 10
20 30 40 50
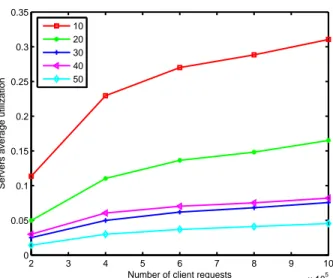
Figure 6 Surrogate servers average utilization vs. number of client requests for different number of surrogate servers.
6.1 Surrogate Server Utilization:
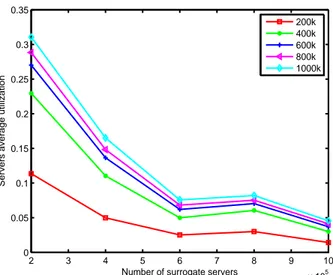
Figures 6 and 7 show the average utilization of the surrogate servers for different number of surrogate servers to serve different number of client requests. The x-axis represents number of client requests. Utilization of the surrogate servers has a non linear relation with the number of surrogate servers as shown in Figure 7. It decreases with the increase in the number of surrogate servers except in case of 30 and 40 surrogate servers where utilization is very close. The utilization curve becomes lower as the number of servers increases from 10 to 50. In case of 10 surrogate servers, the average utilization curve shows the highest
2 3 4 5 6 7 8 9 10 x 105 0 0.05 0.1 0.15 0.2 0.25 0.3 0.35
Servers average utilization
Number of surrogate servers
200k 400k 600k 800k 1000k
Figure 7 Surrogate servers average utilization vs. number of surrogate servers serving different number of client requests.
0 0.1 0.2 0.3 0.4 0.5 0.6 0.7 0.01 0.005 0.0033 0.0025 0.002 0.00125
Servers average utilization
Mean inter-arrival time of requests 30
Figure 8 Surrogate servers average utilization vs. mean inter-arrival time of client requests. A case of 30 surrogate servers serving 1000k requests.
values while in case of 50 servers the utilization of the surrogate servers is the lowest. The reason for decrease in the utilization is, if we increase the number of surrogate servers for the same number of client requests then the client requests will be divided into smaller parts. In this case, smaller infrastructure shows better utilization than bigger infrastructure while balancing the client requests load. It is the number of requests and the duration of serving a request that makes the utilization of the surrogate servers (see Equation (2)). According to
this policy, there is low congestion at the surrogate servers, as the traffic is divided randomly to all the surrogate servers and the traffic at hand is not too high.
The impact of the number of requests is more important here. The utilization of the surrogate servers increases with the increase in the number of client requests as shown in Figure 6. If we have a constant number of surrogate servers and we increase the number of requests, it takes more time to serve these requests that increases the utilization. In case of 200k requests, the number of requests is very low for the infrastructure which shows very low utilization as compared to the rest.
Surrogate server utilization increases with decrease in inter-arrival time of requests. In other words, we can say, if frequency of client requests for contents is increased the utilization of surrogate servers is also augmented as shown in Figure 8. Figure 8 shows behavior of average utilization of 30 surrogate servers serving client requests with different mean inter-arrival time. When frequency of client requests is lower then surrogate servers have lesser number of connections, hence they have lower loads. Acceleration in client requests for contents augments the number of connections at surrogate server and results into higher loads.
So we can conclude that in the Load-Balance policy, the average utilization of the surrogate servers increases with the increase in the network traffic i.e. number of client requests while the average utilization of the surrogate servers decreases with the increase in the number of surrogate servers.
2 3 4 5 6 7 8 9 10 x 105 0.2 0.4 0.6 0.8 1 1.2 1.4 1.6 1.8 2 2.2x 10 7
Energy (in Joules)
Number of client requests 10
20 30 40 50
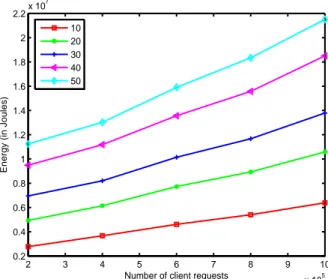
Figure 9 Surrogate servers energy consumption vs. number of client requests for different number of surrogate servers.
6.2 Energy Consumption and Energy per Request:
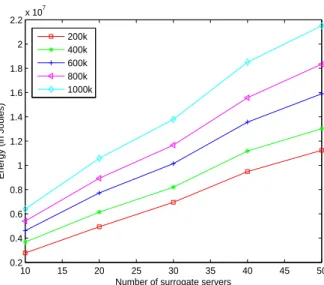
Figures 9 and 10 present the impact of the number of surrogate servers and the number of requests to the energy consumed by the surrogate servers. Figure 10 shows the gradual increase in the total energy consumption by these sets of surrogate servers with increase in number of surrogate servers. There is a linear relation between the number of surrogate
10 15 20 25 30 35 40 45 50 0.2 0.4 0.6 0.8 1 1.2 1.4 1.6 1.8 2 2.2x 10 7
Energy (in Joules)
Number of surrogate servers 200k
400k 600k 800k 1000k
Figure 10 Surrogate servers energy consumption vs. number of surrogate servers for different number of client requests.
5e+06 1e+07 1.5e+07 2e+07 2.5e+07 3e+07 0.01 0.005 0.0033 0.0025 0.002 0.00125
Energy (in Joules)
Mean inter-arrival time of requests 30
30 Standard deviation
Figure 11 Surrogate servers energy consumption vs. mean inter-arrival time of client requests. A case of 30 surrogate servers serving 1000k requests.
servers and the energy consumed by the surrogate servers. A surrogate server consumes constant energy when turned-on, the rest of the energy is proportional to its utilization (see Equation (8)). So, in case of more surrogate servers, utilization of the surrogate servers is decreased but in case of energy consumption, it increases with the increase in the number of surrogate servers. In this case, the impact of the constant energy consumption by surrogate servers is higher than the impact of utilization of the surrogate servers, as surrogate servers have low utilization.
2 3 4 5 6 7 8 9 10 x 105 0 10 20 30 40 50 60
Energy per request (in Joules)
Number of client requests
10 20 30 40 50
Figure 12 Energy per request vs. number of client requests for different number of surrogate servers. 10 15 20 25 30 35 40 45 50 0 10 20 30 40 50 60
Energy per request (in Joules)
Number of surrogate servers 200k
400k 600k 800k 1000k
Figure 13 Energy per request vs. number of surrogate servers, serving different number of client requests.
There is a linear relation between the number of requests and energy consumed by sur-rogate servers as shown in Figure 9. There is increase in energy consumption as the number of requests increases. Smaller number of client requests causes low power consumption in the surrogate servers. More requests increase the simulation time. As energy is directly proportional to the time consumed, so more requests ultimately result in increased energy consumption.
0 50 100 150 200 250 300 0.01 0.005 0.0033 0.0025 0.002 0.00125
Energy per request (in Joules)
Mean inter-arrival time of requests 30
30 Standard deviation
Figure 14 Energy per request vs. mean inter-arrival time of requests. A case of 30 surrogate servers serving 1000k requests.
Figure 11 presents energy consumption by 30 surrogate servers with different frequency of client requests for contents. It shows higher energy is consumed when frequency of client requests is lower and the curve lowers-down when there is increase in frequency of client requests. It is normal because when there are lesser client requests, surrogate servers are also less loaded. Lesser mean inter-arrival time of requests slows down the process of execution of all requests. Hence, surrogate servers are powered-on longer to serve client requests when frequency of requests is lower. Constant power consumption of surrogate servers becomes higher than the dynamic power consumption. Therefore, we observe higher energy consumption by surrogate servers when they have lower loads for longer time. In contrast, when frequency of client requests is increased, though surrogate servers are more loaded but for lesser time. It increases dynamic energy consumption but decreases higher constant energy consumption. When client requests frequency is highly increased which augmented enough dynamic energy consumption and we observe smaller peak in surrogate servers energy consumption e.g. when mean inter-arrival time of requests is augmented to 0.00125.
Figures 12 and 13 show the energy consumed per request over the different number of requests for different number of surrogate servers. Figure 12 shows exponential decrease in the energy consumed per request with the increase in the number of client requests. With the smaller number of client requests, the surrogate server caches are less intelligent. If the surrogate server does not have the demanded object in its cache, it asks to the neighboring surrogate servers. So in case of less traffic of client requests, more cooperation among surrogate servers occurs that causes increase in the energy consumption in the other surrogate servers as well. As the client requests traffic increases the caches of surrogate servers start to be more intelligent and they start to cache the popular objects that increase the probability of serving the contents by the surrogate servers receiving the requests by the clients directly. In that case the overall energy consumption by the platform of the surrogate servers is decreased. The difference of energy consumption among the number of requests decreases
with the increase in number of requests. It is because of gradual increase in smartness of caches.
The energy consumption per request also increases when there are more surrogate servers turned on for serving the same number of client requests traffic (Figure 13). Similar to increase in number of requests, increase in client requests frequency also decrease in energy per request as shown in Figure 14.
2 3 4 5 6 7 8 9 10 x 105 0.65 0.7 0.75 0.8 0.85 0.9 0.95 1
Mean Response Time
Number of client requests
10 20 30 40 50
Figure 15 Mean response time vs. number of client requests for different number of surrogate servers. 10 15 20 25 30 35 40 45 50 0.65 0.7 0.75 0.8 0.85 0.9 0.95 1
Mean Response Time
Number of surrogate servers
200k 400k 600k 800k 1000k
Figure 16 Mean response time vs. number of surrogate servers, serving different number of client requests.
0.4 0.6 0.8 1 1.2 1.4 0.01 0.005 0.0033 0.0025 0.002 0.00125
Mean Response Time
Mean inter-arrival time of requests 30
Figure 17 Mean response time vs. mean inter-arrival time of requests. A case of 30 surrogate servers serving 1000k requests.
6.3 Mean Response Time:
Response time is important for client satisfaction to the service provided. Smaller re-sponse time is better for client satisfaction. Figure 15 shows that as the number of client requests is increased there is a gradual decrease in mean response time for any number of surrogate servers. The reason behind this decrease in response time is when we have small number of client requests, the caches of the surrogate servers are not mature and behave like dumb caches. As there are more requests sent to the surrogate servers to serve, with the increase in demand they start to become smarter since the cache replacement policy (LRU) remove older objects to keep popular ones. The contents which are demanded more frequently (popular contents), the surrogate servers caches try to keep them in their caches and delete the unpopular contents to save the space. When a client requests for the popular content, there is more probability of availability of content in the cache of the server so there are more chances that the content will be served directly by the surrogate server and thus the response time is smaller. While if a surrogate server cache is small or empty, then it does not differentiate among the contents whether popular or unpopular, so when a client requests for the content, if the surrogate server does not have the content in its cache, it asks to the neighboring surrogate servers for the contents. Increase in client requests frequency increases mean response time as exhibited in Figure 17. More requests at the same time increase congestion on surrogate servers which results in delay to serve client requests. But at the same time, more requests make caches of surrogate servers smarter. Which should decrease mean response time. Hence, when impact of cache smartness overcomes impact of delay caused by congestion, we observe decrease in mean response time e.g. response time decreases when client requests frequency is highest (mean inter-arrival time of client requests = 0.00125) in our experiments.
As the client request is not satisfied directly and the request is sent to the other servers, that takes time. The response time for the client request completion is therefore increased.
In Figure 16, any number of servers shows the same behavior of mean response time with the change in the number of client requests as described earlier. The impact of the number of surrogate servers is low. Since the client requests are distributed in an uniform way, which does not cause the problem of congestion on nodes and low bandwidth.
2 3 4 5 6 7 8 9 10 x 105 50 55 60 65 70 75 80 85
Hit ratio (percentage)
Number of client requests
10 20 30 40 50
Figure 18 Hit ratio (%) vs. number of client requests for different number of surrogate servers.
10 15 20 25 30 35 40 45 50 50 55 60 65 70 75 80 85
Hit ratio (percentage)
Number of surrogate servers
200k 400k 600k 800k 1000k
0 20 40 60 80 100 0.01 0.005 0.0033 0.0025 0.002 0.00125
Hit ratio (percentage)
Mean inter-arrival time of requests 30
Figure 20 Hit ratio vs. mean inter-arrival time of requests. A case of 30 surrogate servers serving 1000k requests.
6.4 Hit Ratio:
Figures 18 and 19 illustrate the hit ratio in percentage. It shows the quality of infrastruc-ture management. If a client request is sent for some specific contents, its request is directed towards the corresponding surrogate server. If target surrogate server has the contents, it sends the contents to client and release the connection. If the surrogate server does not have the demanded contents, it needs the cooperation of other surrogate servers. Hit ratio shows the degree of the client requests which are completed directly by the surrogate server that receives the client requests and sends the contents back to client without the cooperation of the other surrogate servers. The direct completion of requests without cooperation helps to minimize the response time. However, impact of smartness of caches remains stable when client request frequency is increased until it reaches up-to a level e.g. We see decrease in hit ratio when mean inter-arrival time of requests is 0.0125 as shown in Figure 20. Figure 19 shows that hit ratio is better when the number of servers is smaller while with the increase in number of surrogate servers, hit ratio decreases. When we have small number of surrogate servers, all the client requests come to these surrogates servers, as explained earlier, with the time, caches of surrogate servers become smarter and start to cache the popular objects that increases the probability of request completion.
The question is why the response time for the smaller number of surrogate servers is higher while having higher hit ratio? The response is : The value of hit ratio depends on the direct satisfaction of client request from targeted surrogate server. Hit ratio does not depend on the time for the completion of request. It does not care if a request takes lot of time to be completed. It does not take into account the congestion on the nodes. A request completion from the path with no congestion and delay and a request completion from the congested path with the double or triple delay have the same value for hit ratio but they definitely have different response time.
6.5
Failed Requests:
When frequency of client of requests is very high then we observe some failed requests (also called aborted requests). When mean inter-arrival time of client requests is 0.00125, the failed requests are 0.5%.
7
Conclusion
Content Distribution Networks are capturing a big part of Internet traffic worldwide. Hence, addressing problems regarding resource utilization and energy consumption in CDN is crucial to cope with the issues of continuously increasing infrastructure size and users of Internet. We have presented how CDN behaves in different scenarios. This paper provides a view of trends for resource utilization, energy consumption and some other important metrics in CDN evaluation. We have also presented a utilization-aware model for energy consumption in CDN. It is found that Internet traffic size and frequency has a considerable impact on CDN metrics. Similarly, CDN infrastructure size also plays an important role in changing CDN behavior. It is observed that :
• CDN resources have better utilization if CDN infrastructure is smaller, client requests traffic is augmented or intensity of load is increased.
• Increase in CDN infrastructure size and client requests traffic volume cause increase in energy consumption. The first is caused due to increase in constant energy consumption while latter is the result of increase in dynamic energy consumption.
• CDN infrastructure does not much impact delay in client requests completion. How-ever, end users experience better delay when CDN becomes mature with higher traffic volumes but increase in frequency of client requests cause higher response time. • Surrogate server caches become smarter by handling more requests but increase in
infrastructure size and increase in intensity impacts it negatively.
• Higher frequency of client requests decrease user experience by dropping some client requests.
Acknowledgement
We would like to thank Mr. Thomas Zilio, Dr. Konstantinos Stamos and Dr. Francois Thiebolt for their great cooperation during this work.
References
[1] Daniel Montoya, Miguel A Rodríguez, Miguel A Zavala, and Bradford A Hawkins. Contemporary richness of holarctic trees and the historical pattern of glacial retreat. Technical Report 2, 2007.
[2] Jean-Marc Pierson. Energy Efficiency in Large Scale Distributed Systems [electronic resource] : COST IC0804 European Conference, EE-LSDS 2013, Vienna, Austria, April 22-24, 2013, Revised Selected Papers. Springer Publishing Company, Incorpo-rated, 2013.
[3] Anne-Cecile Orgerie, Marcos Dias de Assuncao, and Laurent Lefevre. A Survey on Techniques for Improving the Energy Efficiency of Large-scale Distributed Systems. ACM Comput. Surv., 46(4):47:1–47:31, mar 2014.
[4] Sharad S., Bagavathi Sivakumar P., and V Anantha Narayanan. A Novel IoT-Based Energy Management System for Large Scale Data Centers. In Proceedings of the 2015 ACM Sixth International Conference on Future Energy Systems, e-Energy ’15, pages 313–318, New York, NY, USA, 2015. ACM.
[5] Vani Gupta, Stephen Lee, Prashant Shenoy, Ramesh Sitaraman, and Rahul Urgaonkar. Towards Cooling Internet-Scale Distributed Networks on the Cheap. ACM SIGMET-RICS Performance Evaluation Review, 43(1):469–470, jun 2015.
[6] Kevin J Barker, Darren J Kerbyson, and Eric Anger. On the Feasibility of Dynamic Power Steering. In 2014 Energy Efficient Supercomputing Workshop, E2SC ’14, pages 60–69, Piscataway, NJ, USA, 2014. IEEE Press.
[7] Neil Klingensmith, Dale Willis, and Suman Banerjee. A Distributed Energy Monitor-ing and Analytics Platform and its Use Cases. In ProceedMonitor-ings of the 5th ACM Workshop on Embedded Systems For Energy-Efficient Buildings - BuildSys’13, BuildSys’13, pages 1–8, New York, NY, USA, 2013. ACM.
[8] Laurent Lefevre. Impact of application and service knowledge for energy efficiency in HPC. In Proceedings of the 2013 workshop on Energy efficient high performance parallel and distributed computing - EEHPDC ’13, EEHPDC ’13, page 1, New York, NY, USA, 2013. ACM.
[9] Internet Live Stats. Internet Users, 2015.
[10] Executive Summary. The Zettabyte Era : Trends and Analysis. Technical Report May 2015, 2016.
[11] Anja Feldmann, Andreas Gladisch, Mario Kind, Christoph Lange, Georgios Smarag-dakis, and Fritz Joachim Westphal. Energy trade-offs among content delivery archi-tectures. In 2010 9th Conference of Telecommunication, Media and Internet, CTTE 2010, pages 1–6, 2010.
[12] Timothy M Lynar, Ric D Herbert, and William J Chivers. Reducing energy consump-tion in distributed computing through economic resource allocaconsump-tion. Internaconsump-tional Journal of Grid and Utility Computing, 4(4):231–241, 2013.
[13] Vimal Mathew, Ramesh K Sitaraman, and Prashant Shenoy. Energy-aware load balanc-ing in content delivery networks. In Proceedbalanc-ings - IEEE INFOCOM, pages 954–962, mar 2012.
[14] Vimal Mathew, Ramesh K Sitaraman, and Prashant Shenoy. Energy-efficient content delivery networks using cluster shutdown. In 2013 International Green Computing Conference Proceedings, pages 1–10, 2013.
[15] Andreas Berl and Hermann De Meer. An energy consumption model for virtualized office environments. Future Generation Computer Systems, 27(8):1047–1055, 2011. [16] Alexander Kipp, Tao Jiang, Jia Liu, Mariagrazia Fugini, Monica Vitali, Barbara Per-nici, and Ioan Salomie. Applying green metrics to optimise the energy-consumption footprint of it service centres. International Journal of Space-Based and Situated Computing 5, 2(3):158–174, 2012.
[17] Saif Ul Islam and Jean Marc Pierson. Evaluating energy consumption in CDN servers. In Lecture Notes in Computer Science (including subseries Lecture Notes in Artifi-cial Intelligence and Lecture Notes in Bioinformatics), volume 7453 LNCS of ICT-GLOW’12, pages 64–78, Berlin, Heidelberg, 2012. Springer-Verlag.
[18] Eric Sven-Johan Swildens, Richard David Day, and Vikas Garg. Scalable domain name system with persistence and load balancing, 2004.
[19] Philip Shi-lung Yu. Method and apparatus for dynamic interval-based load balancing, 2000.
[20] F Thomson Leighton, Ravi Sundaram, Rizwan S Dhanidina, Robert Kleinberg, Matthew Levine, Adrian M Soviani, Bruce Maggs, Hariharan Shankar Rahul, Srikanth Thirumalai, Jay Gunvantrai Parikh, and Others. Global load balancing across mirrored data centers, 2006.
[21] Andrew T Davis, Nate Kushman, Jay G Parikh, Srinivasan Pichai, Daniel Stodol-sky, Ashis Tarafdar, and William E Weihl. Method of load balancing edge-enabled applications in a content delivery network (CDN), 2010.
[22] Yun Bai, Bo Jia, Jixiang Zhang, and Qiangguo Pu. An efficient load balancing tech-nology in CDN. In 6th International Conference on Fuzzy Systems and Knowledge Discovery, FSKD 2009, volume 7, pages 510–514. IEEE, 2009.
[23] Sabato Manfredi, Francesco Oliviero, and Simon Pietro Romano. Distributed man-agement for load balancing in content delivery networks. In 2010 IEEE Globecom Workshops, pages 579–583. IEEE, 2010.
[24] Coach Wei. System and method for network traffic management and load balancing, 2010.
[25] Konstantinos Stamos, George Pallis, Athena Vakali, Dimitrios Katsaros, Antonis Sidiropoulos, and Yannis Manolopoulos. CDNsim. ACM Transactions on Modeling and Computer Simulation, 20(2):1–40, may 2010.
[26] Steven G Krantz. Akamai’s state of the internet. Technical Report 2, sep 2014. [27] Venkata N Padmanabhan and Lili Qiu. The content and access dynamics of a busy
Web site. ACM SIGCOMM Computer Communication Review, 30(4):111–123, aug 2000.
[28] Konstantinos Stamos, George Pallis, Athena Vakali, and Marios D Dikaiakos. Eval-uating the utility of content delivery networks. In Proceedings of the 4th edition of the UPGRADE-CN workshop on Use of P2P, GRID and agents for the development of content networks - UPGRADE-CN ’09, UPGRADE-CN ’09, page 11, New York, NY, USA, 2009. ACM.
![Figure 1 Internet users during last few years [9].](https://thumb-eu.123doks.com/thumbv2/123doknet/3028639.85210/4.918.189.697.370.662/figure-internet-users-during-last-few-years.webp)