Open Archive TOULOUSE Archive Ouverte (OATAO)
OATAO is an open access repository that collects the work of Toulouse researchers and
makes it freely available over the web where possible.
This is an author-deposited version published in :
http://oatao.univ-toulouse.fr/
Eprints ID : 18123
To link to this article : DOI:
10.1016/j.jallcom.2017.06.143
URL :
http://dx.doi.org/10.1016/j.jallcom.2017.06.143
To cite this version :
Lafouresse, Manon Chloé and Bonfils -
Lahovary, Marie-Laëtitia de and Charvillat, Cédric and Oger, Loïc
and Laffont-Dantras, Lydia and Blanc, Christine A Kelvin probe
force microscopy study of hydrogen insertion and desorption into
2024 aluminum alloy. (2017) Journal of Alloys and Compounds,
vol. 722. pp. 760-766. ISSN 0925-8388
Any correspondence concerning this service should be sent to the repository
administrator:
[email protected]
A Kelvin probe force microscopy study of hydrogen insertion and
desorption into 2024 aluminum alloy
Manon Chlo!
e Lafouresse, Marie-La€
etitia de Bonfils-Lahovary, C!edric Charvillat, Loïc Oger,
Lydia Laffont, Christine Blanc
*CIRIMAT, Universit!e de Toulouse, CNRS, INPT, UPS, ENSIACET, 4 all!ee Emile Monso, CS44362, 31030, Toulouse, France
Keywords:
Aluminum alloys Hydrogen absorption Hydrogen desorption Atomic Force Microscopy (AFM) Scanning Kelvin Probe Force Microscopy (SKPFM)
a b s t r a c t
Hydrogen was inserted into 2024 aluminum alloy by cathodic polarization in sulfuric acid at 25!C.
Scanning Kelvin Probe Force Microscopy (SKPFM) measurements performed perpendicularly to the charging side revealed a potential gradient and confirmed the insertion of hydrogen over hundreds of microns. A hydrogen diffusion coefficient of 1.7 " 10#9cm2s#1was calculated from SKPFM measure-ments of H-charged samples for different durations. The evolution of the potential gradient during desorption of hydrogen in air, at room temperature and at 130!C was investigated. Additional
experi-ments performed at a corrosion defect showed that SKPFM could detect both reversibly and irreversibly bounded hydrogen. These results show that SKPFM is a cutting-edge technique for hydrogen detection and localization at a local scale.
1. Introduction
Hydrogen, which is a by-product of corrosion reactions, is sus-pected to play a major role in the loss of mechanical properties of aluminum alloys and more particularly to be responsible for their embrittlement and fracture [1]. It can be both inserted into the lattice (interstitial hydrogen) and irreversibly at microstructural defects (e.g. grain boundaries or vacancies) or precipitates. Inter-stitial hydrogen desorbs at room temperature while for hydrogen trapped at other locations, critical desorption temperatures have to be reached for it to desorb [2]. Moreover hydrogen trapped at different microstructural locations can play different roles in the degradation of the material. It is therefore essential to detect and localize hydrogen at least at the micrometer scale to better un-derstand the influence of hydrogen and of its location on the ma-terial embrittlement.
It is however difficult to detect and localize hydrogen at the scale of the corrosion defects which requires the use of analytical techniques with very high lateral resolution. Previous works pro-posed the development of analytical techniques to detect hydrogen
in cathodically charged samples. In that way, a powerful way to study hydrogen embrittlement is by using Atomic Force Microscope (AFM) based Scanning Kelvin Probe Force Microscopy (SKPFM). By measuring the surface potential at the nanometer scale, this tech-nique allows the detection and localization of hydrogen in the alloy through a change in the work function caused by the hydrogena-tion. Some authors have detected hydrogen in metals or alloys at the local scale with SKPFM [3e5]. Larignon et al. showed that hydrogen could be detected in cathodically H-charged 2024 aluminum alloy (AA 2024) as well as at grain and subgrain boundaries by SKPFM [6,7]. In this work, the AA 2024 was H-charged in molten salts at 150 !C and a gradient in potential associated with the presence of hydrogen was measured by SKPFM. Then, it seems relevant to study whether hydrogen can be detected by SKPFM at the scale of the corrosion defects. Further, it is of great interest to study hydrogen desorption in order to have a better understanding of the hydrogen trapping phenomena.
In the present work, hydrogen diffusion profiles were taken by SKPFM over a few hundreds of microns for AA 2024 samples hydrogen charged cathodically in acidic solution at 25!C. In addi-tion, the evolution of the profiles with exposure to air at room temperature as well as at a higher temperature was followed to obtain information about hydrogen desorption. SKPFM analysis was also performed at a corrosion defect for an AA 2024 sample
*Corresponding author.
E-mail address:[email protected](C. Blanc).
after immersion in 1 M NaCl and after heat treatment at different temperatures in order to distinguish between hydrogen trapped at different locations.
2. Materials and methods
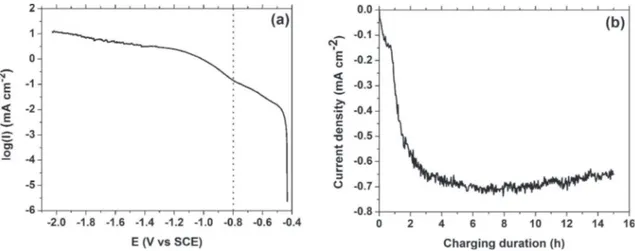
The material used was an AA 2024-T351 rolled plate with the following chemical composition (in wt. %): 4.46% Cu, 1.44% Mg, 0.60% Mn and 0.13% Fe[8]. Hydrogen was inserted into the AA 2024 by cathodic charging at 25 !C in 10 mM H2SO4 ($95% Sigma Aldrich). Electrochemical cathodic charging in acidic solution was selected as large quantities of hydrogen (>1000 appm) could be inserted with this method into pure aluminum[9]. A Pt counter electrode and a saturated calomel reference electrode (SCE) were used. The charging potential, E, was #0.8 V vs SCE and the charging duration was 5 h 30, 15 h, 27 h or 48 h. This charging potential is situated at the transition zone between the oxygen reduction re-action and the hydrogen reduction rere-action as shown in the po-larization curve for AA 2024 in 10 mM H2SO4(Fig. 1(a)). InFig. 1(b), the charging curve for AA 2024 is displayed. It takes a couple of hours for the current density value to reach its plateau value. This is probably due to the oxygen reaction in the first hours being gressively replaced by the hydrogen reduction reaction. The pro-gressive apparition of bubbles on the surface seems to agree with this hypothesis. The charging side was chosen to be perpendicular to the elongated grain direction (rolling direction, RD)[8]. There-fore, one of the long transverse (LT) - short transverse (ST) sides of the parallelepiped sample (~2 " 2 " 20 mm3(LT " RD " ST)) was exposed to the electrolyte while all the other sides were protected by silicone elastomer paste (Fig. 2(a)). Before charging, the charging side was polished with diamond paste down to 3
m
m. Following the charging, the ST- RD side was polished down to 0.25m
m with diamond paste and with distilled water as a lubricant, thoroughly rinsed with distilled water and then imaged by SKPFM. A minimum of 300m
m was removed by polishing in the LT direction to avoid edge effects. Some samples were stored in liquid nitrogen for gas fusion analysis.For preparing corroded 2024 aluminum alloy samples, a continuous immersion of the alloy in 1 M NaCl at 25!C for 24 h was performed. A cubic sample of about 1 " 1 " 1 mm3was prepared and one of the LT-ST sides was exposed to the NaCl solution after polishing down to 3
m
m (Fig. 2(b)). All the other sides were pro-tected with varnish. Following the immersion, the sample was rinsed with water, dried and cut in two along the ST-RD plane. The ST-RD side was then polished with down to 0.25m
m diamond paste and imaged in SKPFM.Heat treatments for hydrogen desorption were performed in a Carbolite furnace.
The hydrogen content of the cathodically charged samples was determined by gas fusion analysis using a Bruker G8 GALILEO ON/H Instrumental Gas Analyser (IGA). The sample is melted in a graphite crucible at high temperature and the hydrogen content is then measured by thermal conductivity measurements of the gas. Parallelepiped samples of mass (130 ± 5) mg and of dimensions ~ 3.2 " 1.1 " 14.5 mm3(LT " RD " ST) were prepared. The low sample thickness in the RD direction ensured that the non-charged part is kept to a minimum. Prior to the analysis, the sample was slightly polished with grade 1200 SiC paper. This step is crucial in order to get accurate hydrogen content values, as demonstrated by Buckley et al. [10]. The authors showed that during cathodic charging, an Al(OH)3layer forms on the aluminum sample surface. If not removed, erroneously high values of hydrogen were measured due to the decomposition of this Al(OH)3layer into Al2O3 and H2.
The SKPFM measurements were performed on a 5500 Agilent AFM. Both topography and surface potential signals were acquired simultaneously (single pass mode). The probes were conductive Pt-coated silicon tips. In the single pass mode set up, the tip is vibrated above the surface at two different frequencies: a frequency close to the resonant frequency of the tip (300 kHz) by mechanical excita-tion in order to control the tip-sample distance and a lower fre-quency (10 kHz) by electrical excitation to measure the surface potential[11]. Amplitude modulation (AM) - KFM mode was used. In this mode, a voltage Vdcþ Vacsin(
u
t) is applied to the tip. Theresulting oscillating potential difference between the tip and sample modulates the electrostatic force between the tip and the sample inducing an oscillation of the tip. Vdcis adjusted, until the
amplitude of the oscillations is minimal, which occurs when Vdcis
equal to the potential difference between the tip and the sample. This set up allows a high spatial resolution. All SKPFM measure-ments were performed in air at room temperature.
Concerning cathodically charged samples, to overcome the limited scan range (90
m
m) of the instrument, sequential images were taken so that cross sections of the sample over hundreds of microns could be acquired (Fig. 3). The first image was taken by starting from the edge adjacent to the charging side and scanning an 85m
m " 6m
m area. The sample was then moved by about 50m
m with micrometer screws in the direction perpendicular to the charging side and a second image was taken. An overlap of the potential value of the two adjacent images ensured that the surface potential value was stable. This procedure was repeated over up to a total length of about 600m
m.3. Results and discussion
3.1. Hydrogen insertion during cathodic charging
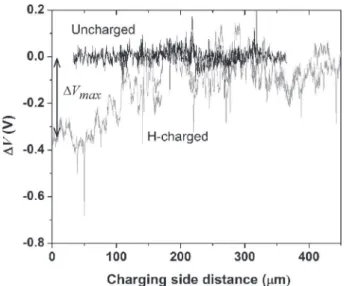
The potential profiles of an uncharged AA 2024 sample and a 15 h H-charged AA 2024 sample are shown inFig. 4. All measure-ments are plotted with respect to a reference value of the potential. This reference value is the potential measured far away from the charging side, i.e. in the uncharged part of the sample. This value has been chosen as the SKPFM potential value in the uncharged part does vary from sample to sample due to small differences in temperature and relative humidity in the laboratory room. There-fore, for an accurate comparison between the samples, the poten-tial plotted inFig. 4is the difference between the potential in the uncharged part of the sample, V∞, and the measured potential at a distance x, Vx. It is called
D
V.D
V for the uncharged sample is constant over several hundredsof microns. On the contrary, the potential profile of the charged sample clearly follows a gradient with a lower value of
D
V close tothe charging side as compared with the bulk. The potential gradient is observed over about 200
m
m and the maximum difference in potential value,D
Vmax, is ~350 mV. Similar SKPFM potentialgra-dients have been observed by Larignon et al. for AA 2024 also charged in hydrogen but with a different method and at a higher
temperature[6]. In Larignon's work, secondary ion mass spec-troscopy (SIMS) measurements were performed in parallel and showed the presence of a gradient of hydrogen over distances
Fig. 2. Experimental procedures for preparation for SKPFM imaging of (a) an AA 2024 sample H-charged in 10 mM H2SO4and (b) an AA 2024 sample exposed to a 1 M NaCl solution.
The hatched zone represents the side exposed to the solution.
Fig. 3. Schematic of the overlapping section method used during the SKPFM mea-surements. The first two SKPFM potential images are shown to demonstrate the overlapping.
similar to the ones found for the SKPFM potential gradient. These gradients in potential were therefore linked with a gradient in hydrogen in the material. In the present study, the hydrogen presence in the sample was confirmed by gas fusion analysis. An average of 14 ppm was measured for a charging duration of 15 h. As a reference, the uncharged AA 2024 contains 7 ppm of residual hydrogen.
Therefore, the comparison between the potential profiles of a H-charged and an unH-charged AA 2024 samples and the confirmation of additional hydrogen inserted during cathodic charging by IGA measurements indicate that hydrogen can be detected with SKPFM and its penetration depth in the material measured.
The evolution of the surface potential difference gradient as a function of charging duration was also studied. Both the diffusion depth of hydrogen and the maximum difference in potential value (
D
Vmax) extracted from the potential profiles (not shown) arepre-sented inFig. 5. The diffusion depth was measured at the point where the difference in potential reaches zero. There is, as ex-pected, a clear increase of both the penetration depth and
D
Vmaxvalue as the charging duration is increased.
Hydrogen diffusion profiles can be calculated from the analytical
solution to Fick's second law [12]. For the following boundary conditions
cðx > 0;t ¼ 0Þ ¼ c0 (1a)
cðx ¼ 0;tÞ ¼ cs (1b)
where c0is the initial hydrogen concentration in the bulk material
at a distance x > 0 from the surface and at a time t ¼ 0 and csis the
surface concentration at a time t, then[12] cðx;tÞ # cs c0# cs ¼ erf ! x 2 ffiffiffiffiffiffi Dt p # (2)
where c(x,t) is the hydrogen concentration at a distance x from the surface and at a charging time t and D is the hydrogen diffusion coefficient. co and cs were assumed to be equal to 0 and 1,
respectively.
Eq.(2)can be rearranged as follows
xz 2 ffiffiffiffi D p !#lnðcðx;tÞÞ 1:9 #1:31! " pffiffit (3)
The solid line inFig. 5represents the results of a fit to Eq.(3). A good agreement between theoretical hydrogen diffusion calcula-tions and experimental hydrogen diffusion measurements is observed. Moreover the diffusion coefficient value, D, can be extracted from the fit of the potential profile curves (not shown). D was measured to be equal to (1.7 ± 0.9) " 10#9cm2s#1, which is close to the value of 10#9cm2s#1calculated for AA 2024 at 25!C from thermal desorption experiments[1]. Larignon et al. found a value of 1e14 " 10#9cm2s#1based on SIMS measurements and (7 ± 2) " 10#9cm2s#1based on open circuit potential (OCP) and SKPFM measurements [6]. These slightly higher values can be explained by the fact that charging was done at a higher temper-ature (150!C). These SKPFM measurements give only access to the penetration depth, not to the quantity of hydrogen being inserted. So, in addition, hydrogen content for different charging durations was determined by gas fusion method. As the hydrogen penetration depth is no more than 400
m
m, samples ~1.1 mm thick were pre-pared to ensure than the non-charged zone is as small as possible not to give erroneously low H content values. However, the error remains significant and only approximate values can be given: the interest is in the comparison of the different values. As previously given, for the uncharged alloy a value of 7 ppm was measured due to hydrogen inserted during elaboration processing. For the 5 h 30, 15 h, 27 h and 48 h, the H content measured was 12 ppm, 14 ppm, 15 and 17 ppm respectively. Therefore an increase in the hydrogen content with the charging duration is indeed measured, in agree-ment with the SKPFM results. The good agreeagree-ment between the theory for H diffusion and the measured potential gradients as well as the IGA measurements confirms that the potential gradients are due to the presence of hydrogen. Moreover the method of inserting hydrogen into the aluminum alloy at a low temperature developed here rules out possible microstructural modifications of the alloy by artificial ageing.3.2. Hydrogen desorption for cathodically H-charged AA 2024 sample
SKPFM has also been used to study the desorption of hydrogen from a pre-charged AA 2024 sample. The sample was charged for 15 h at #0.8 V in 10 mM H2SO4. The gradient in potential of the as-charged sample is displayed inFig. 6(a). In this figure,
D
V has beenFig. 4. SKPFM potential differenceDV ¼ V∞# Vxas a function of the distance x from
the H-charging side for uncharged (black) and 15 h H-charged (grey) AA 2024 samples.
V∞is the potential measured in the H-free sample, far away from the charging surface.
Fig. 5. Penetration depth (-) and maximum potential difference (B) for a range of charging durations. The solid line represents the results of a fit to Eq.(3).
averaged every 30
m
m for clarity. A gradient over about 250m
m associated with aD
Vmaxof 300 mV was measured, as expected forthis charging duration (Fig. 5). The sample was then exposed to air at room temperature and the potential gradient was measured again after 24 h and 48 h. The ST-RD side was polished before each measurement. The gradients are presented inFig. 6(a). After 24 h, the gradient extents only over the first 100
m
m andD
Vmax hasdecreased. After 48 h, there is no more gradient, suggesting that the majority of the detected H has desorbed. Fig. 6(b) confirms the complete desorption of H at relatively low temperature. Indeed, in this figure, the potential gradient displayed by a pre-charged H sample has disappeared after a 2 h heat treatment at 130!C. To rule out errors due to the influence of the heat treatment at 130!C on the SKPFM response of the alloy, the potential gradient of an un-charged sample heat treated at 130 !C was recorded. As shown inFig. 6(b) the gradient of the uncharged sample was not affected by the heat treatment at 130!C. It is also important to note the good reproducibility for samples charged for 15 h (Figs. 4 and 6(a), (b)).
In this study, hydrogen was found to desorb at 130!C and even at room temperature. At this temperature, only interstitial hydrogen is expected to desorb. Thermal desorption analysis of AA 2024 exposed to accelerated corrosion tests in exfoliation corrosion (EXCO) solution revealed the presence of four trapping states (T1eT4) for hydrogen [2]. T1 is a reversible trap i.e. hydrogen trapped in T1 can desorb at room temperature. T2, T3 and T4 are irreversible traps i.e. a critical temperature has to be reached in order for H to desorb from these traps (200!C, 410!C and 500!C respectively). T1 was associated with hydrogen at interstitial sites, T2 at the interface between some intermetallic particles and the matrix, T3 at dislocations, T4 at the S-phase particles (Al2CuMg)
[1,2,13]. In the present paper, most of the hydrogen detected by SKPFM has desorbed at room temperature after 48 h or after heat treatment for 2 h at 130!C. Therefore most of the hydrogen being detected is assumed to be interstitial hydrogen. This result does not rule out the presence of irreversibly trapped hydrogen in the cathodically charged sample. During cathodic charging case, the hydrogen does not necessarily go to the same traps as in the EXCO experiment. Indeed, in EXCO experiment the hydrogen is produced at the grain boundary, but not in hydrogen charging method. Furthermore the interstitial hydrogen introduced during cathodic charging might have diffused to very localized microstructural traps which were not captured on the cross sections imaged. To further check the capability of SKPFM to detect hydrogen trapped at irreversible trapping sites, SKPFM was then performed on corroded samples.
3.3. H desorption at corrosion defects
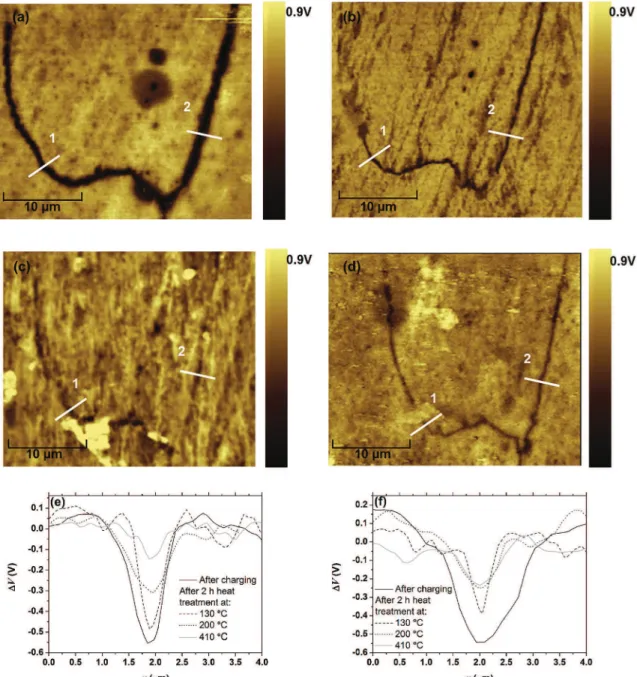
In Fig. 7, the potential map measured by SKPFM taken at a corrosion defect is shown. The images are flattened so that
D
Vcorresponds to the difference between the potential in the matrix and the measured potential at position (x, y). The potential map after immersion in 1 M NaCl for 24 h is presented in Fig. 7(a). A corrosion defect is clearly visible in the potential image (Fig. 7(a)). Indeed a zone of lower
D
V is observed which was found to coincidewith a defect spotted with the optical microscope. As AA 2024 is affected by intergranular corrosion, it is concluded that these de-fects are the consequence of corrosion along grain boundaries. The decrease in
D
V is observed over a ~1.5 to 2m
m wide zone with aD
Vmaxof 550 mV (Fig. 7(e) and (f)). Note that the defect is more visible on theD
V image than on the topographic image as alreadyobserved in a previous study[14]. The same zone was then imaged in SKPFM after heat treatment of the sample at 130!C, 200!C and 410!C for 2 h as shown inFig. 7(b), (c) and (d) respectively. These temperatures were chosen as they correspond to the critical tem-peratures associated with the desorption of hydrogen from traps T1, T2 and T3 respectively as identified by Charitidou[2]. The heat treatment corresponding to desorption of hydrogen from T4 (at T ¼ 500!C) was not performed as this temperature is above the solution heat treatment temperature of AA 2024 (495!C). After each heat treatment, the sample was polished again down to 0.25
m
m with diamond paste to limit the influence of the surface oxide on the measured potential[15]. After 2 h at 130!C, the lower potential zone is still visible (Fig. 7(b)), however the potential image has changed. Indeed inFig. 7(e),D
Vmaxdecreases from 550 mV to 480 mV while inFig. 7(f) it decreases from 550 mV to 380 mV. Moreover the width of the lower potential zone decreases after heat treatment at 130!C down to ~0.8m
m (Fig. 7(f)) and 1m
m (Fig. 7(e)). These results suggest some interstitial hydrogen desorption accelerated by the heat treatment at 130!C as at this temperature only reversibly absorbed hydrogen is expected to desorb. After an additional heat treatment of 2 h at 200!C and 410!C, the potential maps have changed further (Fig. 7(c) and (d)). As seen on cross section1(Fig. 7(e)) (cross section 2(Fig. 7(f)),D
Vmax decreases further to 310 mV (250 mV) and to 150 mV (235 mV) after heat treatment at 200!C and 410!C respectively. At these higher temperatures, hydrogen trapped at T2 and T3 is ex-pected to desorb. Therefore the observed decrease inD
V observedbetween the heat treatment at 130!C and the ones at 200!C/410!C is associated with the desorption of irreversibly absorbed hydrogen. T2 is associated with hydrogen trapped at the semi-coherent interface between the strengthening phases and the
Fig. 6. Evolution of the SKPFM potential difference profilesDV ¼ V∞# Vxafter charging for 15 h (-) and (a) after an additional exposure to air for 24 h (C) and 48 h (
:
); (b) aftermatrix and/or with the incoherent interface between the disper-soids and the matrix and T3 with hydrogen trapped at dislocation [1,13]. A high density of dislocations is expected to be found near an intergranular corrosion defect[16]therefore it is logical that the potential evolution associated with hydrogen desorption from T3 is easily observed on the corroded sample while it was not observed on the H-charged samples (section3.2). The fact that there is still a lower
D
V at the defect with respect to the matrix after a heattreatment at 410!C might be due to hydrogen trapped at S-phase particles (T4). It could also be due to other corrosion products such as alumina or aluminum hydroxide or to a copper enrichment (or Cu-rich layer) at the grain boundaries due to corrosion[17e19]. Note that the quantitative variation of the potential map varies from cross section1 and 2suggesting heterogeneity in hydrogen content all along the corrosion defects and also heterogeneity of the corrosion defects itself concerning the density of dislocations and the presence of intermetallics for example.
Additionally after heat treatment at 200!C and 410!C, a lower
D
V is observed over a zone wider than after the heat treatment at130!C but narrower than without heat treatment. This suggests diffusion and redistribution of hydrogen in the material induced by the heat treatment. Indeed, instead of desorbing out of the material, some hydrogen might get trapped at nearby defects with higher desorption temperatures.
4. Conclusions
An innovative method was developed to charge in hydrogen AA 2024 aluminum alloy at room temperature to ensure that there was no microstructural modifications of the aluminum alloy by artificial ageing. A SKPFM study combined with IGA measurements confirmed the insertion of hydrogen in the alloy. The desorption of hydrogen followed by SKPFM through the evolution of the potential gradients with time and temperature showed that SKPFM can be
Fig. 7. SKPFM potential images of the same zone of an AA 2024 sample (a) after immersion for 24 h in 1 M NaCl and after additional heat treatment for 2 h at (b) 130!C, (c) 200!C
used to study hydrogen desorption kinetics. Additional measure-ments done at corrosion defects showed that SKPFM can detect H trapped both at reversible and irreversible sites. This study paves the way for a better understanding of the different trapping sites of hydrogen and their impact on the embrittlement of aluminum alloys.
Acknowledgements
The authors wish to thank Gregory Odemer for help with IGA measurements and for fruitful discussions. Manon Chlo!e Lafouresse wishes to thank Fabi!an C!adiz for help with the diffusion coefficient calculation. This work was supported by ANR-14-CE07-0027-01 e M-SCOT: Multi Scale COrrosion Testing.
References
[1] H. Kamoutsi, G.N. Haidemenopoulos, V. Bontozoglou, S. Pantelakis, Corros. Sci. 48 (2006) 1209e1224.
[2] E. Charitidou, G. Papapolymerou, G.N. Haidemenopoulos, N. Hasiotis, V. Bontozoglou, Scr. Mater. 41 (12) (1999) 1327e1332.
[3] C. Sen€oz, S. Evers, M. Stratmann, M. Rohwerder, Electrochem. Comm. 13 (2011) 1542e1545.
[4]S. Evers, C. Sen€oz, M. Rohwerder, Sci. Technol. Adv. Mater. 14 (2013) 014201. [5]M. Koyama, A. Bashir, M. Rohwerder, S.V. Merzlikin, E. Akiyama, K. Tsuzaki,
D. Raabe, J. Electrochem. Soc. 162 (12) (2015) C638eC647.
[6]C. Larignon, J. Alexis, E. Andrieu, L. Lacroix, G. Odemer, C. Blanc, Scr. Mater. 68 (2013) 479e482.
[7]C. Larignon, J. Alexis, E. Andrieu, L. Lacroix, G. Odemer, C. Blanc, Electrochim. Acta 110 (2013) 484e490.
[8]C. Larignon, J. Alexis, E. Andrieu, C. Blanc, G. Odemer, J.-C. Salabura, J. Electrochem. Soc. 158 (9) (2011) C284eC295.
[9]H.K. Birnbaum, C.E. Buckley, F. Zeides, E. Sirois, P. Rozenak, S. Spooner, J.S. Lin, J. Alloys Comp. 253e254 (1997) 260e264.
[10] C.E. Buckley, H.K. Birnbaum, J. Alloys Compd. 330e332 (2002) 649e653. [11] M. Nonnenmacher, M.P. O'Boyle, H.K. Wickramasinghe, Appl. Phys. Lett. 58
(1991) 2921e2923.
[12] R.W. Balluffi, S.M. Allen, W.C. Carter, Kinetics of Materials, second ed., John Wiley & Sons, Hoboken, New Jersey, 1999.
[13] H. Kamoutsi, G.N. Haidemenopoulos, V. Bontozoglou, P.V. Petroyiannis, Sp.G. Pantelakis, Corros. Sci. 80 (2014) 139e142.
[14] M. C. Lafouresse, M-L. de Bonfils-Lahovary, C. Charvillat, L. Laffont, C. Blanc, Conference Proceedings NACE 2017, NACE Int., RIP 2017e9464.
[15] T.H. Muster, A.E. Hughes, J. Electrochem. Soc. 153 (11) (2006) B474eB485. [16] C. Luo, X. Zhou, G.E. Thompson, A.E. Hughes, Corros. Sci. 61 (2012) 35e44. [17] R.G. Buchheit, R.P. Grant, P.F. Hlava, B. McKenzie, G.L. Zender, J. Electrochem.
Soc. 144 (8) (1997) 2621e2628.
[18] V. Guillaumin, G. Mandowski, Corros. Sci. 41 (1999) 421e438.
[19] M.-L. De Bonfils-Lahovary, L. Laffont, C. Blanc, Mater. Sci. Forum 877 (2017) 444e449.