Age dating of an early Milky Way merger via
asteroseismology of the naked-eye star
ν Indi
William J. Chaplin1,2,3, Aldo M. Serenelli4,5, Andrea Miglio1,2, Thierry Morel6, J. Ted Mackereth1,2,
Fiorenzo Vincenzo1,2,7,8, Hans Kjeldsen2,9, Sarbani Basu10, Warrick H. Ball1,2, Amalie Stokholm2, Kuldeep Verma2, Jakob Rørsted Mosumgaard2, Victor Silva Aguirre2, Anwesh Mazumdar11, Pritesh Ranadive11, H. M. Antia12, Yveline Lebreton13,14, Joel Ong10, Thierry Appourchaux15, Timothy
R. Bedding16, Jørgen Christensen-Dalsgaard2,3, Orlagh Creevey17, Rafael A. Garc´ıa18,19, Rasmus Handberg2, Daniel Huber20, Steven D. Kawaler21, Mikkel N. Lund2, Travis S. Metcalfe22,23, Keivan G. Stassun24,25, Mich¨ael Bazot26,27, Paul Beck28,29,30, Keaton J. Bell31,62,23,2, Maria Bergemann32,
Derek L. Buzasi33, Othman Benomar27,34, Diego Bossini35, Lisa Bugnet18,19, Tiago L. Campante35,36, Zeynep C¸ elik Orhan37, Enrico Corsaro38, Luc´ıa Gonz´alez-Cuesta29,30, Guy R. Davies1,2, Maria Pia Di Mauro39, Ricky Egeland40, Yvonne P. Elsworth1,2, Patrick Gaulme23,41, Hamed Ghasemi42,
Zhao Guo43,44, Oliver J. Hall1,2, Amir Hasanzadeh45, Saskia Hekker23,2, Rachel Howe1,2, Jon M. Jenkins46, Antonio Jim´enez29,30, Ren´e Kiefer47, James S. Kuszlewicz23,2, Thomas Kallinger48, David W. Latham49, Mia S. Lundkvist2, Savita Mathur29,30, Josefina Montalb´an1,2, Benoit Mosser13,
An-dres Moya Bed´on1,2, Martin Bo Nielsen1,2,27, Sibel ¨Ortel37, Ben M. Rendle1,2, George R. Ricker50, Tha´ıse S. Rodrigues51, Ian W. Roxburgh52,1, Hossein Safari45, Mathew Schofield1,2, Sara Seager50,53,54, Barry Smalley55, Dennis Stello56,16,2, R´obert Szab´o57,58, Jamie Tayar20,63, Nathalie Themeßl23,2,
Alexandra E. L. Thomas1,2, Roland K. Vanderspek50, Walter E. van Rossem1,2, Mathieu Vrard35,36,
Achim Weiss59, Timothy R. White60,2, Joshua N. Winn61, Mutlu Yıldız37
1 School of Physics and Astronomy, University of Birmingham, Birmingham B15 2TT, UK
2 Stellar Astrophysics Centre (SAC), Department of Physics and Astronomy, Aarhus University, Ny
Munkegade 120, DK-8000 Aarhus C, Denmark
3 Kavli Institute for Theoretical Physics, University of California, Santa Barbara, CA 93106, USA 4 Institute of Space Sciences (ICE, CSIC) Campus UAB, Carrer de Can Magrans s/n, 08193
Barcelona, Spain
5 Institut d’Estudis Espacials de Catalunya (IEEC), C/ Gran Capit`a, 2-4, 08034 Barcelona, Spain 6 Space Sciences, Technologies and Astrophysics Research (STAR) Institute, Universit´e de Li`ege,
Quartier Agora, All´ee du 6 Aoˆut 19c, Bˆat. B5C, B4000-Li`ege, Belgium
7 Center for Cosmology and AstroParticle Physics, The Ohio State University, 191 West Woodruff
Avenue, Columbus, OH 43210, USA
8 Department of Physics, The Ohio State University, 191 West Woodruff Avenue, Columbus, OH
43210, USA
9Institute of Theoretical Physics and Astronomy, Vilnius University, Sauletekio av. 3, 10257 Vilnius,
Lithuania
10 Department of Astronomy, Yale University, P.O. Box 208101, New Haven, CT 06520-8101, USA 11 Homi Bhabha Centre for Science Education, TIFR, V. N. Purav Marg, Mankhurd, Mumbai
400088, India
12 Tata Institute of Fundamental Research, Mumbai, India
18 IRFU, CEA, Universit´e Paris-Saclay, F-91191 Gif-sur-Yvette, France
19 AIM, CEA, CNRS, Universit´e Paris-Saclay, Universit´e Paris Diderot, Sorbonne Paris Cit´e,
F-91191 Gif-sur-Yvette, France
20 Institute for Astronomy, University of Hawai‘i, 2680 Woodlawn Drive, Honolulu, HI 96822, USA 21 Department of Physics and Astronomy, Iowa State University, Ames, IA 50011
22 Space Science Institute, 4750 Walnut Street, Suite 205, Boulder CO 80301, USA
23Max-Planck-Institut f¨ur Sonnensystemforschung, Justus-von-Liebig-Weg 3, 37077 G¨ottingen,
Ger-many
24Vanderbilt University, Department of Physics & Astronomy, 6301 Stevenson Center Ln., Nashville,
TN 37235, USA
25Vanderbilt Initiative in Data-intensive Astrophysics (VIDA), 6301 Stevenson Center Lane, Nashville,
TN 37235, USA
26 Division of Sciences, New York University Abu Dhabi, United Arab Emirates,
27 Center for Space Science, NYUAD Institute, New York University Abu Dhabi, PO Box 129188,
Abu Dhabi, United Arab Emirates
28 Department for Geophysics, Meteorology and Astrophysics, Institute of Physics, Karl-Franzens
University of Graz, Universit¨atsplatz 5/II, 8010 Graz, Austria
29 Instituto de Astrof´ısica de Canarias (IAC), E-38205 La Laguna,Tenerife, Spain
30 Universidad de La Laguna (ULL), Departamento de Astrofisica, E-38206 La Laguna, Tenerife,
Spain
31DIRAC Institute, Department of Astronomy, University of Washington, Seattle, WA 98195-1580,
USA
32 Max Planck Institute for Astronomy, 69117, Heidelberg, Germany
33 Dept. of Chemistry and Physics, Florida Gulf Coast University, 10501 FGCU Blvd. S., Fort
Myers, FL 33965 USA
34 Solar Science Observatory, NAOJ, and Department of Astronomical Science, Sokendai (GUAS),
Mitaka, Tokyo, Japan
35 Instituto de Astrof´ısica e Ciˆencias do Espa¸co, Universidade do Porto, CAUP, Rua das Estrelas,
4150-762 Porto, Portugal
36 Departamento de F´ısica e Astronomia, Faculdade de Ciˆencias da Universidade do Porto, Rua do
Campo Alegre, s/n, PT4169-007 Porto, Portugal
37 Department of Astronomy and Space Sciences, Science Faculty, Ege University, 35100, Bornova,
˙Izmir, Turkey
38 INAF - Osservatorio Astrofisico di Catania, via S. Sofia 78, 95123, Catania, Italy
39INAF-IAPS, Istituto di Astrofisica e Planetologia Spaziali, Via del Fosso del Cavaliere 100, I-00133
Roma, Italy
40High Altitude Observatory, National Center for Atmospheric Research, 3080 Center Green,
Boul-der, CO, 80301, USA
41Department of Astronomy, New Mexico State University, P.O. Box 30001, MSC 4500, Las Cruces,
NM 88003-8001, USA
42Department of Physics, Institute for Advanced Studies in Basic Sciences (IASBS), Zanjan
45137-66731, Iran
43 Center for Exoplanets and Habitable Worlds, 525 Davey Laboratory, The Pennsylvania State
University, University Park, PA 16802, USA
44 Department of Astronomy & Astrophysics, 525 Davey Laboratory, The Pennsylvania State
Uni-versity, University Park, PA, 16802, USA
45 Department of Physics, University of Zanjan, P. O. Box 45195-313, Zanjan, Iran 46 NASA Ames Research Center, Moffett Field, CA, 94035, USA
47Centre for Fusion, Space, and Astrophysics, Department of Physics, University of Warwick,
Coven-try, UK
48 Institute of Astronomy, University of Vienna, 1180 Vienna, Austria
49Center for Astrophysics| Harvard & Smithsonian, 60 Garden Street, Cambridge, MA 02138, USA 50 Department of Physics, and Kavli Institute for Astrophysics and Space Research, Massachusetts
Institute of Technology, Cambridge, MA 02139, USA
51 Osservatorio Astronomico di Padova – INAF, Vicolo dell’Osservatorio 5, I-35122 Padova, Italy 52 Astronomy Unit, Queen Mary University of London, Mile End Road, London, E1 4NS, UK 53Department of Earth, Atmospheric and Planetary Sciences, Massachusetts Institute of Technology,
Cambridge, MA 02139, USA
54 Department of Aeronautics and Astronautics, MIT, 77 Massachusetts Avenue, Cambridge, MA
02139, USA
55Astrophysics Group, Lennard-Jones Laboratories, Keele University, Staffordshire ST5 5BG, United
Kingdom
56 School of Physics, The University of New South Wales, Sydney NSW 2052, Australia 57 Konkoly Observatory, CSFK, H-1121, Konkoly Thege Mikl´os ´ut 15-17, Budapest, Hungary 58 MTA CSFK Lend¨ulet Near-Field Cosmology Research Group
59 Max-Planck-Institut f¨ur Astrophysik, Karl-Schwarzschild-Str. 1, D-85748 Garching, Germany 60 Research School of Astronomy and Astrophysics, Mount Stromlo Observatory, The Australian
National University, Canberra, ACT 2611, Australia
61 Department of Astrophysical Sciences, Princeton University, Princeton, NJ 08544, USA 62 NSF Astronomy and Astrophysics Postdoctoral Fellow and DIRAC Fellow
63 Hubble Fellow
Over the course of its history, the Milky Way has ingested multiple smaller satellite galaxies[1]. While these accreted stellar populations can be forensically identified as kinematically distinct structures within the Galaxy, it is difficult in general to pre-cisely date the age at which any one merger occurred. Recent results have revealed a population of stars that were accreted via the collision of a dwarf galaxy, called Gaia -Enceladus[1], leading to a substantial pollution of the chemical and dynamical properties of the Milky Way. Here, we identify the very bright, naked-eye star ν Indi as a probe of the age of the early in situ population of the Galaxy. We combine as-teroseismic, spectroscopic, astrometric, and kinematic observations to show that this metal-poor, alpha-element-rich star was an indigenous member of the halo, and we measure its age to be 11.0± 0.7 (stat) ±0.8 (sys) Gyr. The star bears hallmarks consis-tent with it having been kinematically heated by the Gaia -Enceladus collision. Its age implies that the earliest the merger could have begun was 11.6 and 13.2 Gyr ago at 68 and 95 % confidence, respectively. Input from computations based on hierarchical cosmological models tightens (i.e. reduces) slightly the above limits.
spectroscopy, together with astrometry and kinematics from Gaia-DR2[4], show this single star as a powerful, representative tracer of old in situ stellar populations in the Galaxy. The results on ν Indi allow us to place new constraints on the age of the in situ halo and the epoch of the Gaia-Enceladus merger.
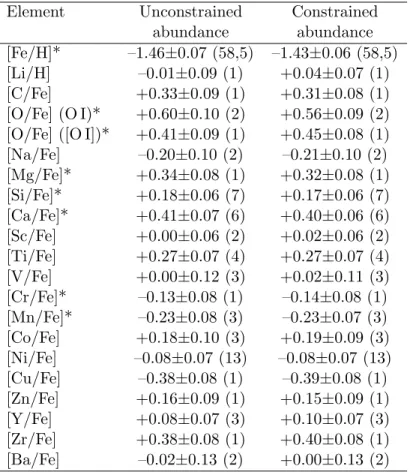
We re-analysed archival high-resolution spectroscopic data on ν Indi collected by the High Accu-racy Radial velocity Planet Searcher (HARPS) spectrograph[6] on the European Southern Observa-tory (ESO) 3.6-m telescope at La Silla, and by the Fiber-fed Extended Range Optical Spectrograph (FEROS)[7] on the 2.2-m ESO/MPG telescope (also at La Silla). From these high-resolution spectra we measured the overall iron abundance and detailed abundances for 20 different elements, providing a comprehensive set of data on the chemistry of the star (see Methods for table of abundances and further details). ν Indi exhibits enhanced levels of α-process elements in its spectrum, i.e., elements heavier than carbon produced by nuclear reactions involving helium. The logarithmic abundance relative to iron is [α/Fe] = +0.4. Among Galactic disk stars, elevated [α/Fe] levels are associated with old stellar populations. ν Indi shows an overabundance of Titanium of [Ti/Fe] = +0.27± 0.07, which puts it in the regime where a previous study[8] found ages exceeding≈ 9.5 Gyr for α-enhanced stars in the local solar neighbourhood, where ν Indi resides.
Figure 1 shows [Mg/Fe] abundances of Milky Way stars, including ν Indi, from the Apache Point Observatory Galaxy Evolution Experiment (APOGEE) DR-14 spectroscopic survey release[5] (see Methods for further details). ν Indi’s abundances place it at the upper edge of the distribution identified with the accreted Gaia-Enceladus population[1] (points in red at lower [Mg/Fe]); but more in line with the in situ halo population at higher [Mg/Fe]. Were it to have been accreted, it is unlikely the star could be a member of a different accreted population, as its high [Mg/Fe] would suggest the progenitor dwarf galaxy would have had to have been at least as massive as Gaia-Enceladus. Since the stellar debris from Gaia-Enceladus is thought to make up a high fraction of the stellar mass of the present day halo, it seems improbable that there could exist another similar undiscovered satellite. We therefore conclude, on the basis of chemistry alone, that ν Indi is either a member of the in-situ population, or a member of Gaia-Enceladus. We now use kinematics to show that the former is most likely correct.
To place ν Indi in context among other stars with similar elemental abundances, we selected stars from APOGEE-DR14 having [Fe/H] equal (within the uncertainties) to our measured value for ν Indi. Figure 2 shows Gaia-DR2 velocity data for populations with low and high [Mg/Fe], which roughly divides into accreted and in situ halo stars[9, 10]. The cross-hair marks the location of ν Indi on both plots. The low [Mg/Fe] group includes many stars in the high-eccentricity accreted halo, which was recently determined to be dominated by the Gaia-Enceladus accretion event. Here, the low [Mg/Fe] population shows a flat distribution (the so-called Gaia Sausage) in the tangential versus radial velocity plane, consistent with the strong radial motion from an accreted population. In the vertical versus radial velocity plane, the distributions of the low and high [Mg/Fe] stars are remarkably similar. This suggests the in situ, higher [Mg/Fe] population, which includes ν Indi (see below), was heated by the accreted population. We note also evidence from simulations[11, 12, 13] for mergers causing heating of in situ populations.
We derived Galactic orbital parameters for ν Indi using the positions and velocities provided by Gaia-DR2 (see Methods). We performed the same orbital integrations for the populations with low and high [Mg/Fe]. Figure 3 shows a contour plot of the resulting distributions of the eccentricity, e, and maximum vertical excursion from the Galactic mid-plane, zmax. Low eccentricity orbits are
dominated by higher [Mg/Fe] stars, and are likely part of the thick disc/in situ halo. The position of ν Indi is marked on the contour plot; the uncertainties are too small to be visible on this scale. Our analysis of the Gaia-DR2 data reveals that ν Indi has a relatively eccentric orbit, with e = 0.60±0.01, zmax = 1.51± 0.02 kpc, and a Galactic pericentric radius of ' 2.5 kpc. Given that ν Indi lies in a
−3.0 −2.5 −2.0 −1.5 −1.0 −0.5 0.0 0.5 1.0
[Fe/H]
−1.00 −0.75 −0.50 −0.25 0.00 0.25 0.50 0.75 1.00[Mg
/F
e]
Nu Indi – this work
Helmi et al. (2018)
0.0 0.5 1.0 1.5 2.0 2.5 3.0 3.5log
(#stars)
Figure 1: [Mg/Fe] versus [Fe/H] abundances of a large sample of Milky Way stars, from the APOGEE DR-14 spectroscopic survey data release[5]. Results on ν Indi are marked by the blue star-shaped symbol. Points in red show the sample of stars identified as being part of the accreted population from Gaia-Enceladus[1].
in-line with those stars, it is likely to be a member of this population, formed in situ (five times more likely, based on the data in Figures. 2 and 3).
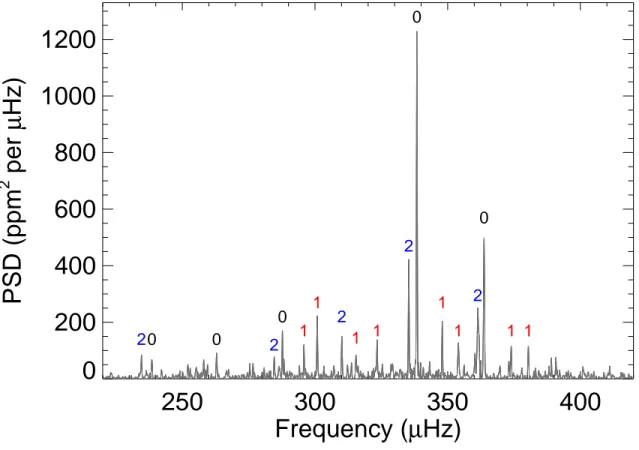
From our discussion above we find that ν Indi is an in situ star whose age can provide insights on the origin of the low [Fe/H], high [Mg/Fe] population to which it belongs. The new asteroseismic data from TESS provide the means to constrain the age very precisely. ν Indi was included on the 2-minute cadence list by the TESS Asteroseismic Science Consortium (TASC) as a prime target for asteroseismology[14]. It was observed for just over 27 days in Sector 1 of TESS science operations. Figure 4 shows the frequency power spectrum of the calibrated lightcurve (see Methods).
The star shows a rich spectrum of overtones of solar-like oscillations, modes that are stochastically excited and intrinsically damped by near-surface convection[15]. The modes may be decomposed onto spherical harmonics of angular degree l. Overtones of radial (l = 0), dipole (l = 1) and quadrupole (l = 2) modes are clearly seen. Because ν Indi is an evolved star, its non-radial modes are not pure acoustic modes. They show so-called “mixed” character[16], due to coupling with waves confined in cavities deep within the star for which buoyancy, as opposed to gradients of pressure, act as the restoring force. Frequencies of mixed modes change rapidly with time as the star evolves toward the red-giant phase, and are very sensitive to the structure of the deepest lying layers providing strong diagnostic constraints on the age and structure of a star. Previous ground-based observations
−300
−200
−100
0
100
200
300
v
φ[km
s
− 1]
all APOGEE DR14 [Mg/Fe] > 0.25 [Mg/Fe] < 0.25−200
0
200
v
R[km s
−1]
−300
−200
−100
0
100
200
300
v
z[km
s
− 1]
Figure 2: Velocities of stars from APOGEE-DR14 having [Fe/H] lying within uncertainties of the [Fe/H] of ν Indi. The points in blue show results for 637 stars with [Mg/Fe]> +0.25, while those in red are for 918 stars with [Mg/Fe]< +0.25. Results on the full APOGEE-DR14 sample are plotted in grey. Plotted, in Galacto-centric cylindrical coordinates and as a function of radial velocity, are tangential velocity (upper panel) and vertical velocity (lower panel). The dashed cross-hair marks the location of ν Indi in these planes.
0.0
0.2
0.4
0.6
0.8
1.0
eccentricity
0
10
20
30
40
z
max
[kp
c]
90%
50%
10%
90%
90%
50%
10%
[Mg/Fe] > 0.25
[Mg/Fe] < 0.25
ν Indi
Figure 3: Contour plot of the distribution in eccentricity, e, and maximum vertical excursion from the Galactic mid-plane, zmax, for the same high (blue) and low (red) [Mg/Fe] samples as stars as Figure 2. The
solid black symbol marks the location of ν Indi. The contours are marked with the corresponding cumulative probabilities for each sample.
250
300
350
400
Frequency (
µ
Hz)
0
200
400
600
800
1000
1200
PSD (ppm
2per
µ
Hz)
20 0 2 0 1 1 2 1 1 2 0 1 1 2 0 1 1Figure 4: Frequency-power spectrum of the TESS lightcurve of ν Indi, showing a rich spectrum of solar-like oscillations. The ordinate is in power spectral density (PSD) units of parts per million squared per µHz. Marked on the plot are the angular degrees, l, of modes whose frequencies we reported in order to model the star.
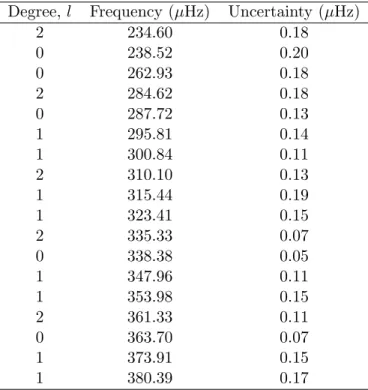
Table 1: Measured oscillation frequencies of ν Indi, with 1 σ uncertainties. Degree, l Frequency (µHz) Uncertainty (µHz)
2 234.60 0.18 0 238.52 0.20 0 262.93 0.18 2 284.62 0.18 0 287.72 0.13 1 295.81 0.14 1 300.84 0.11 2 310.10 0.13 1 315.44 0.19 1 323.41 0.15 2 335.33 0.07 0 338.38 0.05 1 347.96 0.11 1 353.98 0.15 2 361.33 0.11 0 363.70 0.07 1 373.91 0.15 1 380.39 0.17
techniques[20], to intrinsic properties and predicted observables of stellar evolutionary models in evo-lutionary sequences sampling a dense grid in mass and composition. We find a mass of 0.85± 0.04 (stat)±0.02 (sys) M and an age of 11.0± 0.7 (stat) ±0.8 (sys) Gyr. The precision achieved in mass
and age is notably inferior when the asteroseismic inputs are not used.
The asteroseismic age is consistent with the claim that stars in the region of [Mg/Fe]-[Fe/H] space that includes ν Indi were heated kinematically by the Gaia-Enceladus merger. That episode has been estimated to have occurred between 9 and 12 Gyr ago [1, 21, 22]. Recent results also indicate that the in situ halo was in place prior to the merger[22]. We may therefore use the age of ν Indi to place a new limit on the earliest epoch at which the merger occurred (i.e., the star must have already been in place). We must take into account the uncertainty on our estimated age, and the potential duration in time of the merger itself. Numerical simulations in the literature suggest timescales for the relevant mass range of between 1 and 2 Gyr[23]. Using our posterior on the age of ν Indi, and allowing for a spread of up to 2 Gyr for the merger, we estimate the earliest the merger could have begun was 11.6 and 13.2 Gyr ago at 68 and 95 % confidence (see Methods and Figures 6 and 7). The results are fairly insensitive to the merger duration (e.g., reducing the duration to 1 Gyr reduces the 95 % limit by 0.3 Gyr). Theoretical computations, based on hierarchical cosmological models (again, see Methods), suggest a low probability that the merger occurred before ν Indi formed. Including this information tightens (i.e. reduces) slightly the above limits.
References
[1] Helmi, A. et al. The merger that led to the formation of the Milky Way’s inner stellar halo and thick disk. Nat. 563, 85–88 (2018). 1806.06038.
[2] Ricker, G. R. et al. Transiting Exoplanet Survey Satellite (TESS). In Space Telescopes and Instrumentation 2014: Optical, Infrared, and Millimeter Wave, vol. 9143 of SPIE Proceedings, 914320 (2014). 1406.0151.
[3] Stassun, K. G. et al. The TESS Input Catalog and Candidate Target List. Astron. J. 156, 102 (2018). 1706.00495.
[4] Gaia Collaboration et al. Gaia Data Release 2. Summary of the contents and survey properties. Astron. Astrophys. 616, A1 (2018). 1804.09365.
[5] Majewski, S. R. et al. The Apache Point Observatory Galactic Evolution Experiment (APOGEE). Astron. J. 154, 94 (2017). 1509.05420.
[6] Mayor, M. et al. Setting New Standards with HARPS. The Messenger 114, 20–24 (2003). [7] Kaufer, A. et al. Commissioning FEROS, the new high-resolution spectrograph at La-Silla. The
Messenger 95, 8–12 (1999).
[8] Bensby, T., Feltzing, S. & Oey, M. S. Exploring the Milky Way stellar disk. A detailed elemental abundance study of 714 F and G dwarf stars in the solar neighbourhood. Astron. Astrophys. 562, A71 (2014). 1309.2631.
[9] Hayes, C. R. et al. Disentangling the Galactic Halo with APOGEE. I. Chemical and Kinematical Investigation of Distinct Metal-poor Populations. Astrophys. J. 852, 49 (2018). 1711.05781. [10] Mackereth, J. T. et al. The origin of accreted stellar halo populations in the Milky Way using
APOGEE, Gaia, and the EAGLE simulations. Mon. Not. R. Astron. Soc. 482, 3426–3442 (2019). 1808.00968.
[11] Font, A. S. et al. Cosmological simulations of the formation of the stellar haloes around disc galaxies. Mon. Not. R. Astron. Soc. 416, 2802–2820 (2011). 1102.2526.
[12] McCarthy, I. G. et al. Global structure and kinematics of stellar haloes in cosmological hydro-dynamic simulations. Mon. Not. R. Astron. Soc. 420, 2245–2262 (2012). 1111.1747.
[13] Tissera, P. B. et al. The central spheroids of Milky Way mass-sized galaxies. Mon. Not. R. Astron. Soc. 473, 1656–1666 (2018). 1709.06605.
[14] Schofield, M. et al. The Asteroseismic Target List for Solar-like Oscillators Observed in 2 minute Cadence with the Transiting Exoplanet Survey Satellite. Astrophys. J. Supp. Ser. 241, 12 (2019). 1901.10148.
[15] Chaplin, W. J. & Miglio, A. Asteroseismology of Solar-Type and Red-Giant Stars. Ann. Rev. Astron. Astrophys. 51, 353–392 (2013). 1303.1957.
[16] Bedding, T. R. et al. Gravity modes as a way to distinguish between hydrogen- and helium-burning red giant stars. Nat. 471, 608–611 (2011). 1103.5805.
[17] Bedding, T. R. et al. Solar-like Oscillations in the Metal-poor Subgiant ν Indi: Constraining the Mass and Age Using Asteroseismology. Astrophys. J. 647, 558–563 (2006). astro-ph/0604453.
[18] Carrier, F. et al. Solar-like oscillations in the metal-poor subgiant ν Indi. II. Acoustic spectrum and mode lifetime. Astron. Astrophys. 470, 1059–1063 (2007). 0706.0795.
[19] Høg, E. et al. The Tycho-2 catalogue of the 2.5 million brightest stars. Astron. Astrophys. 355, L27–L30 (2000).
[20] Serenelli, A. et al. The First APOKASC Catalog of Kepler Dwarf and Subgiant Stars. Astrophys. J. Supp. Ser. 233, 23 (2017). 1710.06858.
[21] Vincenzo, F. et al. The Fall of a Giant. Chemical evolution of Enceladus, alias the Gaia Sausage. Mon. Not. R. Astron. Soc. 487, L47–L52 (2019). 1903.03465.
[22] Gallart, C. et al. Uncovering the birth of the Milky Way through accurate stellar ages with Gaia. Nat. Ast. 407 (2019). 1901.02900.
[23] Velazquez, H. & White, S. D. M. Sinking satellites and the heating of galaxy discs. Mon. Not. R. Astron. Soc. 304, 254–270 (1999). astro-ph/9809412.
Acknowledgements This paper includes data collected by the TESS mission, which are publicly available from the Mikulski Archive for Space Telescopes (MAST). Resources supporting this work were provided by the NASA High-End Computing (HEC) Program through the NASA Advanced Supercomputing (NAS) Division at Ames Research Center for the production of the SPOC data products. W.J.C. acknowledges support from the UK Science and Technology Facilities Council (STFC) and UK Space Agency. Funding for the Stellar Astrophysics Centre is provided by The Danish National Research Foundation (Grant agreement no.: DNRF106). This research was par-tially conducted during the Exostar19 program at the Kavli Institute for Theoretical Physics at UC Santa Barbara, which was supported in part by the National Science Foundation under Grant No. NSF PHY-1748958. A.M., J.T.M., F.V., and J.M. acknowledge support from the ERC Consolidator Grant funding scheme (project ASTEROCHRONOMETRY, G.A. n. 772293). F.V. acknowledges the support of a Fellowship from the Center for Cosmology and AstroParticle Physics at The Ohio State University. W.H.B. and M.B.N. acknowledge support from the UK Space Agency. K.J.B. is supported by the National Science Foundation under Award AST-1903828. M.B.N acknowledges partial support from the NYU Abu Dhabi Center for Space Science under grant G1502. A.M.S. is partially supported by the Spanish Government (ESP2017-82674-R) and Generalitat de Catalunya (2017-SGR-1131). T.M. acknowledges financial support from Belspo for contract PRODEX PLATO. H.K. acknowledges support from the European Social Fund via the Lithuanian Science Council grant No. 09.3.3-LMT-K-712-01-0103. S.B. acknowledges support from NSF grant AST-1514676 and NASA grant 80NSSC19K0374. V.S.A. acknowledges support from the Independent Research Fund Denmark (Research grant 7027-00096B). D.H. acknowledges support by the National Aeronautics and Space Administration (80NSSC18K1585, 80NSSC19K0379) awarded through the TESS Guest Investigator Program and by the National Science Foundation (AST-1717000). T.S.M. acknowledges support from a visiting fellowship at the Max Planck Institute for Solar System Research. Compu-tational resources were provided through XSEDE allocation TG-AST090107. D.L.B. acknowledges support from NASA under grant NNX16AB76G. T.L.C. acknowledges support from the European Union’s Horizon 2020 research and innovation programme under the Marie Sk lodowska-Curie grant agreement No. 792848 (PULSATION). This work was supported by FCT/MCTES through national funds (PIDDAC) by means of grant UID/FIS/04434/2019. K.J.B., S.H., J.S.K. and N.T. are sup-ported by the European Research Council under the European Community’s Seventh Framework Programme (FP7/2007-2013)/ERC grant agreement no 338251 (StellarAges). E.C. is funded by the European Union’s Horizon 2020 research and innovation program under the Marie Sklodowska-Curie grant agreement No. 664931. L.G.C. acknowledges support from the MINECO FPI-SO doctoral re-search project SEV-2015-0548-17-2 and predoctoral contract BES-2017-082610. P.G. is supported by the German space agency (Deutsches Zentrum f¨ur Luft- und Raumfahrt) under PLATO data grant 50OO1501. R.K. acknowledges support from the UK Science and Technology Facilities Council (STFC), under consolidated grant ST/L000733/1. M.S.L. is supported by the Carlsberg Foundation (Grant agreement no.: CF17-076)”. Z.C.O., S.O. and M.Y. acknowledge support from the Scientific and Technological Research Council of Turkey (T ¨UB˙ITAK:118F352). S.M. acknowledges support from the Spanish ministry through the Ramon y Cajal fellowship number RYC-2015-17697. T.S.R. acknowledges financial support from Premiale 2015 MITiC (PI B. Garilli). R. Sz. acknowledges the support from NKFIH grant project No. K-115709, and the Lend¨ulet program of the Hungarian Academy of Science, project No. 2018-7/2019. J.T. acknowledges support was provided by NASA through the NASA Hubble Fellowship grant No. 51424 awarded by the Space Telescope Science Institute, which is operated by the Association of Universities for Research in Astronomy, Inc., for NASA, under contract NAS5-26555. This work was supported by FEDER through COMPETE2020 (POCI-01-0145-FEDER-030389. A.M.B. acknowledges funding from the European Unions Horizon 2020 research and innovation program under the Marie SklodowskaCurie grant agreement No 749962 (project THOT). A.M. and P.R. acknowledge the support of the Govt. Of India, Department of
Atomic Energy, under Project No. 12-R&D-TFR-6.04-0600.
Author contributions W.J.C. led the project, with help from A.M.S., A.M., S.B. and W.H.B. W.J.C., H.K., W.H.B., H.M.A., T.R.B., R.A.G., D.H., K.J.B., D.L.B., O.B., L.B., T.L.C., E.C., L.G.-C., G.R.D., Y.P.E., P.G., H.G., O.J.H., A.H., S.H., R.H., A.J., R.K., J.S.K., T.K., M.S.L., S.M., B.M., A.M.B., M.B.N., I.W.R., H.S., R.S., N.T., A.E.L.T., M.V. and T.M.W. worked on ex-tracting mode parameters from the TESS data. R.H. and M.N.L. oversaw production of the TESS lightcurves for the asteroseismic analysis. A.M.S., A.M., S.B., W.H.B., A.S., K.V., J.R.M., V.S.A., A.M., P.R., Y.B., J.O., P.B., M.B., K.J.B., D.B., Z.C.O., M.P.D.M., Z.G., S.H., J.M., S.O., B.M.R., T.S.R., D.S., J.T., W.E.v.R., A.W. and M.Y. worked on modelling ν Indi. T.M. performed the spec-troscopic analysis of the archival HARPS and FEROS data on ν Indi. M.B. assessed the impact of NLTE on the spectroscopic analysis. R.E. performed the chromospheric activity analysis of ν Indi. J.T.M. performed the kinematics analysis and comparison of the chemistry of ν Indi with samples of Milky Way stars, and F.V. computed the theoretical prior based on hierarchical cosmological models of structure formation. D.H., K.G.S. and B.S. provided estimates of the luminosity of ν Indi. J.C.-D., H.K., W.J.C., T.R.B., S.D.K., S.B. are key architects of TASC (members of its board), whilst G.R.R., J.M.J., D.W.L., R.K.V., J.N.W. are key architects of the TESS Mission. W.J.C., D.H., T.A., A.M.S., O.C., R.A.G. and T.S.M. oversaw the TASC working groups on solar-like oscillators, and with M.S. and T.L.C., oversaw the selection of short-cadence targets for asteroseismic studies of solar-like oscillators with TESS, which included ensuring ν Indi was included on the list (and hence received the TESS short-cadence data needed to make this study possible). All authors have contributed to the interpretation of the data and the results, and discussion and giving comments on the paper.
Competing InterestsThe authors declare that they have no competing financial interests. CorrespondenceCorrespondence and requests for materials should be addressed to W.J.C.. (email: w.j.chaplin@bham.ac.uk).
Methods
Spectroscopic analysis
The results of our detailed spectroscopic analysis are presented in Table 2
We base the analysis primarily on the average of six HARPS spectra obtained in 2007 December, retrieved from the instrument archives. They have a resolving power, R, of 115 000 and cover the spectral domain from 379 to 691 nm (with a gap between 530.4 and 533.8 nm). The signal-to-noise ratio, S/N, at 550 nm lies in the range 177 to 281. We carried out a differential, line-by-line analysis relative to the Sun. The high-quality (S/N∼470) solar HARPS spectrum was taken from the online library of Gaia FGK benchmarks[1]. It is a solar reflected spectrum from asteroids with a similar resolution to that of the spectra for ν Indi. For oxygen we made use of the OI triplet at∼777.4 nm. Because this range is not covered by the HARPS spectra, we used the spectrum available in the FEROS archives (R ∼ 47 000 and a mean S/N of 340). For the Sun, numerous asteroid spectra were considered. All the spectra were normalised to the continuum by fitting low-order cubic spline or Legendre polynomials to the line-free regions using standard tasks implemented in the IRAF software[2].
The stellar parameters and abundances of 20 elements were determined self-consistently from the spectra, plane-parallel MARCS model atmospheres[3], and the 2017 version of the line-analysis software MOOG. We used a line list[4] augmented[5, 6] for C I, Sc II, Mn I, Co I, Cu I, Zn I, Y II, and Zr II. Equivalent widths (EW) were measured manually assuming Gaussian profiles. Only lines above 480.0 nm were considered because of strong line crowding in the blue that leads to an uncertain placement of the continuum. With the exception of Mg I λ571.1, lines with relative width RW = log(EW/λ) > –4.8 were discarded. Hyperfine structure (HFS) and isotopic splitting were taken into account for Sc, V, Mn, Co, and Cu using atomic data from the Kurucz database with an assumed Cu isotopic ratio[7]. The blends driver in MOOG was employed for the analysis. The corrections are very small for ν Indi, but can be substantial for the Sun. The determination of the Li and O abundances from Li I λ670.8 and [O I] λ630.0 relied on a spectral synthesis[8], taking the macroturbulent and projected rotational velocities of ν Indi into account[9].
The four model parameters — effective temperature Teff, surface gravity log g, metallicity [Fe/H]
and microturbulence parameter ξ — were modified iteratively until the excitation and ionization balance of iron was fulfilled and the Fe I abundances exhibited no trend with RW. The abundances of iron and the α elements were also required to be consistent with the values adopted for the model atmosphere. For the solar analysis, Teff and log g were held fixed at 5777 K and 4.44 dex,
respectively, whereas the microturbulence, ξ, was left as a free parameter (we obtained ξ = 0.97
km s−1). We also performed the analysis with the surface gravity of ν Indi fixed to the asteroseismic
value of log g = 3.46 dex in order to increase both the accuracy and precision of the spectroscopic results. For this constrained analysis, we adjusted Teff to satisfy iron ionization equilibrium.
The uncertainties in the stellar parameters and abundances were computed following well-established procedures[10]. In particular, the analysis was repeated using Kurucz atmosphere models and the differences incorporated in the error budget. However, the deviations with respect to the default values (Kurucz minus MARCS) appear to be small: ∆Teff = –15 K, ∆ log g = –0.01, and
abundance ratios deviating by less than 0.01 dex.
We also computed corrections to the abundances for non-LTE (NLTE) effects, with those correc-tions defined as the difference in abundance required to fit a line profile using NLTE or LTE models, respectively. The NLTE corrections were estimated for most of the spectral lines in the LTE analysis using the interactive online tool at nlte.mpia.de. Corrections for ν Indi were computed using a MARCS model atmosphere. We also computed corrections for the Sun, but using a more appropriate MAFAGS-OS model, and subtracted the solar corrections from the corrections for ν Indi in order to compensate for the LTE minus NLTE differences in the reference regime. Note the difference
between MARCS and MAFAGS is negligible for main-sequence stars stars[11].
We used the online tool to compute corrections for O, Mg, Si, Ca, and Cr. The data used are based on the NLTE model atoms[11, 12, 13, 14, 15]. NLTE corrections for the lines of Mn were computed separately[16, 17], as these atoms are not yet a part of the publicly released grid that is coupled to the online tool. For several elements, no NLTE data are available in the literature.
We found corrections that are typically within the quoted abundance uncertainties – for example, the correction to the overall Iron abundance [Fe/H] was 0.07 – which do not have a substantial impact on the estimated fundamental properties of the star.
The above analyses yielded an estimated effective temperature of Teff = 5320± 24 K from
the asteroseismically constrained analysis and Teff = 5275± 45 K from the unconstrained
analy-sis; and a NLTE-corrected metallicity of [Fe/H]=−1.43 ± 0.06 from the constrained analysis, and [Fe/H]=−1.46 ± 0.07 from the unconstrained analysis. Detailed chemical abundances are listed in Table 2. The values in brackets give the number of features each abundance is based on. For iron, the number of Fe I and Fe II lines is given. The final iron abundance is the unweighted average of the Fe I and Fe II values. For oxygen, we adopt the value given by [O I] λ 630 because it is largely insensitive to non-LTE and 3D effects.
We also analyzed the chromospheric activity of ν Indi using 116 archival Ca HK spectra from the SMARTS Southern HK program, obtained 2007–2012. The median S-index calibrated to the Mount Wilson scale is 0.138, which is converted to the bolometric-relative HK flux log(R0HK) =−5.16 using an empirical relation[18] and the color index B− V = 0.65. This is in good agreement with other results in the literature [19]. Chromospheric activity is a well-known proxy for age, and this low value is consistent with a very old star[20]. The empirical age-activity relationship[21] is calibrated to a low activity limit of log(R0
HK) = −5.10, corresponding to lower limit age of 8.4 Gyr with an
estimated uncertainty of 60%, consistent with the result from our asteroseismic analysis. APOGEE-DR14 and Gaia -DR2 analysis
To construct Figure 1 of the main paper, we used abundances from the fourteenth data release (DR-14) of the SDSS IV-APOGEE survey, which obtained high resolution (R ' 20, 000), high signal-to-noise ratio (SNR ' 100 per pixel) spectra in the near infrared H-band. We take the calibrated [Fe/H] and [Mg/Fe] abundances directly from the APOGEE DR-14 catalogue, selecting only stars which form part of the main survey (i.e. part of the ”statistical sample”). We also performed a cross match between this catalogue and the stars identified[22] as being part of the Gaia-Enceladus population on the basis of their angular momenta (as measured using Gaia-DR2 data); as such, this population is likely contaminated by thick disk stars, which have considerably higher [Fe/H] and [Mg/Fe] than the true Gaia-Enceladus populations.
For the kinematics analysis (Figures 2 and 3 of the main paper), we used the six-dimensional information (positions and velocities) provided by Gaia-DR2 to derive Galactic orbital parameters for ν Indi, as well as stars from APOGEE-DR14 having [Fe/H] equal (within the uncertainties) to our measured value for ν Indi. APOGEE stars were targeted[23, 24] based on their (J−K) color and H-band magnitude alone, and so the selection does not result in any substantial kinematic biases to
plane of the Galaxy[27], and a solar velocity from a recent re-assessment of the stellar kinematics of the solar neighbourhood[28].
Asteroseismic analysis
The TESS target pixel file data for ν Indi were produced by the TESS Science Operations Center (SPOC)[29], and are available at the Mikulski Archive for Space Telescopes (MAST)
(http://archive.stsci.edu/). The lightcurve we analysed was extracted from target pixel files by the TESS Asteroseismic Science Operations Centre (TASOC) pipeline[30]. A rich spectrum of overtones of radial- and non-radial solar-like oscillations is clearly detectable (see Figure 4 of the main paper). Even though the modes are intrinsically damped, the lifetimes are longer than the 27-day length of the TESS data. The modes may as such be treated as being coherent on the timescale of the lightcurve, and we extracted their frequencies using a well-tested weighted sine-wave fitting analysis[31, 32], which allowed for the varying quality of the TESS photometry over the period of observation. Approaches based on fitting Lorentzian-like models to the resonant peaks[33, 34, 35, 36, 37, 38, 39, 40, 41, 42, 43] gave very similar results. Corrections to the frequencies to allow for the line-of-sight velocity of the star[44] are very small, and do not change the inferred stellar properties. The list of frequencies, together with equivalent 1 σ uncertainties, is presented in Table 1 of the main paper.
The oscillation frequencies were used as input to the stellar modelling, along with spectroscopi-cally derived effective temperature Teff, metallicity [Fe/H], and α-enhancement, [α/Fe], all from the
asteroseismically constrained analysis, and an estimate of the stellar luminosity L = 6.00± 0.35 L ,
using the Gaia-DR2 parallax and Tycho 2 V and B-band magnitudes[45], and a bolometric correc-tion appropriate to the α-enhanced composicorrec-tion[46] (and assuming negligible extinccorrec-tion). We note that a Spectral Energy Distribution (SED) fit[47] gave similar constraints on luminosity.
Prior to use in the modelling we inflated the uncertainties on Teff and [Fe/H] to account for
systematic differences between spectroscopic methods by adding, respectively, 59 K and 0.062 in quadrature to the formal uncertainties[48], yielding final values of Teff = 5320± 64 K and [Fe/H]=
−1.43 ± 0.09.
ν Indi is a metal-poor star showing noticeable α enhancement, which affects the mapping of [Fe/H] to the metal-to-hydrogen abundance ratio Z/X. Some modellers used grids of stellar evolutionary models that did not include the requisite enrichment, and under such circumstances a correction must be applied to the raw [Fe/H] to allow it to be used in modelling using those grids. Here, the correction needed[49] is +0.25. This gave a corrected metallicity of [Fe/H]=−1.18 ± 0.11, where the error bar was inflated further to account for uncertainty in the correction.
Various codes[50, 51, 52, 53, 54, 55, 56, 57] were used to model the star and to explore its fundamental stellar properties. ν Indi is in a rapid stage of stellar evolution, and we found it was imperative that the codes interrogated model grids sampled at a fine resolution in mass and metallicity in order to obtain a good match of predicted observables of the best-fitting model to the actual observables. Our best-fitting estimates are 0.85± 0.04 (stat) ±0.02 (sys) M and an age of
11.0± 0.7 (stat) ±0.8 (sys) Gyr. The central values and statistical uncertainties were provided by one of the codes[52], which returned the best match to the input data. The systematic uncertainties reflect the scatter between different results. In all cases, the errors correspond to a 68 % confidence level.
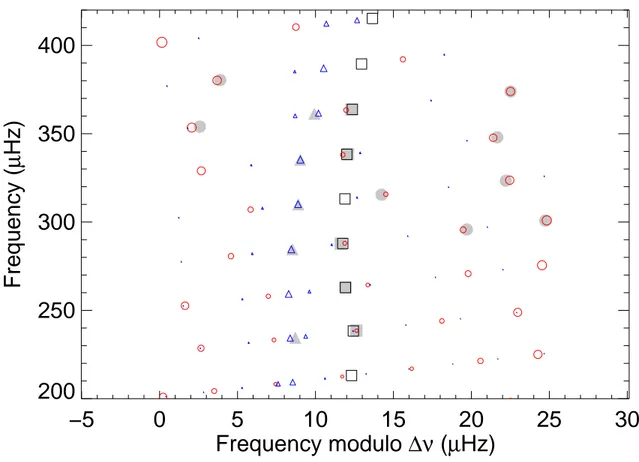
Figure 5 is an ´echelle diagram showing the match between the observed frequencies (in grey) and the best-fitting model frequencies (coloured symbols).
We also tested the impact of removing the asteroseismic frequencies from the modelling. This inflated the fractional uncertainty on the mass (stat) from ' 5 % to ' 8 %, and the fractional un-certainty on age from less than 10 % to more than 30 %.
Gaia -Enceladus epoch analysis
Our estimated age for ν Indi was used to place a new limit on the earliest epoch at which the Gaia-Enceladus merger occurred. This took into account the uncertainty on the estimated age, and the potential duration in time of the merger itself. Figures 6 and 7 capture these results, as we explain below.
To place constraints on the duration of the merger, we estimated the dynamical friction timescale for the orbit of Gaia-Enceladus to decay due to the drag force exerted on it by the diffuse dark matter halo of the Milky Way. We adopted a widely-used formulation[58], assumed that at the epoch of the merger the mass ratio between Gaia-Enceladus and our Galaxy was one-quarter[22], and that the orbit of Gaia-Enceladus was strongly radialised[59]. This procedure gave a merger timescale of less than or around 1 Gyr. Numerical simulations in the literature suggest timescales for the relevant mass range that are between 1 and 2 Gyr[60]. Here, we adopt the largest value of 2 Gyr.
To estimate the limit on the epoch of the merger we started from the probability distribution on the age of ν Indi but considered as the cumulative probability distribution function that expresses the probability of the existence of the star at any given epoch (plotted as a dashed line in Figures 6 and 7). The probability tends to unity at epochs more recent than the central age estimate, and to zero at epochs earlier than the central age estimate. (Note we combined the statistical and systematic errors in quadrature, so that the distribution is described by a mean of 11 Gyr and a standard deviation of 1.1 Gyr.) If the merger was instantaneous, the above distribution function would give us the sought-for limit on the earliest possible epoch. But it is not, and so we used a Gaussian distribution to describe the merger, having a FWHM of up to 2 Gyr. We may consider this function as describing the probability of interaction of the merger with ν Indi. When convolved with the cumulative age probability distribution of the star, we obtain the cumulative probability for the merger (solid black line in Figures 6 and 7), and limits on the earliest epoch of merger of 11.6 Gyr ago at 68 % confidence, and 13.2 Gyr ago at 95 % confidence.
We then folded in a theoretical prior on the probability of occurrence of the merger at different epochs, based on hierarchical cosmological models of structure formation. We estimated a cumu-lative prior probability using the Press-Schechter formalism[58, 61], as the conditional cumucumu-lative probability P(t < tmerg) =P(MMW, t < tmerg|MEnc, tEnc) that the Enceladus dark matter halo (of
mass MEnc) formed at the time tEnc and was later incorporated into the larger Milky Way dark
matter halo (of mass MMW) already in place at the time of the merger t = tmerg, which is the
inde-pendent variable in our computation. We assumed values for the virial mass of the Gaia-Enceladus dark matter halo between a lower limit of MEnc= 1× 10¹⁰M [59] and 1× 10¹¹M [59, 62], formed
at the cosmic time tEnc = 1.5 Gyr which corresponds to the observed median age of Gaia-Enceladus
stars[63]. Finally we assumed that at the epoch of merger the Milky Way dark matter halo had a Virial mass MMW = 4× 10¹¹M , which has been derived at redshift z = 2 from the predicted
cosmological halo mass accretion history of a Milky Way like galaxy[64, 65, 66].
Priors are plotted as a dot-dashed line for MEnc = 1× 10¹⁰M in Figure 6, and 1× 10¹¹M in
Figure 7. Both suggest there was a low probability of the merger occurring prior to the formation of ν Indi. Including the prior, we obtain the cumulative probabilities for the merger shown by the red lines in both figures, which tighten the limiting epoch (at 95 % confidence) to 11.7 Gyr for
Table 2: Spectroscopically derived abundances and 1 σ uncertainties, without (unconstrained) and with (constrained) an asteroseismic constraint on log g. Values in brackets give the number of features each abundance is based on. For iron, the number of Fe I and Fe II lines is given. The final iron abundance is the unweighted average of the Fe I and Fe II based values. Abundances corrected for NLTE effects are marked by an asterisk.
Element Unconstrained Constrained
abundance abundance
[Fe/H]* –1.46±0.07 (58,5) –1.43±0.06 (58,5) [Li/H] –0.01±0.09 (1) +0.04±0.07 (1) [C/Fe] +0.33±0.09 (1) +0.31±0.08 (1) [O/Fe] (O I)* +0.60±0.10 (2) +0.56±0.09 (2) [O/Fe] ([O I])* +0.41±0.09 (1) +0.45±0.08 (1) [Na/Fe] –0.20±0.10 (2) –0.21±0.10 (2) [Mg/Fe]* +0.34±0.08 (1) +0.32±0.08 (1) [Si/Fe]* +0.18±0.06 (7) +0.17±0.06 (7) [Ca/Fe]* +0.41±0.07 (6) +0.40±0.06 (6) [Sc/Fe] +0.00±0.06 (2) +0.02±0.06 (2) [Ti/Fe] +0.27±0.07 (4) +0.27±0.07 (4) [V/Fe] +0.00±0.12 (3) +0.02±0.11 (3) [Cr/Fe]* –0.13±0.08 (1) –0.14±0.08 (1) [Mn/Fe]* –0.23±0.08 (3) –0.23±0.07 (3) [Co/Fe] +0.18±0.10 (3) +0.19±0.09 (3) [Ni/Fe] –0.08±0.07 (13) –0.08±0.07 (13) [Cu/Fe] –0.38±0.08 (1) –0.39±0.08 (1) [Zn/Fe] +0.16±0.09 (1) +0.15±0.09 (1) [Y/Fe] +0.08±0.07 (3) +0.10±0.07 (3) [Zr/Fe] +0.38±0.08 (1) +0.40±0.08 (1) [Ba/Fe] –0.02±0.13 (2) +0.00±0.13 (2)
−5
0
5
10
15
20
25
30
Frequency modulo ∆ν (µHz)
200
250
300
350
400
Frequency (
µ
Hz)
Figure 5: An ´echelle diagram showing the observed frequencies (in grey) and the best-fitting model frequencies (coloured symbols). The diagram was made by dividing the spectrum into segments of length equal to the average frequency separation ∆ν between consecutive overtones, which were then stacked in ascending order, so one plots ν versus (ν mod ∆ν). The l = 0 (radial) modes are plotted with square symbols, the l = 1 (dipole) modes with circular symbols, and the l = 2 (quadrupole) modes with triangular symbols. Symbol sizes reflect the relative visibilities of the different modes, with a suitable correction included to reflect the impact of mixing on the mode inertia. All model frequencies are plotted, irrespective of whether we were able to report a reliable observed frequency for them.
Data Availability
Raw TESS data are available from the MAST portal at https://archive.stsci.edu/access-mast-data. The TASOC lightcurve is available at https://tasoc.dk/. The TESS lightcurve and power spec-trum is also available on request from the corresponding author. The high-resolution spectroscopic data are available at http://archive.eso.org/wdb/wdb/adp/phase3 spectral/form (HARPS ν Indi), https://www.blancocuaresma.com/s/benchmarkstars (HARPS solar spectrum), and
6
8
10
12
14
Age (Gyr)
0.0
0.2
0.4
0.6
0.8
1.0
Probability
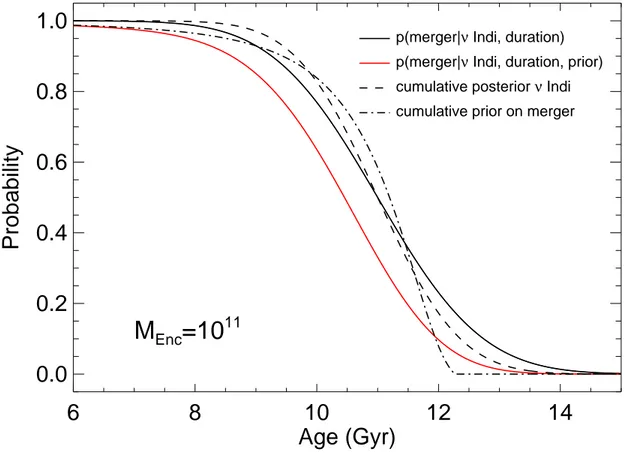
p(merger|ν Indi, duration) p(merger|ν Indi, duration, prior) cumulative posterior ν Indi cumulative prior on merger
M
Enc=10
10Figure 6: Inference on the epoch of the Gaia-Enceladus merger. The dashed black line shows the measured cumulative posterior on ν Indi. The dot-dashed black line is the estimated cumulative prior probability for the merger assuming a virial mass of the Gaia-Enceladus dark matter halo of MEnc= 1× 10¹⁰M . The solid
black line shows the cumulative probability for the merger, dependent on the estimated age of ν Indi and the assumed 2-Gyr-wide merger duration; while the solid red line shows the cumulative probability for the merger also taking into account the merger prior (different in each panel, since this depends on MEnc).
6
8
10
12
14
Age (Gyr)
0.0
0.2
0.4
0.6
0.8
1.0
Probability
p(merger|ν Indi, duration) p(merger|ν Indi, duration, prior) cumulative posterior ν Indi cumulative prior on merger
M
Enc=10
11Figure 7: As per Figure 6, but now assuming a virial mass of the Gaia-Enceladus dark matter halo of 1× 10¹¹M
. [Note the measured cumulative posterior on ν Indi (dashed black line) and the cumulative
probability for the merger (dependent on the estimated age of ν Indi and the assumed 2-Gyr-wide merger duration; black line) are the same as in Figure 6.]
the data include IRAF (http://ast.noao.edu/data/software), MOOG
(https://www.as.utexas.edu/ chris/moog.html), the MCMC code emcee (https://github.com/dfm/emcee), the peak-bagging codes DIAMONDS (https://github.com/EnricoCorsaro/DIAMONDS) and TAMCMC-C (https://github.com/OthmanB/TAMTAMCMC-CMTAMCMC-C-TAMCMC-C), the stellar evolution code MESA
(http://mesa.sourceforge.net/), and the stellar pulsation code GYRE
(https://bitbucket.org/rhdtownsend/gyre/wiki/Home). Other codes used in the analysis – including frequency analysis tools – are available on reasonable request via the corresponding author.
References
[1] Blanco-Cuaresma, S., Soubiran, C., Jofr´e, P. & Heiter, U. The Gaia FGK benchmark stars. High resolution spectral library. Astron. Astrophys. 566, A98 (2014). 1403.3090.
[2] Tody, D. The IRAF Data Reduction and Analysis System. In Crawford, D. L. (ed.) Instrumen-tation in astronomy VI, vol. 627 of Society of Photo-Optical InstrumenInstrumen-tation Engineers (SPIE) Conference Series, 733 (1986).
[3] Gustafsson, B. et al. A grid of MARCS model atmospheres for late-type stars. I. Methods and general properties. Astron. Astrophys. 486, 951–970 (2008). 0805.0554.
[4] Chen, Y. Q., Nissen, P. E., Zhao, G., Zhang, H. W. & Benoni, T. Chemical composition of 90 F and G disk dwarfs. Astron. Astrophys. Supp. 141, 491–506 (2000). astro-ph/9912342. [5] Mel´endez, J. et al. 18 Sco: A Solar Twin Rich in Refractory and Neutron-capture Elements.
Implications for Chemical Tagging. Astrophys. J. 791, 14 (2014). 1406.5244.
[6] Reddy, B. E., Tomkin, J., Lambert, D. L. & Allende Prieto, C. The chemical compositions of Galactic disc F and G dwarfs. Mon. Not. R. Astron. Soc. 340, 304–340 (2003). astro-ph/ 0211551.
[7] Asplund, M., Grevesse, N., Sauval, A. J. & Scott, P. The Chemical Composition of the Sun. Ann. Rev. Astron. Astrophys. 47, 481–522 (2009). 0909.0948.
[8] Morel, T. et al. Atmospheric parameters and chemical properties of red giants in the CoRoT asteroseismology fields. Astron. Astrophys. 564, A119 (2014). 1403.4373.
[9] Bruntt, H. et al. Accurate fundamental parameters for 23 bright solar-type stars. Mon. Not. R. Astron. Soc. 405, 1907–1923 (2010). 1002.4268.
[10] Morel, T. The chemical composition of α Centauri AB revisited. Astron. Astrophys. 615, A172 (2018). 1805.00929.
[11] Bergemann, M., Lind, K., Collet, R., Magic, Z. & Asplund, M. Non-LTE line formation of Fe in late-type stars - I. Standard stars with 1D and 3D model atmospheres. Mon. Not. R. Astron. Soc. 427, 27–49 (2012). 1207.2455.
[12] Bergemann, M. & Cescutti, G. Chromium: NLTE abundances in metal-poor stars and nucle-osynthesis in the Galaxy. Astron. Astrophys. 522, A9 (2010). 1006.0243.
[13] Bergemann, M., Pickering, J. C. & Gehren, T. NLTE analysis of CoI/CoII lines in spectra of cool stars with new laboratory hyperfine splitting constants. Mon. Not. R. Astron. Soc. 401, 1334–1346 (2010). 0909.2178.
[17] Bergemann, M. et al. On the origin of the elements. I. 3D NLTE formation of Mn lines in late-type stars. Astron. Astrophys. arXiv:1905.05200 (2019). 1905.05200.
[18] Noyes, R. W., Hartmann, L. W., Baliunas, S. L., Duncan, D. K. & Vaughan, A. H. Rotation, convection, and magnetic activity in lower main-sequence stars. Astrophys. J. 279, 763–777 (1984).
[19] Henry, T. J., Soderblom, D. R., Donahue, R. A. & Baliunas, S. L. A Survey of Ca II H and K Chromospheric Emission in Southern Solar-Type Stars. Astron. J. 111, 439 (1996).
[20] Wright, J. T. Do we know of any Maunder minimum stars? Astron. J. 128, 1273 (2004). [21] Mamajek, E. E. & Hillenbrand, L. A. Improved Age Estimation for Solar-Type Dwarfs Using
Activity-Rotation Diagnostics. Astrophys. J. 687, 1264–1293 (2008).
[22] Helmi, A. et al. The merger that led to the formation of the Milky Way’s inner stellar halo and thick disk. Nat. 563, 85–88 (2018). 1806.06038.
[23] Zasowski, G. et al. Target Selection for the Apache Point Observatory Galactic Evolution Experiment (APOGEE). Astron. J. 146, 81 (2013). 1308.0351.
[24] Zasowski, G. et al. Target Selection for the SDSS-IV APOGEE-2 Survey. Astron. J. 154, 198 (2017). 1708.00155.
[25] Bovy, J. galpy: A python Library for Galactic Dynamics. Astrophys. J. Supp. Ser. 216, 29 (2015). 1412.3451.
[26] Gravity Collaboration et al. Detection of the gravitational redshift in the orbit of the star S2 near the Galactic centre massive black hole. Astron. Astrophys. 615, L15 (2018). 1807.09409. [27] Bennett, M. & Bovy, J. Vertical waves in the solar neighbourhood in Gaia DR2. Mon. Not. R.
Astron. Soc. 482, 1417–1425 (2019). 1809.03507.
[28] Sch¨onrich, R., Binney, J. & Dehnen, W. Local kinematics and the local standard of rest. Mon. Not. R. Astron. Soc. 403, 1829–1833 (2010). 0912.3693.
[29] Jenkins, J. M. et al. The TESS science processing operations center. In Software and Cyberin-frastructure for Astronomy IV, vol. 9913 of SPIE Proceedings, 99133E (2016).
[30] Lund, M. N., Handberg, R., Kjeldsen, H., Chaplin, W. J. & Christensen-Dalsgaard, J. Data preparation for asteroseismology with TESS. In European Physical Journal Web of Conferences, vol. 160 of European Physical Journal Web of Conferences, 01005 (2017). 1610.02702.
[31] Kjeldsen, H. et al. Solar-like Oscillations in α Centauri B. Astrophys. J. 635, 1281–1290 (2005). arXiv:astro-ph/0508609.
[32] Bedding, T. R. et al. Solar-like Oscillations in the G2 Subgiant β Hydri from Dual-Site Obser-vations. Astrophys. J. 663, 1315–1324 (2007). arXiv:astro-ph/0703747.
[33] Benomar, O., Appourchaux, T. & Baudin, F. The solar-like oscillations of HD 49933: a Bayesian approach. Astron. Astrophys. 506, 15–32 (2009).
[34] Gaulme, P., Appourchaux, T. & Boumier, P. Mode width fitting with a simple Bayesian approach. Application to CoRoT targets HD 181420 and HD 49933. Astron. Astrophys. 506, 7–14 (2009). 1011.2675.
[35] Mosser, B. et al. Spin down of the core rotation in red giants. Astron. Astrophys. 548, A10 (2012). 1209.3336.
[36] Corsaro, E. & De Ridder, J. DIAMONDS: A new Bayesian nested sampling tool. Application to peak bagging of solar-like oscillations. Astron. Astrophys. 571, A71 (2014). 1408.2515. [37] Corsaro, E., De Ridder, J. & Garc´ıa, R. A. Bayesian peak bagging analysis of 19 mass
low-luminosity red giants observed with Kepler. Astron. Astrophys. 579, A83 (2015). 1503.08821. [38] Vrard, M. et al. Helium signature in red giant oscillation patterns observed by Kepler. Astron.
Astrophys. 579, A84 (2015). 1505.07280.
[39] Nielsen, M. B., Schunker, H., Gizon, L., Schou, J. & Ball, W. H. Limits on radial differential rotation in Sun-like stars from parametric fits to oscillation power spectra. Astron. Astrophys. 603, A6 (2017). 1705.10517.
[40] Roxburgh, I. W. Anomalies in the Kepler Asteroseismic Legacy Project Data A re-analysis of 16 Cyg A and B, KIC 8379927 and 6 solar-like stars. Astron. Astrophys. 604, A42 (2017). 1706.04408.
[41] Garc´ıa Saravia Ortiz de Montellano, A., Hekker, S. & Themeßl, N. Automated asteroseismic peak detections. Mon. Not. R. Astron. Soc. 476, 1470–1496 (2018). 1801.09432.
[42] Benomar, O. et al. Asteroseismic detection of latitudinal differential rotation in 13 Sun-like stars. Sci. 361, 1231–1234 (2018). 1809.07938.
[43] Kallinger, T., Beck, P. G., Stello, D. & Garcia, R. A. Non-linear seismic scaling relations. Astron. Astrophys. 616, A104 (2018). 1805.06249.
[44] Davies, G. R. et al. Why should we correct reported pulsation frequencies for stellar line-of-sight Doppler velocity shifts? Mon. Not. R. Astron. Soc. 445, L94–L98 (2014). 1408.7042.
[45] Høg, E. et al. The Tycho-2 catalogue of the 2.5 million brightest stars. Astron. Astrophys. 355, L27–L30 (2000).
[46] Casagrande, L. & VandenBerg, D. A. Synthetic Stellar Photometry - II. Testing the bolometric flux scale and tables of bolometric corrections for the Hipparcos/Tycho, Pan-STARRS1, SkyMapper, and JWST systems. Mon. Not. R. Astron. Soc. 475, 5023–5040 (2018). 1801.05508.
[47] Stassun, K. G. & Torres, G. Eclipsing Binaries as Benchmarks for Trigonometric Parallaxes in the Gaia Era. Astron. J. 152, 180 (2016). 1609.02579.
[48] Torres, G. et al. Improved Spectroscopic Parameters for Transiting Planet Hosts. Astrophys. J. 757, 161 (2012). 1208.1268.
[52] Serenelli, A. et al. The First APOKASC Catalog of Kepler Dwarf and Subgiant Stars. Astrophys. J. Supp. Ser. 233, 23 (2017). 1710.06858.
[53] Silva Aguirre, V. et al. Standing on the Shoulders of Dwarfs: the Kepler Asteroseismic LEGACY Sample. II.Radii, Masses, and Ages. Astrophys. J. 835, 173 (2017). 1611.08776.
[54] Mosumgaard, J. R., Ball, W. H., Silva Aguirre, V., Weiss, A. & Christensen-Dalsgaard, J. Stel-lar models with calibrated convection and temperature stratification from 3D hydrodynamics simulations. Mon. Not. R. Astron. Soc. 478, 5650–5659 (2018). 1806.00020.
[55] Ball, W. H. & Gizon, L. Surface-effect corrections for oscillation frequencies of evolved stars. Astron. Astrophys. 600, A128 (2017). 1702.02570.
[56] Lebreton, Y. & Goupil, M. J. Asteroseismology for ”`a la carte” stellar age-dating and weighing. Age and mass of the CoRoT exoplanet host HD 52265. Astron. Astrophys. 569, A21 (2014). 1406.0652.
[57] Yıldız, M., C¸ elik Orhan, Z. & Kayhan, C. Fundamental properties of Kepler and CoRoT targets - III. Tuning scaling relations using the first adiabatic exponent. Mon. Not. R. Astron. Soc. 462, 1577–1590 (2016). 1607.03768.
[58] Lacey, C. & Cole, S. Merger rates in hierarchical models of galaxy formation. Mon. Not. R. Astron. Soc. 262, 627–649 (1993).
[59] Belokurov, V., Erkal, D., Evans, N. W., Koposov, S. E. & Deason, A. J. Co-formation of the disc and the stellar halo. Mon. Not. R. Astron. Soc. 478, 611–619 (2018). 1802.03414. [60] Velazquez, H. & White, S. D. M. Sinking satellites and the heating of galaxy discs. Mon. Not.
R. Astron. Soc. 304, 254–270 (1999). astro-ph/9809412.
[61] Mo, H., van den Bosch, F. C. & White, S. Galaxy Formation and Evolution (2010).
[62] Myeong, G. C., Vasiliev, E., Iorio, G., Evans, N. W. & Belokurov, V. Evidence for two early accretion events that built the Milky Way stellar halo. Mon. Not. R. Astron. Soc. 488, 1235– 1247 (2019). 1904.03185.
[63] Gallart, C. et al. Uncovering the birth of the Milky Way through accurate stellar ages with Gaia. Nat. Ast. 407 (2019). 1901.02900.
[64] Correa, C. A., Wyithe, J. S. B., Schaye, J. & Duffy, A. R. The accretion history of dark matter haloes - I. The physical origin of the universal function. Mon. Not. R. Astron. Soc. 450, 1514–1520 (2015). 1409.5228.
[65] Correa, C. A., Wyithe, J. S. B., Schaye, J. & Duffy, A. R. The accretion history of dark matter haloes - II. The connections with the mass power spectrum and the density profile. Mon. Not. R. Astron. Soc. 450, 1521–1537 (2015). 1501.04382.
[66] Correa, C. A., Wyithe, J. S. B., Schaye, J. & Duffy, A. R. The accretion history of dark matter haloes - III. A physical model for the concentration-mass relation. Mon. Not. R. Astron. Soc. 452, 1217–1232 (2015). 1502.00391.
![Figure 2: Velocities of stars from APOGEE-DR14 having [Fe/H] lying within uncertainties of the [Fe/H]](https://thumb-eu.123doks.com/thumbv2/123doknet/5551660.132852/6.918.256.667.213.937/figure-velocities-stars-apogee-dr-having-lying-uncertainties.webp)
![Figure 3: Contour plot of the distribution in eccentricity, e, and maximum vertical excursion from the Galactic mid-plane, z max , for the same high (blue) and low (red) [Mg/Fe] samples as stars as Figure 2](https://thumb-eu.123doks.com/thumbv2/123doknet/5551660.132852/7.918.224.715.351.820/figure-contour-distribution-eccentricity-vertical-excursion-galactic-samples.webp)