doi:10.3168/jds.2007-0231
© American Dairy Science Association, 2008.
Accuracy of Prediction of Gene Content in Large Animal Populations
and its Use for Candidate Gene Detection and Genetic Evaluation
N. Gengler,*†1S. Abras,*‡ C. Verkenne,* S. Vanderick,* M. Szydlowski,*§ and R. Renaville‡*Animal Science Unit, Gembloux Agricultural University, B-5030 Gembloux, Belgium †National Fund for Scientific Research, B-1000 Brussels, Belgium
‡Animal and Microbial Biology Unit, Gembloux Agricultural University, B-5030 Gembloux, Belgium
§Department of Genetics and Animal Breeding, August Cieszkowski Agricultural University of Poznan, Poland
ABSTRACT
To estimate and to use the effects of single genes on quantitative traits, genotypes need to be known. However, in large animal populations, the majority of animals are not genotyped. These missing genotypes have to be estimated. However, currently used methods are impractical for large pedigrees. An alternative method to estimate missing gene content, defined as the number of copies of a particular allele, was recently developed. In this study, the proposed method was tested by assessing its accuracy in estimation and use of gene content in large animal populations. This was done for the bovine transmembrane growth hormone receptor and its effects on first-lactation milk, fat, and protein test-day yields and somatic cell score in Hol-stein cows. Estimated gene substitution effects of re-placing a copy of the phenylalanine-coding allele with a copy of the tyrosine-coding allele were 295 g/d for milk,−8.14 g/d for fat, −1.83 g/d for protein, and −0.022/ d for somatic cell score. However, only the gene substi-tution effect for milk was found to be significant. The accuracy of the estimated effects was evaluated by sim-ulations and permutations. To validate the use of pre-dicted gene content in a mixed inheritance model, a cross-validation study was done. The model with an additional regression of milk, fat, and protein yields and SCS on predicted gene content showed a better capacity to predict breeding values for milk, fat, and protein. Given these results, the estimation and use of allelic effects using this method proved functional and accurate.
Key words: regression on gene content, single gene
effect, test-day model
INTRODUCTION
Animal breeding may benefit from the knowledge of single gene effects on quantitative traits under
selec-Received March 26, 2007. Accepted January 1, 2008.
1Corresponding author: [email protected]
tion. Today there are large data sets for phenotypic records and sparse data sets for genotypes at candidate gene loci. To allow simple and better use of the available data, the missing genotypes can be replaced with pre-dicted values. Israel and Weller (1998, 2002) showed that useful estimates of candidate gene effects can be calculated under an animal model with regression of milk, fat, and protein yields and SCS on genotype proba-bilities or predicted gene content, defined as the number of copies of a particular allele in the genotype of an animal (Lynch and Walsh, 1997). In large pedigrees with sparse molecular data, the currently available methods for calculation of genotype probabilities may be impractical. In large animal populations, the conver-gence of Markov chain Monte Carlo (MCMC) methods cannot be easily monitored, whereas the estimates from iterative peeling and sparse data can strongly depend on the assumed gene frequency, which remains un-known (Gengler et al., 2007). Recently, a more practical method was proposed to approximate gene content in large pedigrees (Gengler et al., 2007). The new method compared very positively to the iterative peeling ap-proach (van Arendonk et al., 1989) applied to a popula-tion under selecpopula-tion and with known gene frequency.
The objective of the present study was to evaluate the accuracy of this new method in estimating and, subsequently, using predicted gene content in the con-text of the estimation of the effects of a candidate gene on first-lactation milk, fat, and protein test-day (TD) yields and SCS in Holstein cows and the estimation of combined breeding values associating single gene effect and polygenic effects.
MATERIALS AND METHODS
Animals and Data
The TD data were provided by the Canadian Dairy Network (Guelph, Canada) for the Holstein breed. We chose to use these data because our molecular data came from Canadian Holstein sires. In the present study, only first-lactation data were analyzed. These
data included 12,858,741 TD records from DIM 4 to DIM 305 for 1,656,599 cows in production born from 1982 through 1999. The mean production per cow per TD was 24.56 kg for milk (SD = 6.4 kg), 903 g for fat (SD = 237 g), 792 g for protein (SD = 192 g), and 2.15 (SD = 1.76) for SCS, which is equal to log2[(SCC)/ 100,000) + 3]. A pedigree file containing 2,755,041 ani-mals (cows with production records and all registered ancestors) born between 1909 and 1999 was also pro-vided by the Canadian Dairy Network.
Candidate Gene Studied
The selected gene was the bovine transmembrane growth hormone-receptor (GHR). Indeed, Falaki et al. (1996) found effects of polymorphism of this gene on milk protein percentage. As reported by Arranz et al. (1998) and Blott et al. (2003), other interesting results showed the possible segregation of a QTL on chromo-some 20 (therefore close to the GHR gene) that seemed to influence milk yield and composition in Holstein dairy cattle. Semen samples of 961 Canadian Holstein AI bulls, born mostly during the late 1980s and early 1990s, were provided by Semex Alliance (Guelph, ON, Canada) for a previous study (Parmentier, 2004). In that study, bulls were genotyped by a PCR allele-spe-cific method to determine if they had a T→A substitu-tion at the transmembrane domain of the GHR gene, leading to the replacement of a phenylalanine by a tyro-sine (Parmentier, 2004). Around 75% of the cows with production records had at least one genotyped sire or grandsire.
Prediction of Gene Content
Gene content was approximated using the method described by Gengler et al. (2007). This method com-putes the conditional expectation of gene contents for nongenotyped animals, given molecular and pedigree data. The Appendix shows an alternative derivation to that given by Gengler et al. (2007), showing the underly-ing hypotheses.
Cross Validation of Gene Content Prediction
The method to predict gene content was used in a preliminary cross-validation study. The aim of this study was to assess the differences between predicted and known genotypes, for animals with known types. For this purpose, a file containing the 961 geno-typed sires was used. The sires were removed one by one from the file and their gene content was estimated by the method described above, using the remaining 960 sires and the relationship between the removed
sire and the other sires. Results obtained for each sire were stored for later comparison to the true gene contents.
For each real gene content (0, 1, and 2), means and standard deviations (SD) of estimated gene contents, and mean square errors (MSE) between real and esti-mated gene contents were calculated. Mean square er-ror was computed as
MSE =
∑
nq
i=1
(qir− qie)2 nq
where qiris the real gene content (0, 1, or 2) of the ith animal, qie is the estimated gene content of the ith animal, and nqis the number of animals with the same real gene content (0, 1, or 2).
Analysis Model
A generic TD model was used; results obtained would have been similar with slightly different models. The analysis model provided flexibility for the fixed portion and a minimum number of parameters for the random portion through the use of polynomials. Random regres-sion effects were modeled using modified Legendre polynomials, to reduce correlations among regression coefficients. The use of third-order polynomials (con-stant, linear, and quadratic) was considered sufficient for a single yield trait to describe the random variation around the fixed lactation curve (Gengler et al., 1999). The 3 modified Legendre polynomials used were:
I0= 1
I1=
√
3x I2=√
5/4(3x2− 1)where x =−1 + 2 [(DIM −1) / (305 −1)] and DIM = days in milk.
The model used for the estimation of the effects in the first-lactation TD records was the following mixed inheritance model:
y = Hhtd + Ssarc + qˆ α + W(Zp + Z∗ a) + e, where y is a vector of production data (TD yields or SCS; 12,858,741 records); htd is a vector of herd and TD fixed effects (1,320,824 levels); sarc is a vector of season, group of age, region, and class of lactation fixed effects (560 levels); α is the allelic substitution effect; p is a vector of permanent environmental random effects
(1,656,599 levels); a is a vector of random polygenic additive effects (2,755,058 levels); e is a vector of resid-ual effects; H, S, Z, and Z* are incidence matrices; qˆ is a vector of estimated gene content for tyrosine coding allele; and W is the covariate matrix for Legendre poly-nomials. There were 2 calving seasons: September to March and April to August. Four groups of calving age were defined: first<25 mo, second between 25 and 30 mo, third between 30 and 35, and fourth>35 mo. The region was a province or a group of provinces. For the 10 different provinces the following regions were defined: British Columbia (region 1); Alberta, Saskatchewan, and Manitoba (region 2); Newfoundland, New Bruns-wick, Nova Scotia, and Prince Edward Island (region 3); Quebec (region 4); and Ontario (region 5). Fourteen lactation stage classes were created. These groups cor-responded to a group of 20 DIM from d 25 (<25, 45, 65...) to d 305. It must be acknowledged that there was no adjustment for the fact that gene content was itself estimated. We did not try to quantify potential loss of variation in the estimates compared with the observed values. Future research should focus on this aspect.
No suitable (co)variance components were directly available; therefore, they were estimated from the ran-dom subset of available data. The sample included 89,877 TD records for 11,844 cows in production. The mean production per cow per TD was 24.18 kg for milk (SD = 6.25 kg), 885 g for fat (SD = 225 g), 782 g for protein (SD = 187 g), and 2.03 for SCS (SD = 1.74). These values were close to those of the whole population in production given before. A pedigree file was extracted from Holstein Canadian database and included 24,138 animals representing selected cows and all their an-cestors.
The model used for the estimation of the variance components was the same as the analysis model. The (co)variance components were obtained using REMLF90 (Misztal, 2002) as described by Gengler et al. (1999).
Estimation of Allelic Substitution Effect and Variance
A preconditioned conjugate gradient solver was used to solve the analysis model (Stranden and Lidauer, 1999). The allelic substitution effect was defined as the expected phenotypic difference resulting from the sub-stitution of a copy of the phenylalanine-coding allele by a copy of the tyrosine-coding allele under the assump-tion of no dominance. This effect is given by α. Associ-ated allelic substitution variance was estimAssoci-ated as 2PA(1− PA)αˆ2, where PAis the frequency of the A allele in the base population.
Validation Through Simulation and Permutations Obtaining exact standard errors for our estimates of single gene effects would have been impossible. Indirect methods exist, such as those based on mixed model conjugate normal equations (Croquet et al., 2006). How-ever, these methods do not take into account the uncer-tainty of the gene content used in the mixed model. Therefore, an alternative indirect method based on per-mutations was used:
Step 1: Genotypes were simulated as described here-after: a biallelic gene was simulated on all the animals of the pedigree without known parents. If only one par-ent was known, only one allele of the gene was simu-lated. Each allele was simulated by sampling once from a uniform distribution. If a value equal or smaller than estimated PA was obtained, the animal received tyro-sine-coding allele; phenylalanine-coding allele was re-ceived otherwise. Once alleles were attributed to all the animals with unknown parents, they were dropped down the pedigree assuming transmission probability of 1/2.
Step 2: Production records of each cow were modified using the simulated genotypes and the allelic substitu-tion effects previously estimated to give y* = y + d, where y = 1 of the production traits, d = α if the simu-lated genotype was homozygote with 2 tyrosine-coding alleles, d =−α if the simulated genotype was homozy-gote with 2 phenylalanine-coding alleles, and d = 0 if the simulated genotype was a heterozygote.
Step 3: Only simulated genotypes of the 961 GHR genotyped bulls were supposed known and for the other animals, gene content was estimated by the method described by Gengler et al. (2007).
Step 4: The allelic substitution effect was estimated using the mixed inheritance model described above with the modified production records (step 2) and esti-mated gene content (step 3).
Steps 1 to 4 were repeated 15 times, which repsented a compromise between available time and re-sources and the natural complexity of a test-day model. Mean, standard deviation, bias, and standard error (Efron and Tibshirani, 1986) were computed from 15 estimates for each production trait using the following definitions. To allow an easy comparison between the different traits, bias and standard errors were com-puted as relative values of simulated parameters for allele frequency and substitution effects:
relative bias (%) =
∑
n i=1(θˆi− θ) n 100 |θ| and relative standard error (%) =⎡ ⎢ ⎣
∑
n i=1(θˆi− θ)2 n − 1 ⎤ ⎥ ⎦ 1/2 100 |θ| ,where n is number of repetitions, here 15; θ = θˆ parame-ter estimate based on original data; θˆi= ith estimate of a parameter based on modified data. To test that allelic effect, α,was significantly different from zero, approxi-mate t-tests were performed for the substitution effects based on the inverse of the relative standard error asso-ciated with 14 degrees of freedom.
Cross Validation of Mixed Inheritance Model Using Predicted Gene Content
To validate the use of predicted gene content in a mixed inheritance model, data splitting (cross-valida-tion) was used because it allows evaluation of the pre-dictive ability of a model. Assessing the prepre-dictive abil-ity of a model involves leaving out a portion of the data, fitting the model to the remainder of the data, and then testing the model fit on the omitted portion. The strategy proposed by Ramirez-Valverde et al. (2001) was used. According to earlier work by Picard and Cook (1984), optimal cross-validation should be done by split-ting data randomly, to imitate a sample of future obser-vations. This is especially true in the setting of genetic evaluations, where we try to predict unknown breeding values from limited knowledge of phenotypes and, in our case, genotypes. Our data splitting technique in-volved duplicating the data set and randomly dis-carding TD records for one-half of the cows in one subset with the TD records of the other half of the cows being discarded for the other subset. This strategy was a slight modification of the one proposed by Ramirez-Valverde et al. (2001), who discarded randomly half of the records, rather than the records belonging to half of the cows. Using the original strategy, the lactation curve of a given cow could still be reasonably well pre-dicted from her remaining records. We think that by eliminating all of her records, we are really able to test the predictive ability of the model. The predictive ability of the mixed inheritance model was compared with the one of the model without the regression on predicted gene content. For each model, breeding values were calculated from both subsets. For the mixed inheritance model including the regression on predicted gene con-tent, combined breeding values were defined as the sum of the polygenic effect and the product of the single gene effect and predicted gene content. Correlations among breeding values obtained from the 2 subsets were calcu-lated. Computations were done for all 4 traits. Ten dif-ferent random samples were created according to the above criteria, and reported correlations were the aver-age of the 10 replicates. For each model, the estimated correlation coefficients provided an estimate of the model performance. Higher correlation estimates be-tween complementary subsets indicate a greater
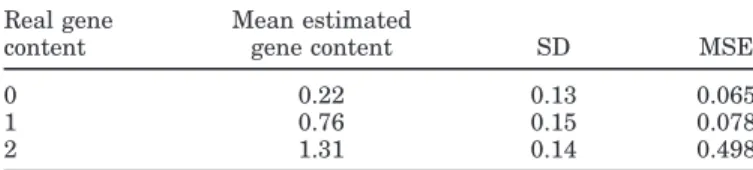
stabil-Table 1. Results of cross validation: means and standard deviations
(SD) of estimated gene contents and mean square errors (MSE) be-tween real and estimated gene content
Real gene Mean estimated
content gene content SD MSE
0 0.22 0.13 0.065
1 0.76 0.15 0.078
2 1.31 0.14 0.498
ity of the model to predict breeding values. Correlation coefficients were calculated for all animals, for all cows with records, and for the 961 genotyped sires.
RESULTS AND DISCUSSION
Cross Validation of Gene Content Prediction
The accuracy of the estimation of the gene content depends strongly on the structure of the pedigree. The purpose of this section was to estimate if the structure of the Canadian Holstein pedigrees could allow us to estimate the gene content precisely. Coefficient of corre-lation of real with estimated gene contents was very high (0.93). This result is greater than the value of 0.47 found by Gengler et al. (2007) in their simulation study using a similar allele frequency (0.20). This suggests that the knowledge of the Canadian Holstein pedigree is very good and that there are good relationships among the 961 sires. Table 1 shows, for the 3 genotypes, mean estimated gene contents, standard deviations, and MSE of observed vs. estimated genotypes. Ob-served bias in the estimation was greatest for the rare genotype (real gene content = 2), which could be ex-pected from the fact that only 62 sires (out of 961) were homozygous.
This cross-validation study was done on sires only. However, we can suppose that the estimations would be at least as good for their daughters, because there should be closer relationships of daughters with their genotyped sires (0.5) and maternal grandsires (0.25) than among genotyped sires. Indeed, Van Doormaal et al. (2005) estimated that the average relationship value among Canadian Holsteins was 0.114, which confirmed the value of 0.117 reported by Auvray et al. (2001), also for Canadian sires.
Estimation of Allelic Substitution Effect and Variance
Estimated effects of a substitution of a copy of the phenylalanine-coding allele by a copy of the tyrosine-coding allele on production traits were 295 g/d for milk, −8.14 g/d for fat, −1.83 g/d for protein, and −0.022 for SCS (Table 2). The frequency of the tyrosine-coding
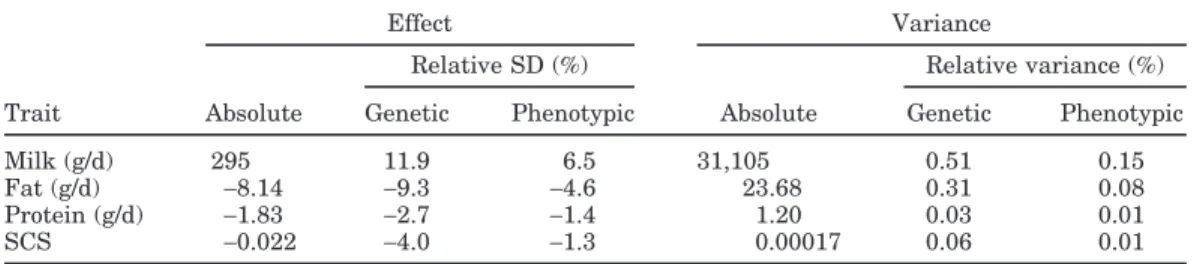
Table 2. Allelic substitution effects and associated variances for milk, fat, and protein yields and SCS
Effect Variance
Relative SD (%) Relative variance (%) Trait Absolute Genetic Phenotypic Absolute Genetic Phenotypic
Milk (g/d) 295 11.9 6.5 31,105 0.51 0.15
Fat (g/d) −8.14 −9.3 −4.6 23.68 0.31 0.08
Protein (g/d) −1.83 −2.7 −1.4 1.20 0.03 0.01
SCS −0.022 −4.0 −1.3 0.00017 0.06 0.01
allele estimated by the new method was found to be 23.3% instead of the 23.8% estimated from the geno-types of the 961 sires. The difference is linked to the fact that the method used to estimate allele frequency weights the importance of every sire relative to its rela-tionship to the population. Therefore, the obtained value reflects the allele frequency of the founders. This is an interesting feature of the method because knowl-edge of this frequency is important in many situations. Compared with genetic and phenotypic standard de-viations, the values in Table 2 show that, expressed as percentage of the average TD genetic (σG) and pheno-typic standard deviation (σP), the relative substitution effect decreased from milk, fat, and SCS relative to that for protein.
Estimated allelic substitution variances are also given in Table 2. Based on absolute values and espe-cially values relative to total genetic and phenotypic variances, the allelic effects considered were nearly neg-ligible compared with the overall average TD genetic (σ2
G) and phenotypic variances (σ2P).
The estimates of gene frequency and allelic effects are in general agreement with the results reported by Blott et al. (2003) for 2 populations of Holstein-Friesian cattle and 1 of Jersey. The rare tyrosine-coding allele was correlated with greater milk yield. As in Blott et al. (2003), the negative effect of tyrosine-coding allele on fat yield and protein yield was not so pronounced. In the present study, the effect on milk yield was greater than that reported by Blott et al. (2003) for the same polymorphism, but explained a similar portion of trait variability. Our estimate of allelic substitution effect was also greater than the one calculated for other candi-date genes under a model with an additive effect of a single SNP (Szyda and Komisarek, 2007).
The larger substitution effect could be explained by the lower range of regressor variable (predicted gene content) because of the fact that no cows were geno-typed. In this case, the average predicted content of tyrosine-coding alleles for cows carrying 2 tyrosine-cod-ing alleles is lower than 2 and is greater than 0 for cows carrying 2 phenylalanine-coding alleles. This should be taken into account in the interpretation of the results.
We anticipate that more cows will be genotyped in the future and the tendency to potentially overestimate the single gene effect decreased. Still, single gene effects estimated in this study can be considered to be small to very small if compared with results of the meta-analysis done by Hayes and Goddard (2001). Indeed, in our study, all allelic substitution effects were equal to or below 0.119 and 0.065 of σGand σP, respectively. Hayes and Goddard (2001) reported that very few single gene effects as small as these were given in the lit-erature.
Validation of Allele Substitution Results
Results of the 15 repetitions, means, SD, relative bias, and relative standard errors for milk, fat, protein and SCS and simulated values for frequency of the tyrosine-coding allele (FA) are in Table 3. Compared with PA, allele frequencies FAprovided by the 15 repeti-tions of the simularepeti-tions had similar mean values. It must be remembered here that only the alleles from unknown parents were simulated using PA; the other alleles were simulated with a one-half probability of receiving each paternal allele. The very low relative bias of 0.2% shows that the estimation of PAbased on the method to approximate gene content is consistent with the value used in the simulation, which is the value estimated from the base population. Moreover, the relative standard error was rather small, indicating that the estimation was not only unbiased but had a low sampling error, too. The new method to estimate allele frequencies proved to be rather reliable. The method proved to be resistant to selection, a feature that is directly built into the system. These results con-firm the conclusion found by Gengler et al. (2007), which showed that this method computes values that are simi-lar to those obtained by MCMC methods and iterative peeling, methods that are theoretically considered to be the most appropriate for genotype probability calcu-lations.
Compared with the estimated values of gene substi-tution effects, the means of the 15 repetitions were very similar for milk and fat yields with relative biases of
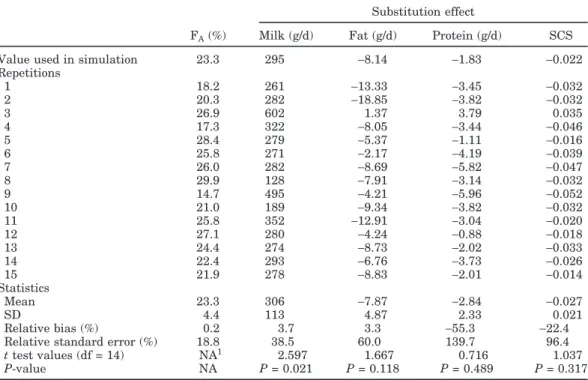
Table 3. Results of the 15 repetitions of the validation results, simulated effects, means, standard deviations,
relative biases, and relative standard errors for FA(estimated allele frequency), milk, fat, and protein yields
and SCS
Substitution effect
FA(%) Milk (g/d) Fat (g/d) Protein (g/d) SCS
Value used in simulation 23.3 295 −8.14 −1.83 −0.022 Repetitions 1 18.2 261 −13.33 −3.45 −0.032 2 20.3 282 −18.85 −3.82 −0.032 3 26.9 602 1.37 3.79 0.035 4 17.3 322 −8.05 −3.44 −0.046 5 28.4 279 −5.37 −1.11 −0.016 6 25.8 271 −2.17 −4.19 −0.039 7 26.0 282 −8.69 −5.82 −0.047 8 29.9 128 −7.91 −3.14 −0.032 9 14.7 495 −4.21 −5.96 −0.052 10 21.0 189 −9.34 −3.82 −0.032 11 25.8 352 −12.91 −3.04 −0.020 12 27.1 280 −4.24 −0.88 −0.018 13 24.4 274 −8.73 −2.02 −0.033 14 22.4 293 −6.76 −3.73 −0.026 15 21.9 278 −8.83 −2.01 −0.014 Statistics Mean 23.3 306 −7.87 −2.84 −0.027 SD 4.4 113 4.87 2.33 0.021 Relative bias (%) 0.2 3.7 3.3 −55.3 −22.4
Relative standard error (%) 18.8 38.5 60.0 139.7 96.4
t test values (df = 14) NA1 2.597 1.667 0.716 1.037 P-value NA P = 0.021 P = 0.118 P = 0.489 P = 0.317
1NA = not applicable.
only 3.7% and 3.3% of the simulated allelic substitution effects. Relative bias was clearly greater for protein and SCS (−55.3% and −22.4%), showing an important overestimation (in absolute figures). Similarly, relative standard errors were lower for milk (38.5%) and fat (60.0%) compared with SCS (96.4%) and protein (139.7%). Table 3 also has the approximated t-test and P-values for milk, fat, protein, and SCS. The level of significance was greatest for milk (P = 0.021), followed by fat (P = 0.11).
This study showed that larger effects are, as ex-pected, easier to estimate precisely. Still, the magnitude of the effects that could be detected was surprisingly low (below 0.1σP) compared with the results reported by Hayes and Goddard (2001) and based on a large number of studies. However, our results also showed large relative standard errors, even for the effect on milk that can be considered significant. This result is in line with the results of Hayes and Goddard (2001), who reported that small to medium QTL effects might simply be artifacts of experimental error. We also found the tendency to overestimate the size of the single gene effects as expected from the results reported by these authors (Hayes and Goddard, 2001). Small effects ap-peared to be most overestimated. However, the results of this simulation study may not prove whether the presented method is superior in its detection power to
traditional methods such as that used by Szyda et al. (2005). Using the same data and a very similar ap-proach to that of Szyda et al. (2005), the results obtained were nearly identical with this method (results not shown). However, the present method is easier and more general because it accepts genotypes from any genotyped animal and integrates smoothly into existing genetic evaluation models of any size and kind. More-over, it allows genetic evaluations for traits where mixed inheritance models combining polygenic and sin-gle gene effects are required. Traditional methods using only some sires that are genotyped are unable to be used directly in this context because they relate more to QTL detection than to genetic evaluation. This method has a much larger scope.
In this study, the simulation approach was based on a real-life situation and compared, under the hypothesis that the effect exists, the estimated value to the simu-lated one. This method has merit in that it is as close as possible to the expected situation. The weak point is that this simulation is done under the hypothesis of a total independence of the simulated gene with the rest of the genome. This hypothesis is obviously far from reality. However, it is at the root of the mixed inheritance model, which does not consider interactions between the gene and the rest of the genome.
Table 4. Mean correlations over 10 independent repetitions between breeding values obtained from 2 random
subsets representing the data for half of the cows with the 2 models (without or with regression on gene content) and for the 3 studied traits (milk, fat, and protein yields, and SCS)
Milk Fat Protein SCS
Group of animals Without With Without With Without With Without With All animals 0.870 0.875 0.893 0.895 0.915 0.919 0.752 0.751 Genotyped sires 0.836 0.841 0.854 0.855 0.853 0.856 0.712 0.712 Cows with records 0.776 0.780 0.786 0.787 0.841 0.843 0.748 0.748
Cross Validation of Mixed Inheritance Model Using Predicted Gene Content
Results of this cross-validation are summarized in Table 4. The correlation coefficients for breeding values for milk, fat, and protein estimated between the 2 sub-sets were slightly higher for the model with an addi-tional regression on predicted gene content, the great-est difference being observed for milk, and then protein and fat. For SCS, correlation coefficients were similar for the 2 models. These results were expected, except for the inversion of the rank of fat and protein, given the results presented earlier and given the fact that small effects are more difficult to estimate precisely.
These results indicate that the model with a regres-sion on predicted gene content has a greater capacity to predict breeding values, at least when single gene effects are sufficiently large (e.g., for milk). Results for fat and especially protein remained positive even when effects were previously found to be insignificant.
CONCLUSIONS
Theoretically, optimal algorithms to estimate miss-ing gene contents are difficult to implement on large pedigrees and potentially not robust enough. Recently, a method was described by Gengler et al. (2007) that has the potential to be used in very large populations. The results reported by these authors were promising compared with currently available alternative meth-ods. In the present study, the accuracy of the estimation and the use of gene content calculated by this method were tested using a different approach. Estimated gene content was used in the context of a mixed inheritance model linking GHR polymorphism to milk, fat, and pro-tein yields and SCS. The validation of the method through simulations and permutations showed that the estimation of allele frequencies and of large allelic ef-fects (e.g., milk) were reliable. Small efef-fects (as for pro-tein in our case) are still difficult to estimate precisely. Nevertheless, the results showed the expected pattern reported from a meta-analysis done by Hayes and God-dard (2001), with a tendency to show large relative standard errors and to overestimate the single gene
effects. Integration of predicted gene content in genetic evaluation models was shown to be functional and has the potential to increase the accuracy of the estimation of breeding values. The method to approximate gene content could be used for detection of candidate gene effects but also in genetic evaluations for traits where mixed inheritance models are required, as long as single gene effects are sufficiently large, which was the case in this study for all traits except SCS.
ACKNOWLEDGMENTS
The authors acknowledge the Canadian Dairy Net-work (Guelph, Canada) and Semex Alliance (Guelph, Canada) for the provision of data and semen samples. Nicolas Gengler who is Research Associate of the Na-tional Fund for Scientific Research (Brussels, Belgium), acknowledges his support. Computations were facili-tated by the grants 2.4.507.02 F and F.4552.05 of the National Fund for Scientific Research. This research was supported by the Federal Belgian Ministry of Small Enterprises, Traders and Agriculture-DGVI (Brussels, Belgium) (grant # S5983) and by Ministry of Agriculture of the Walloon Region of Belgium (MRW-DGA) (Namur, Belgium) (grant # D31–1112).
REFERENCES
Arranz, J. J., W. Coppieters, P. Berzi, N. Cambisano, B. Grisart, L. Karim, F. Marcq, L. Moreau, C. Mezer, J. Riquet, P. Simon, D. Vanmanshoven, D. Wagenaar, and M. Georges. 1998. A QTL affecting milk yield and composition maps to bovine chromosome 20: A confirmation. Anim. Genet. 29:107–115.
Auvray, B., G. R. Wiggans, F. Miglior, and N. Gengler. 2001. Method to establish average relationships among Holstein bull popula-tions over time. J. Dairy Sci. 84(Suppl. 1):215. (Abstr.) Blott, S., J. Kim, S. Moiio, A. Schmidt-Ku¨ ntzel, A. Cornet, P. Berzi,
N. Cambisano, C. Ford, B. Grisart, D. Johnson, L. Karim, P. Simon, R. Snell, R. Spelman, J. Wong, J. Vilkki, M. Georges, F. Farmir, and W. Coppieters. 2003. Molecular dissection of a quantitative trait locus: A phenylalanine-to-tyrosine substitution in the transmembrane domain of the bovine growth hormone receptor is associated with a major effect on milk yield and compo-sition. Genetics 163:253–266.
Croquet, C., P. Mayeres, A. Gillon, S. Vanderick, and N. Gengler. 2006. Inbreeding depression for global and partial economic in-dexes, production, type, and functional trait. J. Dairy Sci. 89:2257–2267.
Efron, B., and R. Tibshirani. 1986. Bootstrap methods for standard errors, confidence intervals, and other measures of statistical accuracy. Stat. Sci. 1:54–77.
Falaki, M., N. Gengler, M. Sneyers, A. Prandi, S. Massart, A. Formi-goni, A. Burny, D. Portetelle, and R. Renaville. 1996. Relation-ships of polymorphism for growth hormone and growth hormone receptor gene with production traits for Holstein Friesian bulls. J. Dairy Sci. 79:1446–1453.
Gengler, N., P. Mayeres, and M. Szydlowski. 2007. A simple method to approximate gene content in large pedigree populations: Appli-cation to the myostatin gene in dual-purpose Belgian Blue cattle. Animal 1:21–28.
Gengler, N., A. Tijani, G. R. Wiggans, and I. Misztal. 1999. Estimation of (co)variance function coefficients for TD yield with a expecta-tion-maximization restricted maximum likelihood algorithm. J. Dairy Sci. 82:1849–1871.
Hayes, B., and M. E. Goddard. 2001. The distribution of the effects of genes affecting quantitative traits in livestock. Genet. Sel. Evol. 33:209–229.
Israel, C., and J. I. Weller. 1998. Estimation of candidate gene effects in dairy cattle populations. J. Dairy Sci. 81:1653–1662. Israel, C., and J. I. Weller. 2002. Estimation of quantitative trait loci
effects in dairy cattle populations. J. Dairy Sci. 85:1285–1297. Lynch, M., and B. Walsh. 1997. Genetics and Analysis of Quantitative
Traits. Sinauer Associates Inc., Sunderland, MA.
Misztal, I. 2002. REMLF90 manual. University of Georgia, Athens. http://nce.ads.uga.edu/∼ignacy/numpub/blupf90/docs/
remlf90.pdf. Accessed Dec. 2007.
Parmentier, I. 2004. Studies of polymorphisms from candidate gene associated with bovine dairy prodution. PhD thesis. Gembloux Agricultural University, Gembloux, Belgium.
Picard, R., and D. Cook. 1984. Cross-validation of regression models. J. Am. Stat. Assoc. 79:575–583.
Ramirez-Valverde, R., I. Misztal, and J. K. Bertrand. 2001. Compari-son of threshold vs. linear and animal vs. sire models for pre-dicting direct and maternal genetic effects on calving difficulty in beef cattle. J. Anim. Sci. 79:333–338.
Stranden, I., and M. Lidauer. 1999. Solving large mixed linear models using preconditioned conjugate gradient iteration. J. Dairy Sci. 82:2779–2787.
Szyda, J., and J. Komisarek. 2007. Statistical modeling of candidate gene effects on milk production traits in dairy cattle. J. Dairy Sci. 90:2971–2979.
Szyda, J., Z. Liu, F. Reinhardt, and R. Reents. 2005. Estimation of quantitative trait loci parameters for milk production traits in German Holstein dairy cattle population. J. Dairy Sci. 88:356– 367.
van Arendonk, J. A. M., C. Smith, and B. W. Kennedy. 1989. Method to estimate genotype probabilities at individual loci in farm live-stock. Theor. Appl. Genet. 78:735–740.
Van Doormaal, B. J., F. Miglior, G. Kistemaker, and P. Brand. 2005. Genetic diversification of the Holstein breed in Canada and inter-nationally. Interbull Bull. 33:93–97.
APPENDIX
An alternative derivation of the conditional expecta-tion of gene contents for nongenotyped animals given molecular and pedigree data method given by Gengler
et al. (2007) can be based on its analogy to the prediction of unknown breeding values from known breeding val-ues and pedigree data as:
gˆx= (1 AxyA−1y ) ⎛ ⎜ ⎝ g gˆy − 1g ⎞ ⎟ ⎠
where gˆx is a vector of unknown breeding values, 1 is a vector of ones, gˆyis a vector of known breeding values,
Axyis the additive relationship matrix between individ-uals with unknown breeding values and their relatives with known breeding values, Ayis the additive relation-ship matrix among individuals with breeding values andgis the average breeding value and could also be a genetic group estimate.
We can then rewrite breeding values as the sum of single gene effects for every biallelic locus i. By doing this we obtain the following prediction equations:
gˆx=
∑
i αˆiqxi= (1 AxyA−1y ) ⎛ ⎜ ⎜ ⎝∑
i αˆii∑
i αˆiqyi− 1∑
i αˆii ⎞ ⎟ ⎟ ⎠ , where gˆy=∑
i αˆiqyi,g=∑
iαˆii, αˆiis the allele substitu-tion effect for locus i, qyi is a vector of known gene contents (genotyped animals) for locus i, qxiis a vector of unknown gene contents (ungenotyped animals) for locus i,iis the average allele content for locus i which is also equal to the allele frequency× 2. Under certain hypotheses, such as the normality of the contributions of single gene effects to breeding values, we can write for a given locus i:
αˆ qx= (1 AxyA−1y ) ⎛ ⎜ ⎝ αˆ αˆ (qy− 1) ⎞ ⎟ ⎠.
The conditional expectation of gene contents for non-genotyped animals, given molecular and pedigree data, are then simply derived by dividing both sides of the equation by the allele substitution effect αˆ :
qx= (1 AxyA−1y )⎛⎜ ⎝ qy − 1 ⎞ ⎟ ⎠.