HAL Id: hal-01272124
https://hal.archives-ouvertes.fr/hal-01272124
Submitted on 10 Feb 2016HAL is a multi-disciplinary open access archive for the deposit and dissemination of sci-entific research documents, whether they are pub-lished or not. The documents may come from teaching and research institutions in France or abroad, or from public or private research centers.
L’archive ouverte pluridisciplinaire HAL, est destinée au dépôt et à la diffusion de documents scientifiques de niveau recherche, publiés ou non, émanant des établissements d’enseignement et de recherche français ou étrangers, des laboratoires publics ou privés.
Relationships between Consumption, Publication and
Impact in French Universities in a value perspective: A
Bibliometric Analysis
Chérifa Boukacem-Zeghmouri, Pascal Bador, Thierry Lafouge, Hélène Prost
To cite this version:
Chérifa Boukacem-Zeghmouri, Pascal Bador, Thierry Lafouge, Hélène Prost. Relationships between Consumption, Publication and Impact in French Universities in a value perspective: A Bibliometric Analysis. Scientometrics, Springer Verlag, 2016, 106 (1), pp.263-280. �10.1007/s11192-015-1779-z�. �hal-01272124�
Relationships between Consumption, Publication and Impact in French Universities in a value perspective: A Bibliometric Analysis
Chérifa Boukacem-Zeghmouri (1), author to whom correspondence should be addressed, [email protected]
Pascal Bador (1) Thierry Lafouge (1) Hélène Prost (2)
(1) Université de Lyon, Lyon, F-69008, France ; Université Lyon 1, équipe ELICO, 43 Bd. du 11 novembre 1918, Villeurbanne, F-69622, France
(2) INIST – CNRS, 2, allée du Parc de Brabois, CS 10310, Vandoeuvre-lès-Nancy, F-54519, France
Abstract
The study aims to investigate the relationships between consumption of e-journals distributed by Elsevier ScienceDirect platform, publication (articles) and impact (citations) in a sample of 13 French universities, from 2003 to 2009. It adopts a value perspective as it questions whether or not publication activity and impact are some kind of return led by consumption. A bibliometric approach was used to explore the relations between these three variables. The analysis developed indicators inspired by the mathematical h-Index technique.
Results show that the relation between consumption, publication and citations depends on the discipline’s profile, the intensity of research and the size of each institution. Moreover, although relations have been observed between the three variables, it is not possible to determine which variable comes first to explain the phenomena. The study concludes by showing strong correlations, which nevertheless do not lead to clear causal relations.
The article provide practical implication for academic library managers who want to show the added value of their electronic e-journals collections can replicate the study approach. Also for policy makers who want to take into account e-journals usage as an informative tool to predict the importance of publication activity.
Originality: The study is the first French contribution to e-journal value studies. Its
originality consists in developing a value viewpoint that relies on a bibliometric approach.
Keywords: scholarly journals, e-journals, ScienceDirect, value, academic libraries,
downloads, citations, impact, articles, publication, research outcomes, h-index, France, bibliometry.
Introduction
Access to scientific information has never been more significant and straightforward than in the last fifteen years. Although inequalities still exist (Rin 2011a), various studies confirm that researchers are clearly integrating electronic resources as part of the researcher’s behaviour. Scholarly e-journals are a big part of this phenomenon and several studies indisputably show that researchers integrated them in their research practices and behaviour (Nicholas et al. 2011).
Such observations also apply to the French academic world. A national research project dedicated to the analysis of the access and usage of e-journals gave insight on the fact that they are part of the French researcher’s everyday activity (Boukacem-Zeghmouri and Schöpfel 2008) (Boukacem-Zeghmouri 2012). French researchers’ e-journal usage and access patterns are similar to those observed in the UK and in the USA (Boukacem-Zeghmouri and Schöpfel 2013). They use Google as the starting point of their information seeking behaviours, navigate, bounce and follow search and discovery itineraries (Boukacem-Zeghmouri 2010) (Boukacem-(Boukacem-Zeghmouri 2012) (Lewandowski 2010).
Through Figure 1 below, we can look at the journal download activity on Elsevier’s
ScienceDirect platform, over a nine-year period (2001 to 2009) for the 68 French university
institutions (amidst 96) that presented reliable data. The growth rate for 2001-2005 was of 300%. This corresponds to when the French Couperin Consortium1, which had originally launched in 1999 with 4 members, extended to nearly all university institutions and negotiated an increasingly large number of resources. The curve shows a period of stability from 2005 to 2007 that can be attributed to the launch of the CNRS’s (National Centre for Scientific Research) portals, upheld by the Institute for Scientific and Technical Information (INIST) (Drouard et al. 2009).
Thus, in the cases of some universities, two sources are provided for the same resource. Downloads that operated through the CNRS wasn’t taken into account in this figure, but we can observe that consumption increased from 2007 to 2009 at a rate of about 40%. Based on these numbers, we can state that French researchers responded very positively to online access of scholarly journals.
1 - Consortium Unifié des Etablissements Universitaires et de Recherche pour l’Accès aux Publications Numériques (University and Research Institutions’ Unified Consortium for Access to Digital Publications):
Fig 1 Evolution of downloads on ScienceDirect platform in France (68 universities)
After having studying usage and behavior of e-journals by French STM scholars Zeghmouri and Kamga 2008) Zeghmouri and Schöpfel 2008) (Boukacem-Zeghmouri 2012) (Boukacem-(Boukacem-Zeghmouri and Schöpfel 2013), the purpose of this article is to move forward and to raise new research questions, related to the impact of this amount of consumption. A new research question is whether or not large-scale access to e-journals has an impact on the French researcher’s publication activity.
The article presents some of the results of a recent French research study whose main objective was to investigate the value of usage of Elsevier e-journals (from ScienceDirect Platform) in 68 French universities, with a diachronic analysis over a period of 7 years (from 2003 to 2009) (Boukacem-Zeghmouri 2014).
Literature review
When considering the realities of economic downturn on academic libraries (Nicholas et al. 2010), a question arises: what are the benefits of having such wide consumption on the publication activity? Does wider access to e-journals lead researchers to greater productivity? In other words, does the proven increase in e-journal consumption help researchers to publish more?
These questions are legitimate considering the consequential amounts of money used for subscriptions (Rodríguez-Bravo and Alvite-Diez 2013) (Tenopir et al. 2010). Policymakers are very concerned by the value of digital collections and their consumption given that academic libraries are universities scientific tools with the mission to support research. These questions also compel us to think about how academic libraries, as stakeholders, can prove their value in the context of a web-based world (Lauridsen 2010).
Libraries collections and services value has been defended using several approaches based on different criteria. The review of the literature converges in admitting the difficulty of proving
0,E+00 2,E+06 4,E+06 6,E+06 8,E+06 1,E+07 1,E+07 1,E+07 2,E+07 2001 2002 2003 2004 2005 2006 2007 2008 2009 D o wn lo ad s Years
this value (Sidorko 2010) (Salaün 2013). Whether quantitative or qualitative, all the approaches imply that libraries and their collections do indeed have implicit value that needs to be demonstrated.
Return On Investment method meant to measure the value of a library’s resources. As it uses an economic approach, the “return” is seen in terms of cost savings and income generation (Sidorko 2010). Previous studies have been conducted to answer questions such as “if one
euro or more is invested, how many dollars or euros come back as income?” (Luther 2008)
(Kaufman 2008). It has been more related to a perspective where income can take the shape of grants, for instance (Tenopir et al. 2010). As for qualitative methods, they use the critical incident to demonstrate the value of library collections (both paper and digital) from a reader’s perspective (Tenopir 2011). In the context of interviews and focus groups, researchers were asked about their last reading to date. Data were then collected to demonstrate to what extent library collections were valuable for reading purposes (Volentine and Tenopir 2013).
Another method, more related to impact analysis, consists in measuring outcomes. Typically, in the case of the study leaded by the CIBER research group (Rin 2009), conducted in 8 British institutions, research outcomes have been considered as the return on investment of e-journal downloads.
Research Questions
The article research question was whether or not large-scale access to e-journals has an impact on the French researcher’s publication activity? This question is particularly sensible for the French context where no study have been conducted on this topic before and where the renewal subscription to Elsevier platform last year was criticized2.
So that, the aim of the study was to explore the relations between three variables: e-journal downloads, published articles and the citations they received. And since we expected downloads and publication activity were to vary from one field to another, the study aimed to shed light on the ways in which the connections between variables behave from one discipline to another.
Because of a lack of reliable data on detailed costs, the study excluded aspects relating to cost savings or income generation. It focused instead on the links between downloads, articles and citation, adopting a bibliometric approach to investigate this further. That made the French study close to Ciber Research Team’s one (Rin 2009). That also made our study focused on a value perspective close to other studies which investigated statistical relationships between journal use and research output (Jung et al. 2015).
The originality of the study lied in the bibliometric approach since the researcher’s scientific outputs were considered as a benefit of downloads. It fits with the national policy directives for evaluations, recommending that articles be published in international indexed journals. We could therefore in this article consider journal downloads as a type of investment that leads to profits: publications and their citations. Both activities, downloads and publications, are active endeavours. Our approach would also lead us to consider publication as generating downloads. That means that the relationship may work in both ways.
Methods
Defining proxies
Articles (research articles and review articles) are defined here as publications and research outcomes. Consumption is defined as articles download. Impact is defined as the citations received by the articles published by the universities.
Through these proxies - all based on the article as a common denominator - our analysis is more consistent with our research question as it puts our variables in relation with each other: consumption of articles, publication of articles and citation of articles.
The Sample
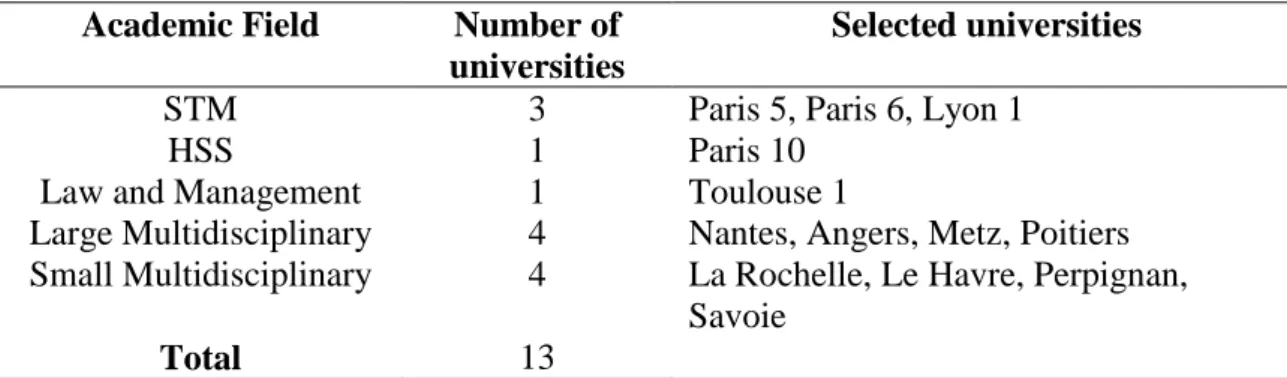
Out of the hundred universities that are included in the Couperin consortium, only 68 presented complete and exploitable data. These 68 universities became the population from which we constituted a sample of 13 institutions, using the quota method on academic field criterion. The sample covered multidisciplinary and mono-disciplinary sections (STM, HSS, Law and Management), taking into account the specificities of the French academic environment (Boukacem-Zeghmouri and Kamga 2008).
Following initial tests, the sample represents 20% of the universities’ total usage and 30% of publication activity. Table 1 below shows the well-balanced breakdown between large universities (such as Paris 6) and smaller ones (such as La Rochelle).
Table 1 Breakdown of the sample, according to the main academic fields
Academic Field Number of
universities
Selected universities
STM 3 Paris 5, Paris 6, Lyon 1
HSS 1 Paris 10
Law and Management 1 Toulouse 1
Large Multidisciplinary 4 Nantes, Angers, Metz, Poitiers Small Multidisciplinary 4 La Rochelle, Le Havre, Perpignan,
Savoie
Total 13
ScienceDirect JR1 Data
Out of all of Couperin’s electronic subscriptions, downloads from the Elsevier package on the
ScienceDirect platform represented 90% of all registered downloads (Boukacem-Zeghmouri
and Kamga 2008). Such a phenomenon, first observed in 2006, continued until 2009. This explains why downloads data relating to the Counter Journal Report 1 (JR1) statistics focused on Elsevier’s journal collections. JR 1 data, provided by Couperin, extended 2100 journal titles (Freedom Collection and individual subscriptions of universities).
Publication
Publication data was taken from Scopus3 database and took author affiliations into account. Two points justify the choice of using Scopus: firstly, the database includes more of the French and European titles in which French researchers publish their articles. That made data collection more exhaustive than when using Web of Science - WOS4; secondly, Scopus’s
3
- https://www.scopus.com
coverage in the fields of HSS and European languages is more extensive than WOS (Chadegani et al 2013). The previous tests conducted in the context of the ROI ELICO study allowed us to observe that Scopus counted 10% more articles than the WOS (Boukacem-Zeghmouri et al. 2014).
Citation Data
Citation data refers to article citations gathered over the course of the two years following publication. For instance, for articles published in 2003, we gathered citations from 2004 and 2005. This 2-year window corresponds to the expected impact of usage that took place in 2003. Complex equations5, based on previous work (Bador and Lafouge 2005), were run on Scopus to address affiliation problems of French institutions and to ensure the most exhaustive data collection.
Period Observed
Data was collected over a 7-year period (2003 – 2005 – 2007 – 2009). This period of observation depended on the availability and reliability of the JR1 data. Within this time frame, we were able to study a sample of universities whose composition remained stable. Starting from 2011, the new law relating to University Liberties and Responsibilities (LRU6) led to mergers among institutions. This change had an impact on our study since the number of institutions was reduced from 100 to 84 (Leroy, 2011), thus changing the academic landscape in which we had situated our work.
Data Presentation
Observing Raw Data
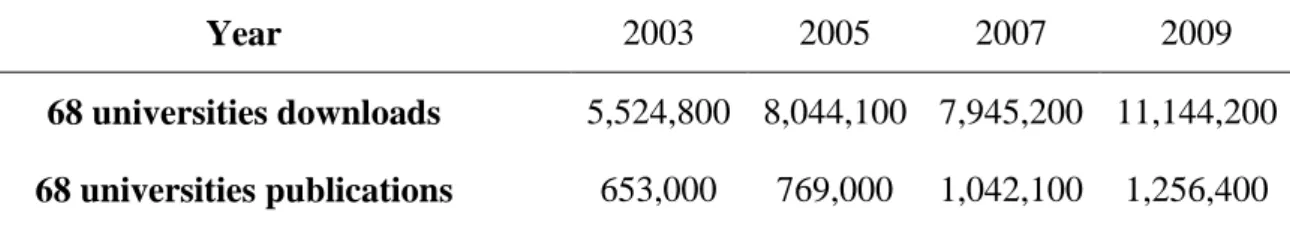
The first step in our study was to lie out raw data of our variables in order to distinguish the main trends. This led us to create a table (Table 2 below) based on all the studied universities. Table 2 below represents the evolution of downloads and articles published for the 68 universities and shows a shared trend of growth, from 2003 to 2009.
Table 2 Breakdown of downloads and publication across 68 French universities, from 2003 to
2009
Year 2003 2005 2007 2009
68 universities downloads 5,524,800 8,044,100 7,945,200 11,144,200
68 universities publications 653,000 769,000 1,042,100 1,256,400
During a second phase, we observed in table 3 the behaviour of the three variables when brought down to the sample.
5 Example of the Lyon 1 equation: ((ID("Universite Claude Bernard Lyon 1" 60023578) OR AF-ID("Universite de Lyon 1 Faculte de Medecine Alexis Carrel" 60029483))) OR ((AFFIL(«lyon AND 1») OR AFFIL(«lyon1») OR AFFIL(«lyon AND i») OR AFFIL(«lyoni») OR AFFIL(ucbl)) OR ((AFFIL(ucb) OR AFFIL(«claude AND bernard»)) AND AFFIL(lyon))) AND (LIMIT-TO(PUBYEAR, 2007))
Table 3 Breakdown of downloads, published articles and citations across the 13 French universities, from 2003 to 2009 Year 2003 2005 2007 2009 Sample’s downloads 1,352,300 1,976,200 2,046,600 2,865,100 Sample’s publications 653,100 769,000 1,976,200 4,603,300 Sample’s Citations 3,481,000 4,603,300 7,235,000 9,623,700
Data in table 3 leads us to observe that the increase from 2003 to 2009 is similar to the national trend mentioned above.
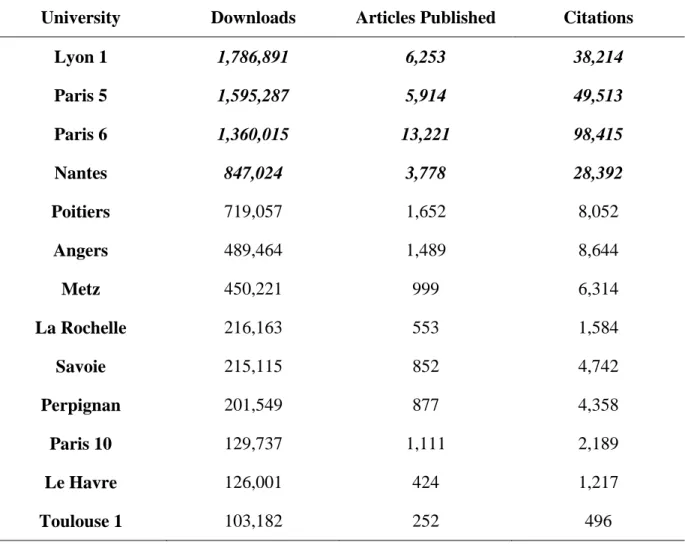
Sample’s Distribution Activity
When we look at the distribution of the sample’s three main activities (cumulated over the course of 2003, 2005, 2007, and 2009) and represented by table 4below, we noticed that four institutions are consistently in the lead: Paris 5, Paris 6, Lyon 1 and Nantes. The first three were STM institutions, whereas Nantes was a Large Multidisciplinary institution.
Table 4 Distribution of downloads, articles published and citation in the sample’s 13
universities
University Downloads Articles Published Citations
Lyon 1 1,786,891 6,253 38,214 Paris 5 1,595,287 5,914 49,513 Paris 6 1,360,015 13,221 98,415 Nantes 847,024 3,778 28,392 Poitiers 719,057 1,652 8,052 Angers 489,464 1,489 8,644 Metz 450,221 999 6,314 La Rochelle 216,163 553 1,584 Savoie 215,115 852 4,742 Perpignan 201,549 877 4,358 Paris 10 129,737 1,111 2,189 Le Havre 126,001 424 1,217 Toulouse 1 103,182 252 496
Concerning downloads; Lyon 1 took the lead and assumed the role of “super user” within the sample. In regards to publication, Paris 6 took the lead and assumed the role of “super producer”. Lyon 1, Paris 5 and Nantes came way behind. In the case of citations, Paris 6 also takes the lead, with the largest amount of citations.
To go further in the analysis of Table 4, we performed 3 linear R2 correlation coefficients: Articles published / Citations: 0.98
Downloads / Articles published: 0.64 Downloads / Citations: 0.63
It is not surprising to observe the significance of the first correlation between the published articles and their citations (0.98). It is commonly admitted that these two activities are correlated. The two others correlations are statistically relevant and lead us to pursue the analysis by creating indicators (see below section Creating indicators).
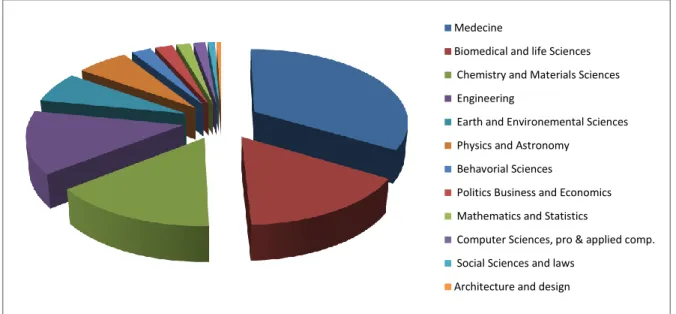
Usage Breakdown According to the Academic Field
In order to identify the thematic distribution of consumption, we indexed the journal titles that had been consulted by the sample, using Ulrichsweb’s7
12 academic fields. Figure 2 gives the breakdown of usage according to each field, from 2003 to 2009.
Fig 2 Breakdown of downloads for the 13 universities in the sample according to the
academic field, cumulated over the years 2003, 2005, 2007 and 2009
STM fields are leaders in terms of consumption, generating 89% of download. Roughly the same proportions could be seen for the thematic distribution of journals in which the sample universities published, STM fields representing 84% of publications and 96% of citations. Table 5 below shows that Medicine and Biomedical and Life Sciences are in the first and second place with the most important downloads, publications and citations. These fields are known for their substantial consumption and publication practices (Rin 2009). Two fields that have very distinctive practices share the third place. Chemistry and Material Sciences for downloads and Physics and Astronomy for publications and citations. Open archives play an
7 - http://ulrichsweb.serialssolutions.com
Medecine
Biomedical and life Sciences Chemistry and Materials Sciences Engineering
Earth and Environemental Sciences Physics and Astronomy
Behavorial Sciences
Politics Business and Economics Mathematics and Statistics
Computer Sciences, pro & applied comp. Social Sciences and laws
important part in the habits of physics researchers (Rin 2011b) whereas researchers in chemistry are conservative and still base their practices on specialized fee-based resources.
Table 5 Classification of the academic fields related to STMs according to each variable for
the sample’s 13 universities
Rank Downloads Publications Citations
1 Medecine Medecine Medecine
2 Biomedical and Life Sciences
Biomedical and Life Sciences
Biomedical and Life Sciences 3 Chemistry and Materials Sciences Physics and Astronomy Physics and Astronomy
4 Engineering Chemistry and
Materials Sciences
Engineering
5 Earth and
Environmental Sciences
Engineering Chemistry and Materials Sciences 6 Physics and Astronomy Earth and Environmental Sciences Earth and Environmental Sciences
Comparatively, HSS fields represent few part of consumption. Such a difference can be explained in three ways. First, Elsevier’s journal bundles focuses on STM fields and is less thorough for HSS fields. Secondly, the research habit of HSS researchers encompasses the use of journals, books and grey literature. Finally, in the case of France, as a francophone country, readership is shared between francophone journals, English-speaking journals and journals written in other European languages (Rin 2011c).
Creating Indicators
It would not be consistent to rely solely on raw data to study value, as this would have led us to draw simplistic conclusions. Therefore, it was important to switch to a bibliometric approach, which served to address some of the study’s issues and to see how the variables were linked, using two indicators.
To this end, both indicators were calculated using the h-Index technique (Hirsch 2005), already used to describe the reputation of journals (Braun et al 2006), (Bador and Lafouge 2010) or institution (Rin 2009). Indicators were created to model each university’s activity through summarized profiles, which could then be compared.
Notoriety Summary Indicator (NSI)
NSI measures the impact of articles published over the course of the observed period in each institution. NSI aims to quantify the notoriety of each institution. It takes into account the number of published articles and the citations received by the articles during the two following years. To calculate NSI, we relied on the h-Index method to characterize the distribution of citations and classified them by decreasing frequency. Figure 3 below shows how NSI was calculated for Lyon 1 University, based on the rankings of the most cited journals. In this case, the NSI value of 51 means that 51 journals – in which articles were published by the university in 2009 – received at least 51 citations in 2010 and 2011.
Fig 3 NSI calculations for Lyon 1 University in 2009
Calculations were done for the thirteen universities in the sample for 2003, 2005, 2007 and 2009. Hence, 52 citation distributions were necessary for the analysis. Table 6 shows a summarized overview. We can see that NSI generally increased over time, as did USI. Once again, the highest indicators came from Paris 5, Paris 6, Lyon 1 and Nantes.
Table 6 Evolution of Notoriety Summary Indicator (NSI), for the 13 universities, from 2003
to 2009
Institution NSI 2003 NSI 2005 NSI 2007 NSI 2009
Angers 17 21 23 26 La Rochelle 7 6 12 12 Le Havre 7 10 9 13 Lyon1 31 36 50 51 Metz 12 14 16 16 Nantes 24 36 37 44 Paris 5 36 41 53 62 Paris 6 53 56 72 86 Paris 10 9 11 11 14 Perpignan 14 13 16 19 Poitiers 17 21 23 23 Savoie 10 11 18 20 Toulouse1 6 8 6 6
Usage Summary Indicator (USI)
The USI was built with the same approach of the previous indicator (NSI), using the same technique as the h-Index. Its significance and its contribution lie in the collection’s usage impact in institutions. USI informs us on the collection’s potential in relation to the institution’s activity.
In order to correlate the NSI with the USI, we proceeded in the same way, building an indicator that summarizes usage. With this approach, we didn’t focus on concentration (standard Lorenz curves) but on the summary of the collection’s usage impact – in terms of downloads - in a given institution.
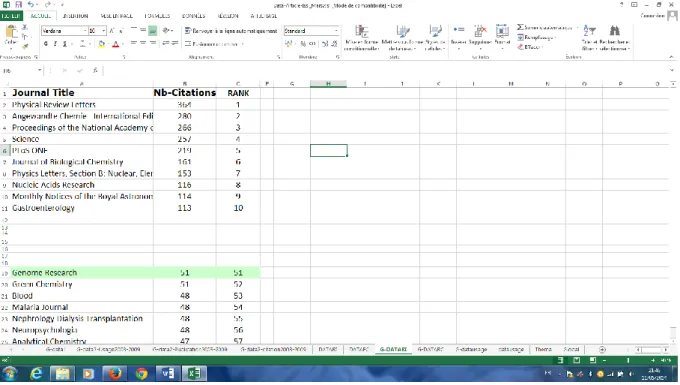
USI creates profiles for each institution summarizing usage based on JR1 downloads. To this aim, we ranked journals by decreasing downloads frequency. Then, we relied on the h-Index method to calculate the indicator. Figure 4 below shows how USI was calculated for Lyon 1 University, based on the ranking of the journals that were the most downloaded. In this case,
The Journal of Prosthetic Dentistry was downloaded 366 times in 2009 and was ranked 366th. USI for Lyon 1 is therefore amounted to 366.
Fig 4 USI calculations for Lyon 1 University in 2009
Calculations were done for the thirteen institutions, for the years 2003, 2005, 2007 and 2009. Table 7 shows that USI generally increased over time. We noticed more specifically that Paris 5, Paris 6, Lyon 1 and Nantes universities had high USIs.
Table 7 Evolution of Usage Summary Indicator (USI), for the 13 universities (from 2003 to
2009)
Institution USI 2003 USI 2005 USI 2007 USI 2009
Angers 134 167 161 169 La Rochelle 89 117 115 132 Le Havre 60 75 71 90 Lyon1 271 333 290 366 Metz 130 154 170 179 Nantes 204 228 216 250 Paris 5 228 297 323 369 Paris 6 235 296 307 363 Paris 10 46 86 91 102 Perpignan 93 119 118 110 Poitiers 175 209 200 218 Savoie 89 121 115 129 Toulouse1 49 72 96 85
Correlations between NSI and USI
NSI and USI indicators show a summarized view of a university’s activity; they are snapshots of a given moment. In order to obtain a relationship between these indicators, we calculated a linear NSI/USI regression for the years 2003, 2005, 2007 and 2009, as shown on table 8 below:
Table 8 The Evolution of the linear correlation coefficient, from 2003 to 2009
Year 2003 2005 2007 2009
NSI/USI Regression Coefficient 0.15 0.15 0.25 0.21
Linear R2correlation coefficient 0.74 0.82 0.88 0.84
The table 8 shows a significant linear R2 correlation coefficient over time. We can therefore say that the results reveal a strong dependency between the institution’s usage and its notoriety.
We represented the linear correlation coefficient for each year in separate graphs. The regression coefficient’s stability was revealed since the positions of the institutions didn’t change significantly over the years. Figure 5 below, representing 2007, is quite similar to the other years studied.
Fig 5 Correlation between NSI and USI in 2007
When observing figure 5, we can identify three groups that present significant behavioural differences:
The first group, identified by a blue circle at the bottom of the figure, regroups small multidisciplinary universities. These universities register the least significant download activity. They are therefore small consumers, given our study’s sample population. These universities are also those whose publication activity is the lowest. Although all French universities combine teaching and research, the research activity of the first group is the lowest, given our study’s parameters. If we were to compare them to the British or American academic systems, these institutions could be identified as “teaching universities”.
Angers La Rochelle Le Havre Lyon1 Metz Nantes Paris 5 Paris 6 Paris 10 Perpignan Poitiers Savoie Toulouse 1 y = 0,2507x - 9,8414 R² = 0,8842 0 10 20 30 40 50 60 70 80 0 50 100 150 200 250 300 350
NSI
USI
The second group, identified by a green circle at the centre of the figure, is composed of large multidisciplinary universities. They are big consumers, and compared to the others, they have an important publication activity, shared between teaching and research.
The third group, identified by an orange circle at the top of the figure is composed of four universities. Three of them are large STM institutions, part of France’s most prestigious universities, present in international rankings. They are research-intensive universities and host mixed laboratories8 where research activity is more intensive and competitive thanks to researchers entirely dedicated to this task. These universities present the highest levels of consumption and notoriety among the sample and can therefore be considered as “super users”. The fourth institution, Nantes University, is a large interdisciplinary institution, which doesn’t have the same status and prestige as the three others in its group. However, Nantes distinguishes itself as a “super user” and “super producer”, focusing on research.
Limitations
Two main limitations must be pointed out, without affecting the relevance of our findings: The only data available in France to study usage are the COUNTER statistics.
MESURE9, the national portal that collects usage data (the equivalent of the British JUSP10) also relies on COUNTER statistics. As of yet, libraries have not performed deep logs analysis - used in other studies for instance (Nicholas et al. 2003; Jung et al. 2013) – which would have allowed us to conduct a more precise and reliable count of HTML and PDF downloads. As shown by previous studies (Davis and Price 2006; Bucknell 2012), the PDF HTML ratio varies substantially in the COUNTER statistics, depending on the publisher’s platform. Furthermore, it has been established that ergonomics of the ScienceDirect platform was elaborated with the idea of downloading articles while navigating (Ke et al. 2002). For instance, PDF icon appears prominently in the menu alongside the summary; the user, while navigating tends to click on the PDF to read the abstract. Number of downloads therefore artificially increases. Previous analyses have allowed us to confirm this phenomenon (Boukacem-Zeghmouri 2012). However, in the context of our study, this bias is restricted since we only took into account the ScienceDirect platform. We did not attempt to compare its usage with other platforms, which could have had different ergonomics and PDF HTML ratios and which therefore couldn’t have been compared. Furthermore, the tests conducted in 2008 by the IT department at the Joseph Fourier University in Grenoble11 were meant to compare a set of COUNTER data with data taken from logs. This comparison showed that the difference in PDF downloads wasn’t very significant (between 2 and 5%).
The usage data from other publisher platforms (IOP, Springer, Wiley) weren’t significant. Such a phenomenon isn’t new and isn’t specific to our sample: the first studies that analyzed usage on publisher platforms across the network of university libraries showed the same thing. Between 2001 and 2005, Elsevier’s traffic continued
8 - Qualified by the French acronym UMR (Mixed Research Unit), are places where research from the university and research from organisations like CNRS are associated.
9 - http://mesure.couperin.org 10
- http://jusp.mimas.ac.uk
to increase compared to other publishers, going from 65 to 85% of downloads (Boukacem-Zeghmouri and Kamga 2008). In the present study, Elsevier represented between 80 and 93% of total downloads in our sample. This is therefore a phenomenon that extends over time and that is visible in our sample. The usage data on other publisher platforms are therefore not significant enough to be considered in our analysis.
Downloads considered for this article only included the Elsevier journals that had been acquired by Couperin (in the case of the Freedom Collection) and by libraries (on a title to title basis). It represents 82 to 90% of the total usage of electronic journals by the 68 French universities, across all publishers (Boukacem-Zeghmouri and Kamga 2008).
Elsevier’s collection favours STM fields and users who are the more frequent. It is not specific to French universities and can be observed in other countries (Rodríguez-Bravo and Alvite-Diez 2013). In the same way, our methodological choices – only considering articles when defining scientific production and choosing a two-year citation window – reinforced the weight of STMs within the study.
Organization of French universities and research is singular. Research teams are often affiliated to more than one institution, meaning that the low value of the USI can be interpreted as being the result of shared usage between two sources: Couperin and the CNRS. This explains why Paris 6, the leading university in France, is so atypical.
Discussion
Consumption, Publication and Impact: A Growing Trend
Out of the three types of activity considered for this study, we noticed that they all increased over the course of the observed period. This growth is seen both through the raw data and through the studied indicators. The three activities are the results of different logics. However, when observing their correlations, they prove to be stable – a stability which could be explained by the stability of the researchers’ behaviour.
This result, close to other similar studies (Rodríguez-Bravo and Alvite-Diez 2013) (Jung, 2015), shows a positive stable correlation. It has bee, previously found by the Ciber research team study and proves that consumption must be taken into account when determining the importance of an institution’s publication and impact. As the Ciber study, we observe that the volume of e-journal consumption in earlier years is a very strong predictor of future research success (Rin 2009) (Nicholas et al 2011).
Importance of the Academic Fields
Our results show that consumption, publication and impact are somehow related, thus confirming the correlation. However, figure 5 clearly showed that the position of institutions on the scatter graph depends on each institution’s main academic field. The three STM institutions (Lyon 1, Paris 6 and Paris 5) stand out as leaders. Similarly, we notice in table 5 that the variables behave differently depending on the field. Differences between journals such as Medicine and Physics are a good example to understand this trend. For Physics, consumption is lower than publication and citation activities, since the field is known for using open archives and pre-prints. It is therefore crucial to take the academic field into account to understand the mechanisms between consumption, publication and impact.
A Causal Link According to the Institution’s Profile
French institutions are all dedicated to teaching and research, irrespective of their size and their main field of study. The two profiles cohabitate and are seen as having equal importance. Hence, based on the analysis of the correlation between USI and NSI indicators, we managed to discern profiles of universities known as “research”, “teaching” or “research and teaching”. “Teaching” institutions were lower on the correlation scale; those with a “research” profile were higher on the correlation scale. Finally, the “teaching-research” institutions were in the middle forming the correlation’s average.
Our study would support the methodological recommendation (Tenopir 2011) stipulating that the value of libraries and their collections can only be considered when the missions of libraries are clearly defined. In other words, the prospected value must be accorded with the library’s mission. For instance, to libraries with a “teaching” profile, the demonstration of their values would lean more towards learning outcomes and not research outcomes.
Based on the study’s three variables, our results contribute to depict the French academic environment more accurately, as French universities are supposedly only known to be “research and teaching” establishments. The study also contributes to precisely understand the French academic world, confirming some characteristics that had previously been known to be true without much proof. Any new study following our footsteps would need to take into account the empirical reality of the universities instead of simply considering their official profiles.
Size of Universities must Be Taken into Account
This correlation brings out a side effect linked to size, which can’t be explained through the differences in academic fields or different institution profiles alone. From the researcher’s standpoint, working in a large institution seems to prompt him/her to generate more usage and to produce more work. This trend plays in the favour of Nantes, a large multidisciplinary university, which left its original group and joined the group of super users. Figure 5 showed that “big consumers” were also the bigger producers; just as smaller users were also smaller producers. A consequence linked to size would exist, as revealed by our sample.
In order to understand this phenomenon, we looked at the interviews that had been conducted for a previous study during the same period and covering the same universities (Boukacem-Zeghmouri 2012). It turned out that researchers in large institutions develop the largest and most integrated habits linked to digital journals. They consult ScienceDirect platform very pragmatically while also conducting intensive searches on search engines, mainly Google. These researchers are constantly connected and consult with different aims in mind (teaching, research, scientific writing, reviewing…) and clearly express the need to “consume” in order to construct and present their own research to their colleagues and to the broader community. This usage dynamic doesn’t appear in small institutions (Boukacem-Zeghmouri 2010).
The Missing Link
Although our results allowed us to find a positive correlation between the two indicators, we cannot ascertain if the correlation runs for USI or NSI. Similarly, these results don’t allow us to know if the prerequisite consists in having a collection of consulted journals or in having researchers who are able to publish in referenced journals.
A qualitative dimension is missing to this study, as it would bring out more sociological elements to explain the dynamics of two very different activities conducted by a single group of people, researchers. This qualitative dimension, whose added value lies in its didactic contribution, would also take contextual elements into account, as the specificity of the
discipline. That would be particularly relevant regarding the evolution of social media tools in the scholarly ecosystem (Tenopir et al. 2013).
Conclusion and perspectives
The results of the study confirmed the correlation between e-journals consumption, publication and citations. Although some limitation, the study confirm that consumption of e-journals contributed to publication and impact in the French universities. The study also revealed that the bigger is the consumption of e-journals, the bigger is the impact. The results shown here seem to support the fact that the bibliometric approach can successfully address value issues in academic libraries. Policy makers will be strongly interested by this result which can lead them to take into account usage of e-journals to predict and observe the rise of specific research profiles of their institution.
Moreover, although relations were observed between the three variables, it was not possible to determine which variable came first to explain the phenomena. The study concluded by showing strong correlations, which nevertheless do not lead to clear causal relations. The size and profile of the university, the field and the intensity of the consumption played an important role to explain the mechanisms of the correlation and its stability. That explained the fact thatNantes, a Large Multidisciplinary university to behave the same way as the three prestigious STM universities in the third group of the correlation in figure 5.
The study provided a better understanding of the French academic environment and confirmed the assumption that all the French universities do not fit with a unique “teaching-research” profile. That’s why a value approach which is solely focused on publication activity and citations, as we conducted, isn’t always appropriate for all universities in France, since they do not present a uniform front, as it was supposed to be.
Any similar study should now take into account the evolution of the researchers behaviour since e-journals access tends to be linked to academic social networks ever since 2010 and 2011 (Rin 2010) (Tenopir et al. 2013). This will constitute an interesting challenge both from a methodological and a research standpoint, to be addressed by future value studies. This will also constitute a perspective for our future researches.
Aknowledgements
Thanks to Carol Tenopir, Dave Nicholas and Ian Rowlands for their constructive remarks during the ROI ELICO seminary12.
The French National consortium Couperin provided financial support for a national seminary held in Lyon13, February 21st 2014, during which the ROI Elico study results were communicated for the first time.
Elsevier provided financial support and full access Scopus throughout the ROI ELICO Study.
12
- http://roi-couperin.sciencesconf.org/ 13 - Idem.
References
Bador, P., & Lafouge, T. (2005). Rédaction des adresses sur les publications. Un manque de rigueur défavorable aux universités françaises dans les classements internationaux. La
Presse Médicale, 34(9), 633–636.
Bador, P., & Lafouge, T. (2010). Comparative analysis between impact factor and h-index for pharmacology and psychiatry journals. Scientometrics, 84(1), 65–7.
Boukacem-Zeghmouri, C. (2010). Pratiques de consultation des revues électroniques par les enseignants chercheurs: les STM en France. Documentaliste - Sciences de l’Information, 47(2), 4–13.
Boukacem-Zeghmouri, C. (2012). Online Article Searching on Publisher Platforms by STM French Scholars: Findings and Analysis. The Canadian Journal of Information and
Library Science, 36(3/4), 88–105.
Boukacem-Zeghmouri, C., Bador, P., Lafouge, T., Prost, H., Schöpfel, J., & Foncel, J. (2014). Retour sur investissement (ROI) de la consultation des revues électroniques en bibliothèques universitaires françaises : Approches bibliométrique et économétrique. Report of the Elico Research Group.
Boukacem-Zeghmouri, C., & Kamga, R. (2008). La consultation de périodiques numériques en bibliothèque universitaire : état des lieux. Bulletin des Bibliothèques de France, 53(3), 48–60.
Boukacem-Zeghmouri, C., & Schöpfel, J. (2008). On the usage of e-journals in French universities. Serials, 21(2), 121–126.
Boukacem-Zeghmouri, C., & Schöpfel, J. (2013). Beyond the Google Generation: Towards Community-Specific Usage Patterns of Scientific Information? In Baker, D. and Evans, W. (eds.), Trends, Discovery and People in the Digital Age (pp. 137-151). Chandos Publishing Online.
Braun, T., Glänzel, W., & Schubert, A. (2006). A Hirsch-type index for journals.
Scientometrics, 69(1), 169–173.
Bucknell, T., (2012). Garbage in, Gospel out: Twelve reasons why librarians should not accept Cost-per-Download figures at face value. The Serials Librarian, 63(2), 192–212. Chadegani, A., Salehi, H., Yunus, M., Farhadi, H., Fooladi, M., Farhadi, M., & Ebrahim, N.
(2013). A comparison between two main academic literature collections: Web of Science and Scopus Databases. Asian Social Science, 9(5), 18–26.
Davis, P. M., & Price, J. S. (2006). eJournal interface can influence usage statistics: implications for libraries, publishers, and project COUNTER. Journal of the American
Society for Information Science and Technology, 57(9), 1243–1248.
Drouard, F., Petitjean, S., & Schöpfel, J. (2009). Les portails d’information du CNRS.
Communication & Langage, 161, 75–92.
Hirsch, J. (2005). An index to quantify an individual’s scientific research output, Proceedings
of the National Academy of Sciences. 102(46), 16569–16572.
Jung, Y., Kim, J., & Kim, H. (2013). STM E-Journal use analysis by utilizing KESLI usage statistics consolidation platform. Collnet Journal of Scientometrics and Information
Jung, Y., Kim, J., So, M., & Kim, H. (2015). Statistical relationships between journal use and research output at academic institutions in South Korea. Scientometrics, 103(3), 751– 777.
Kaufman, P. (2008). The library as strategic investment: Results of the Illinois Return on Investment Study. Liber Quarterly, 18 (3-4), 424–436.
Ke, H. R., Kwakkelaar, R., & Tai, C. (2002). Exploring behaviour of e-journals users in science and technology: transactionlog analysis of Elsevier’s ScienceDirect OnSite in Taiwan. Library & Information Science Research, 24(2), 265–291.
Lauridsen, H. (2010). Library Usage Statistics and ROI (Return On Investment). In Boukacem-Zeghmouri, C. (ed.), L’information scientifique et technique dans
l’univers numérique : Mesures et Usages (pp. 43–53). ADBS, Paris.
Leroy, M. (2011). Universités: Enquête sur le grand chambardement. Editions Autrement Frontières.
Lewandowski, D. (2010). Google scholar as a tool for discovering journal articles in library and information science. Online Information Review, 34(2), 250–262.
Luther, J. (2008). University investment in the library: What’s the return? A case study at the
University of Illinois at Urbana–Champaign.
http://libraryconnect.elsevier.com/sites/default/files/lcwp0101.pdf . Accessed 20 February 2015.
Nicholas, D., Huntington, P., & Watkinson, A. (2003). Digital journals, big deals and online searching behaviour: a pilot study. Aslib Proceedings, 55(1/2), 84–109.
Nicholas, D., Rowlands, I., Jubb, M., & Jamali, H. (2010). The impact of the economic downturn on libraries: With special reference to university libraries. The Journal of
Academic Librarianship, 36(5), 376–382.
Nicholas, D., Rowlands, I., & Williams, P. (2011). E-Journals, researchers and the new librarians, Learned Publishing, 24(1), 15–27.
Rin (2009). E-journals: their use, value and impact. http://www.rin.ac.uk/our-work/communicating-and-disseminating-research/e-journals-their-use-value-and-impact . Accessed 17 July 2014.
Rin (2010). If you build it, will they come? How researchers perceive and use web 2.0.
http://www.rin.ac.uk/our-work/communicating-and-disseminating-research/use-and-relevance-web-20-researchers . Accessed 20 February 2015.
Rin (2011a). Access to Scholarly Content: Gaps and Barriers,
http://www.rin.ac.uk/node/1172. Accessed 17 July 2014.
Rin (2011b). Collaborative yet independent: Information practices in the physical sciences.
http://www.iop.org/publications/iop/2012/file_53558.pdf . Accessed 20 February 2015. Rin (2011c). Reinventing Research? Information Practices in the Humanities.
http://www.rin.ac.uk/our-work/using-and-accessing-information-resources/information-use-case-studies-humanities . Accessed 20 February 2015.
Rodríguez-Bravo, B., & Alvite-Díez, M.L. (2013). Impact of the consumption of electronic contents on research productivity in the universities of Castile and Leon. Library
Salaün, J.M. (2013). The immeasurable economics of libraries, in Rizzo, I. and Mignosa, A. (eds.), Handbook on the Economics of Cultural Heritage (pp. 290-306). Edward Elgar Publishing Limited, Cheltenham.
Sidorko, P.E. (2010). Demonstrating ROI in the Library: the Holy Grail continues. Library
Management, 31(8-9), 645–653.
Tenopir, C. (2011). Beyond usage: measuring library outcomes and value. Library
Management, 33(1-2), 5–13.
Tenopir, C., Love, A., Park, J., Wu, L., Baer, A., & Mays R. (2010). University Investment in the Library, Phase II: An international Study of the Library’s Value to the Grant Process.
http://libraryconnect.elsevier.com/sites/default/files/2010-06-whitepaper-roi2_0.pdf . Accessed 17 July 2014.
Tenopir, C., Volentine, R., & King, D. W. (2013). Social media and scholarly reading. Online
information Review, 37(2), 193-216.
Volentine, R. and Tenopir, C. (2013). Value of academic reading and value of the library in academics’ own words. Aslib Proceedings, 65(4), 425-440.
This study is taken from the first French research project named ROI ELICO conducted by Chérifa Boukacem-Zeghmouri. The main study’s objective was to ascertain any evidence of a relationship between digital scholarly journals and research outcomes using a ROI perspective.