HAL Id: hal-03064989
https://hal.archives-ouvertes.fr/hal-03064989
Submitted on 14 Dec 2020HAL is a multi-disciplinary open access archive for the deposit and dissemination of sci-entific research documents, whether they are pub-lished or not. The documents may come from teaching and research institutions in France or abroad, or from public or private research centers.
L’archive ouverte pluridisciplinaire HAL, est destinée au dépôt et à la diffusion de documents scientifiques de niveau recherche, publiés ou non, émanant des établissements d’enseignement et de recherche français ou étrangers, des laboratoires publics ou privés.
The Rad53 CHK1/CHK2 -Spt21 NPAT and Tel1 ATM
axes couple glucose tolerance to histone dosage and
subtelomeric silencing
Christopher Bruhn, Arta Ajazi, Elisa Ferrari, Michael Charles Lanz, Michael
Lanz, Renaud Batrin, Ramveer Choudhary, Adhish Walvekar, Sunil Laxman,
Maria Pia Longhese, et al.
To cite this version:
Christopher Bruhn, Arta Ajazi, Elisa Ferrari, Michael Charles Lanz, Michael Lanz, et al.. The Rad53 CHK1/CHK2 -Spt21 NPAT and Tel1 ATM axes couple glucose tolerance to histone dosage and sub-telomeric silencing. Nature Communications, Nature Publishing Group, 2020, 11 (1), �10.1038/s41467-020-17961-4�. �hal-03064989�
The Rad53
CHK1/CHK2-Spt21
NPATand Tel1
ATMaxes couple glucose
1
tolerance to histone dosage and subtelomeric silencing.
2 3
Christopher Bruhn,
1,*Arta Ajazi,
1Elisa Ferrari,
1Michael Charles Lanz,
2Renaud
4
Batrin,
3Ramveer Choudhary,
1Adhish Walvekar,
4Sunil Laxman,
4Maria Pia
5
Longhese,
5Emmanuelle Fabre,
3Marcus Bustamente Smolka,
2and Marco Foiani
1,6*6 7
1 The FIRC Institute of Molecular Oncology (IFOM), Via Adamello 16, 20139 Milan, Italy 8
2 Department of Molecular Biology and Genetics, Weill Institute for Cell and Molecular Biology, Cornell 9
University, Ithaca, New York 14853, USA. 10
3 Université de Paris, Laboratoire Génomes, Biologie Cellulaire et Thérapeutiques, CNRS UMR7212, 11
INSERM U944, Centre de Recherche St Louis, F-75010 Paris, France 12
4 Institute for Stem Cell Science and Regenerative Medicine (inStem), Bangalore, Karnataka, 560065, India. 13
5 Dipartimento di Biotecnologie e Bioscienze, Università degli Studi di Milano-Bicocca, Milan, Italy. 14
6 Università degli Studi di Milano, Milan, Italy 15
Correspondence: [email protected] (C.B.) or [email protected] (M.F.) 16
Abstract
1
The DNA damage response (DDR) coordinates DNA metabolism with nuclear and non-nuclear processes. 2
The DDR kinase Rad53CHK1/CHK2 controls histone degradation1,2 to assist DNA repair3. However, Rad53 3
deficiency results in histone-dependent growth defects also in the absence of DNA damage1, pointing 4
out an unknown physiological function of the Rad53-histone regulatory axis. Here we show that histone 5
dosage control by Rad53 ensures metabolic homeostasis. Under physiological conditions, Rad53 6
regulates core histone levels through inhibition of the transcription factor Spt21NPAT by phosphorylation 7
on Ser276. Rad53-Spt21 axis mutants display carbon starvation and severe glucose dependence, which is 8
caused by excess histones through two genetically separable mechanisms: dampening of acetyl-9
coenzyme A-dependent carbon metabolism through histone hyper-acetylation, and Sirtuin-mediated 10
silencing of starvation-induced subtelomeric domains. Subtelomere silencing also causes glucose 11
dependence in TEL1-hy909 and rpd3Δ mutants, revealing a role of the DDR kinase Tel1ATM and Rpd3HDAC 12
glucose tolerance through subtelomeric chromatin regulation but not histone dosage. Our findings 13
identify DDR mutations, histone imbalances and aberrant subtelomeric chromatin as interconnected 14
causes of glucose dependence, implying that DDR kinases coordinate metabolism and epigenetic 15
changes. 16
Main
1
Glucose is the primary carbon source for many tissues, cancer cells and unicellular organisms to fuel energy 2
production and biosynthetic reactions. The glucose demand depends on energy consumption and anabolic 3
activity; a prominent example is the glucose requirement of rapidly dividing cancer cells that undergo 4
metabolic reprogramming 4. Targeting alterations in glucose metabolism 5 and nutrient restriction 6 are 5
promising approaches to complement classical cancer treatment. 6
Cell division is regulated by the metabolic state through the readout of energy charge and metabolite pools 7
7. This sensing is implemented by the action of key metabolites on signaling by either stimulating enzyme 8
activities or acting as rate-limiting post-translational modification donors. Acetyl-Coenzyme A (Ac-CoA) is 9
a central carbon metabolite and the acetyl donor in all acetylation reactions 8,9. While mitochondrial Ac-10
CoA fuels oxidative phosphorylation and thus represents a major energy source, a separate 11
nucleocytoplasmic pool drives essential biosynthetic reactions such as the synthesis of lipids. Ac-CoA is 12
rate-limiting for the acetylation of histones from yeast to human 10-13. Together with the relative activity 13
of histone acetyltransferases (HATs) and histone deacetylases (HDACs), Ac-CoA levels influence histone 14
acetylation, chromatin state and gene expression, coupling metabolic changes to cell cycle control 14-16. 15
While this sensing mechanism likely relies on a physiological balance of Ac-CoA vs Ac-CoA acceptors, it is 16
not known whether and to what extent Ac-CoA metabolism is affected by variations in histones as Ac-CoA 17
acceptors. 18
Budding yeast has the capacity to adapt to various environments, and the underlying sensing processes 19
are evolutionarily conserved 17. High glucose supply supports fermentative metabolism, which is similar to 20
the aerobic glycolysis common to tumor cells. In contrast, glucose restriction leads to the de-repression of 21
starvation response genes and causes a switch to respiratory metabolism 18. This regulation involves the 22
coordinate de-repression of functional silent gene clusters which are mainly located within subtelomeric 23
regions 19. The major player mediating the silencing of these clusters is the Sir complex, which propagates 24
gene silencing from telomeres through histone de-acetylation, catalyzed by the HDAC Sir2SIRT1. Regulators 25
of histone acetylation 20 and telomere length 21 can influence silent chromatin propagation, but the 26
consequent impact on metabolic adaptation is not known. 27
The DNA damage response (DDR) is a conserved signaling network that safeguards genome stability. It is 28
also a crucial coordinator of dNTP 22 and oxidative 23-25 metabolism throughout the cell cycle. In budding 29
yeast, the apical DDR kinases Mec1ATR and Tel1ATM and their downstream kinase Rad53CHK1/CHK2 mediate 30
most DDR functions. We have previously identified a role of the glucose-regulated phosphatase PP2A in 31
the attenuation of DDR activity, implying a coordination of DDR and glucose metabolism 26. Consistently, 32
Rad53 is required for growth in non-glycolytic carbon sources 27. However, none of the currently 33
established DDR functions can mechanistically explain this phenomenon, suggesting an unknown function 34
of the DDR in regulating the tolerance to glucose restriction. 35
In the current study we show that Rad53 mediates tolerance to glucose restriction through inhibitory 36
phosphorylation of the conserved histone transcription factor Spt21NPAT. A defect in this regulation causes 37
the accumulation of highly acetylated histones in rad53Δ mutants. Excess histones confer sensitivity to 38
glucose restriction by affecting Ac-CoA-dependent metabolism and enhancing sirtuin-dependent gene 39
repression. Tel1 contributes to glucose tolerance by modulating subtelomeric silencing. We show that the 40
glucose dependence of DDR mutants can be alleviated by supplying Ac-CoA sources, and by targeting of 41
acetylation turnover, SIR proteins and histone expression. Our data thus identify independent roles of 42
Rad53-Spt21 and Tel1 axes in modulating glucose dependence. 43
Rad53 mediates tolerance to glucose restriction by regulating the Spt21-histone axis.
1
We have previously found that the glucose-regulated phosphatase PP2A attenuates DDR activity 26. We 2
hypothesized that DDR activity may also affect glucose metabolism. We therefore tested by semi-3
quantitative spot assay whether the DDR kinases Mec1ATR, Tel1ATM, Rad53CHK1/CHK2, Chk1CHK1, and Dun1 were 4
required to survive under glucose limitation. mec1Δ and rad53Δ mutants can be kept alive by deleting the 5
SML1 gene, encoding the ribonucleotide reductase (RNR) inhibitor 22. We found that sml1Δrad53Δ mutants 6
were specifically sensitive to glucose restriction (Figures 1A and S1A; D = dextrose/glucose, DR = glucose 7
restriction below 0.05%). We confirmed this observation in rad53-K227A hypomorphic mutants that retain 8
10% of the kinase activity 28 (Figure 1A). Rad53 is activated by Mec1 and Tel1 29. Ablation of MEC1 or TEL1 9
was not sufficient to sensitize to glucose restriction; mec1Δtel1Δ mutants exhibited a near lethal 10
phenotype already in high glucose conditions (Figure 1A). Rad53 activates the Dun1 kinase to promote 11
dNTP synthesis, through inhibition of Sml1. However, dun1Δ mutants were not glucose-dependent, and 12
deletion of SML1 did not alleviate the glucose dependence of the rad53-K227A mutant (Figure 1A), 13
suggesting independence from RNR regulation. Chk1 is a DDR protein kinase acting downstream of Tel1. 14
chk1Δ mutants did not exhibit sensitivity to low glucose (Figure 1A). 15
Rad53 promotes the degradation of excess histones, and loss of this regulation inhibits the proliferation 16
of sml1Δrad53Δ mutants 1,2. We asked if aberrant histone regulation also caused glucose dependence. 17
Indeed, lowering histone H3 and H4 levels by disrupting the major H3/H4 locus, HHT2-HHF2 (hht2Δ), 18
increased the fitness of sml1Δrad53Δ, under glucose restriction and ameliorated the near-lethal 19
phenotype of mec1Δtel1Δ double mutants (Figure 1B). We asked if lack of Rad53 activity caused histone 20
accumulation under glucose restriction, and monitored histone levels after acute Rad53 depletion with 21
the Auxin-inducible degron system (sml1Δ tet-Rad53-Myc-AID). Core histones H3 and H4 accumulated 22
rapidly after Rad53 depletion (2h) (Figure 1C). We observed less histone accumulation in high glucose 23
conditions. 24
We performed a quantitative phosphoproteomic screen for Rad53 targets controlling histone levels under 25
glucose restriction. Since the function of Rad53 in tolerating glucose restriction was likely independent of 26
Dun1 signaling (Figure 1A) and upstream of histone proteins, we used sml1Δrad53Δhht2Δ and 27
sml1Δdun1Δhht2Δ as experimental and control strains, respectively (Figures 1D and S1B). Direct 28
comparison of phospho-peptides from both strains allowed the specific identification of Spt21-S276 as 29
Rad53-dependent, Dun1-independent event (sml1Δrad53Δhht2Δ < sml1Δdun1Δhht2Δ) (Figures 1D, S1C 30
and S1D; Table S1). Spt21 is the yeast homolog of human NPAT, and both act as major inducers of histone 31
expression during S phase 30-32. Spt21-S276 corresponds to NPAT-S981 and is located within a strong 32
consensus motif for Rad53 phosphorylation (S/T-Ψ) 33 (Figure 1D). We hypothesized that Rad53 inhibits 33
Spt21 to control histone gene expression. Indeed, deletion of SPT21 completely rescued the accumulation 34
of histone mRNA and proteins after acute Rad53 depletion (Figures 1E, 1F, and S1E). Similarly, deletion of 35
its transcriptional activator partner, Spt10, prevented histone accumulation (Figure S1F). Consistent with 36
the S phase specific expression of Spt21, G1 arrest also prevented histone accumulation (Figure S1G). 37
Importantly, deletion of SPT21 also rescued the slow growth and glucose dependence of sml1Δrad53Δ 38
mutants (Figure 1G). 39
Spt21-S276 is not phosphorylated in the absence of Rad53. To mimic the constitutive un-phosphorylated 40
state, we constructed the spt21S276A mutation in the endogenous SPT21 locus. spt21S276A was sufficient to 41
cause slow growth, glucose-dependence and histone accumulation (Figures 1H and 1I). Deletion of RAD53 42
did not further reduce growth, and deletion of HHT2 fully rescued growth and glucose dependence of 43
sml1Δrad53Δspt21S276A mutants (Figure 1H), supporting a linear pathway of histone regulation by Rad53 44
and Spt21. In summary, we suggest that inhibition of Spt21 by basal Rad53 activity controls histone levels 45
during an unperturbed S phase, and thereby mediates resistance to glucose restriction. 46
Excess histones disrupt adaptation to glucose restriction by subtelomere hyper-silencing
1
We next asked how excess histones in Rad53-Spt21 axis mutants imposed glucose dependence. Glucose 2
restriction de-represses starvation response genes that facilitate stress resistance and metabolic 3
adaptation. We hypothesized that excess histones may interfere with this program. To measure the 4
transcriptional response to glucose depletion, we profiled the transcriptomes of sml1Δ, sml1Δrad53Δ and 5
sml1Δrad53Δhht2Δ cells after an acute switch (1h) or adaptation (20h) to a non-glycolytic carbon source 6
(ethanol), which relieves glucose repression similar to glucose withdrawal (Figure 2A; Table S2). We 7
categorized switch-inducible genes as either transient (induced exclusively at 1h) or adaptive (induced at 8
20h) (Figure 2A). We then compared the expression levels of transient and fast adaptive switch-inducible 9
genes (Table S2) in sml1Δrad53Δ and sml1Δ cells at 1h after the switch and found that RAD53 deletion did 10
not affect their mean expression (Figure 2B). Similarly, RAD53 deletion had no effect in the average 11
expression level of adaptively induced genes at 20h after the switch (Figure 2B), suggesting that the global 12
acute and adaptive transcriptional response to carbon source switch does not require Rad53. In agreement 13
with previous findings 19, we observed that a subset of switch-inducible genes was significantly clustered 14
in subtelomeric regions (Figure 2C). Many of these genes remained de-repressed after long-term ethanol 15
adaptation in sml1Δ cells, suggesting a role of their gene products in promoting a rapid metabolic 16
adaptation (Figures 2C, and S2A). We therefore asked if, in sml1Δrad53Δ cells, excess histones affected 17
the expression of subtelomeric switch-inducible genes by altering the subtelomeric chromatin context. We 18
found that sml1Δrad53Δ cells exhibited aberrant subtelomeric repression of a fraction of switch-inducible 19
genes across several chromosomes (Figures 2C, S2A, and S2B). The repressed genes included regulators of 20
transporter trafficking (12), metabolic enzymes and regulators (15, including both hexokinase genes), and 21
stress resistance factors (5), most of which were ethanol-inducible (Figure S2A). We next asked if Rad53 22
affected the expression of subtelomeric switch response genes in general, or specifically their induction in 23
response to glucose starvation. We found that subtelomeric genes were also preferentially repressed in 24
sml1Δrad53Δ cells culture in glucose, suggesting that a repressive context was already established before 25
the carbon source switch. Importantly, deletion of HHT2 relieved the repression of many subtelomeric 26
genes, both in glucose and after an acute switch to ethanol (Figure 2D). Our data therefore suggest that 27
excess histones in sml1Δrad53Δ cells dampen the ethanol switch response by inhibiting the general 28
expression of subtelomeric genes, and thereby their full inducibility. 29
The SIR2/3/4 complex contributes to establish subtelomeric heterochromatin. Deletion of SIR2SIRT1 rescued 30
the repression of subtelomeric (COS1, COS8) genes in sml1Δrad53Δ mutants, both in glucose and after an 31
acute switch to ethanol (Figure 2E), supporting the idea that the SIR complex established repressive 32
chromatin in sml1Δrad53Δ mutants, which reduced the full inducibility of switch response genes. Deletion 33
of SIR2, SIR3 and SIR4 or inhibition of Sir2 with nicotinamide partially rescued the hypersensitivity of 34
sml1Δrad53Δ cells to glucose restriction (Figures 2F, S2C, and S2D). In contrast, deletion of SIR1, which 35
does not participate in subtelomeric silencing, did not affect glucose dependence (Figure S2E). 36
Rpd3HDAC1/2/3/8, the catalytic subunit of Rpd3S and Rpd3L HDAC complexes, prevents subtelomeric hyper-37
silencing in wt cells 20. We found that rpd3Δ mutants with pronounced propagation of subtelomeric 38
silencing showed Sir2-dependent sensitivity to glucose restriction, similar to sml1Δrad53Δ mutants (Figure 39
S2F). Thus, our data suggest that DDR- and sirtuin-mediated chromatin regulation defines subtelomeric 40
heterochromatin propagation and thereby facilitate adaptation to glucose restriction. 41
Since subtelomere silencing is coupled with nuclear envelope interaction 34 and rad53 mutants accumulate 42
perinuclear chromatin 35, we analyzed the nuclear distribution of silenced subtelomeric regions on the 43
right arms of chromosomes 5 and 14 in one sml1Δ and two sml1Δrad53Δ clones (Figure 2G). We found 44
that both regions were closer to the nuclear periphery in sml1Δrad53Δ mutants (5R: significance for 2 45
clones, 14R: significance for 1 clone) (Figure 2G). However, carbon source switch did not release 46
subtelomeres from the nuclear envelope in sml1Δ cells (Figure 2H). Hence, repression and peripheral 47
localization of subtelomeres correlate in sml1Δrad53Δ mutants, but release of subtelomeres from the 1
nuclear periphery does not seem to be part of the carbon source switch response. 2
We next asked how subtelomeric expression could protect from glucose restriction and characterized 3
processes activated under glucose restriction in sml1Δ and sml1Δrad53Δ cells. sml1Δrad53Δ cells did not 4
show abnormal autophagy, mitochondrial protein expression, reduced energy charge, oxygen 5
consumption or protein synthesis rate (Figures S3A-D, data not shown). Since the respiratory metabolism 6
operated under glucose restriction increases oxidative stress, DDR mutants are sensitive to endogenous 7
oxidative stress 36 and subtelomere harbor genes involved in redox metabolism (Figure S2A), we measured 8
redox-sensitive metabolites by mass spectrometry. We found that sml1Δrad53Δ cells had a lower 9
NADH/NAD+ ratio than sml1Δ cells (Figure 2I), indicative of a more oxidative environment. This was 10
associated with lower levels of the endogenous anti-oxidant N-acetylcysteine (NAC) and oxidized 11
glutathione (Figure 2I), implying less endogenous anti-oxidant potential. Importantly, SIR2 deletion 12
partially reverted these metabolite alterations (Figure 2I). Exogenously applied NAC alleviated the slow 13
growth of sml1Δrad53Δ cells under glucose restriction (Figure 2J), suggesting that reduced anti-oxidant 14
potential in sml1Δrad53Δ cells contributed to glucose dependence. The growth benefit by NAC was larger 15
in sml1Δrad53Δ than in sml1Δsir2Δrad53Δ cells (Figure 2J), supporting the idea that subtelomere 16
expression provided tolerance to glucose restriction at least in part through enhancing anti-oxidant 17
potential. 18
To identify the subtelomeric genetic mediators of glucose dependence, we screened all subtelomeric gene 19
deletion mutants contained in the viable haploid synthetic genetic array screening library (Figures S4A and 20
S4B). This analysis identified two glucose-dependent mutants (ymr315wΔ, yol162wΔ). However, both 21
genes were not strongly ethanol-inducible, not repressed in sml1Δrad53Δ cells, and their expression was 22
not increased by SIR2 deletion (Figure S4C). We then deleted 12 large subtelomeric regions enriched in 23
repressed genes (see Figure S2A), but none of the deletions resulted in glucose dependence (Figure S4D). 24
Since most subtelomeric genes appear in multiple copies distributed over several different subtelomeres 25
(PAU family, COS family, telomeric repeat helicases, alcohol dehydrogenases, and others), it is likely that 26
inactivation of a single gene can be compensated for. We therefore tested if over-expression of 27
subtelomeric genes could rescue the glucose dependence of sml1Δrad53Δ cells and screened all 28
subtelomeric genes from the genome-wide GST fusion library 37. However, none of the single over-29
expressed genes alleviated the glucose dependence of sml1Δrad53Δ cells (data not shown). We 30
hypothesize that the coordinate expression of multiple subtelomeric genes confers glucose starvation 31
resistance (see Figure S2A), but the individual functional contributions remain to be identified. 32
Excess histones cause general subtelomeric repression independent from the Mpk1-Sir3
33
pathway
34
Our data suggest that excess histones cause a general subtelomere repression. Such repression should 35
also blunt other subtelomere-inducing stress responses. We therefore tested the sensitivity of 36
sml1Δrad53Δ mutants to rapamycin and chlorpromazine, which both trigger subtelomeric stress 37
responses 19. We found that sml1Δrad53Δ mutants were sensitive to both drugs (Figure S2G). The 38
sensitivity to rapamycin but not chlorpromazine was SIR-dependent (Figure S2G). Rapamycin mediates 39
subtelomere de-repression by activating the kinase Mpk1ERK5, which phosphorylates and inactivates Sir3 40
(Figure 2K). We asked if glucose starvation acted through the same mechanism, and analyzed Sir3 41
phosphorylation, which can be visualized as mobility shift in a Western blot analysis. In contrast to 42
rapamycin, switching cells from glucose to ethanol did not alter Sir3 mobility (Figure 2K). Hence, the Mpk1-43
Sir3 pathway is specific to rapamycin and not carbon source switch. We next tested if Rad53 was required 44
for the Mpk1-Sir3 pathway. Sir3 phosphorylation after rapamycin was equally efficient in sml1Δ and 45
sml1Δrad53Δ cells whereas it was completely blocked in sml1Δmpk1Δ controls (Figure S2H), suggesting 46
that Mpk1-Sir3 activity was not affected by Rad53. Notably, we observed that Sir3 mRNA and protein levels 47
were consistently elevated in sml1Δrad53Δ cells (Table S2, Figure 2L). Elevated Sir3 levels were reverted 1
by deletion of HHT2 (Table S2, Figure 2L). Thus, while our data suggest no signaling crosstalk between 2
Rad53-Spt21 and Mpk1, both axes may independently affect Sir3 level and phosphorylation, respectively, 3
to regulate subtelomeric expression. Together, this suggests that a general, SIR complex-mediated 4
subtelomere repression by excess histones blunts subtelomeric stress responses, including the response 5
to glucose starvation, resulting in a glucose dependence phenotype. 6
Acetylation turnover contributes to glucose dependence independently from subtelomere
7
silencing
8
While subtelomeric repression accounts in part for histone-mediated glucose dependence, we observed 9
that sml1Δrad53Δsir2Δ mutants are not as resistant to glucose restriction as sml1Δrad53Δhht2Δ (see 10
Figures 1B and 2F). Hence, we hypothesized that an additional, potentially Sir-independent mechanism 11
links excess histones to glucose dependence. To identify this mechanism, we screened a yeast H3/H4 12
histone point mutant library 38 with a sml1Δrad53Δ query strain for functional histone sites involved in 13
glucose restriction tolerance (Figure S5A, left panel). We identified 14 suppressors (Figure S5A, right 14
panel), of which one affects SIR3 binding (H4-T80A) 39 and another likely affects H3 levels through 15
degradation (H3-Y99A) 2. Interestingly, the substitution of the N-terminal lysine residues 4, 9, 14 and 18 in 16
histone H3 with either glutamine or arginine reduced glucose dependence (Figure S5A, right panel). Since 17
glutamine and arginine structurally mimic opposite states of lysine acetylation (acetylated, un-acetylated), 18
this observation suggests that the suppression mechanism is not mediated by the H3 acetylation state per 19
se. Rather, one possibility is that the suppression arises from the inability of histone acetyltransferases 20
(HATs) to acetylate these residues, resulting in an overall decrease of H3 acetylation rate. Consistently, the 21
H3 acetylation turnover is short (10 min), suggesting that excess H3 would rapidly increase acetylation 22
turnover 40. We validated the rescue of glucose dependence by substituting the lysine residues 4, 9, 14, 18 23
and 27 of the endogenous HHT2 locus in the W303 background 41 with glutamine (hht25KQ) or arginine 24
(hht25KR) (Figures 3A and S5B). Deletion of SIR2 further alleviated glucose dependence (Figures 3A and S5B) 25
of the histone acetylation site mutants introduced in the rad53Δ background; this suggests that the 26
glucose dependence of rad53Δ mutants is influenced by the subtelomeric chromatin state and by the 27
overall rate of histone acetylation. 28
Although the contributions of SIR2 and H3 acetylation sites to glucose dependence are genetically 29
separable, it is possible that mutating H3 acetylation sites affects SIR-mediated silencing. We therefore 30
analyzed the effect of H3 acetylation site mutations on the expression of the SIR-repressed COS1 and COS8 31
genes. The hht25KQ and hht25KR mutants did not alter the expression of either SIR-repressed gene in 32
sml1Δrad53Δ cells, and only hht25KR but not hht25KQ enhanced the de-repression of both genes in 33
sml1Δsir2Δrad53Δ cells (Figure 3B). Hence, we do not observe a consistent effect of the hht25KQ and hht25KR 34
mutations on SIR-mediated gene repression. 35
Inhibition of histone deacetylases (HDACs) increases global histone acetylation and consequently reduces 36
the de novo acetylation rate, similar to acetylation-mimicking mutations. We therefore tested whether 37
HDAC deletions alleviated the glucose dependence of sml1Δrad53Δsir2Δ cells. Deletion of the catalytic 38
HDAC subunit RPD3 further rescued glucose dependence, and sml1Δrad53Δsir2Δrpd3Δ cells were nearly 39
as resistant to glucose restriction as sml1Δ control cells (Figure 3C). Thus, subtelomere silencing and 40
increased acetylation turnover are two separable mechanisms by which excess histones impose glucose 41
dependence. 42
A hyperactive TEL1 allele induces glucose dependence through subtelomere silencing but
43
not histone dosage
44
In principle, it should be possible to genetically uncouple the telomere effect from the overall acetylation 45
rate in promoting glucose dependence. To this purpose, we investigated an allele specific mutation in TEL1 46
(TEL1-hy909), which causes constitutive Rad53 activation and telomere over-elongation 42 that could 1
enhance subtelomeric silencing 21. TEL1-hy909 mutants exhibited subtelomeric silencing of the SIR-2
repressed switch response genes (Figure 3D). Consistent with Rad53 hyper-activation 42, histone levels 3
were low in TEL1-hy909 mutants (Figure 3E). TEL1-hy909 cells were also sensitive to glucose restriction 4
(Figure 3F). We then addressed whether in TEL1-hy909 mutants the expression of the subtelomeric switch 5
response genes was limiting, by deleting SIR2. We found that sir2Δ rescued the TEL1-hy909 sensitivity to 6
glucose restriction (Figure 3F). However, ablation of HHT2 or RPD3 did not rescue the glucose dependence 7
of TEL1-hy909 mutants (Figure 3F). We asked if the subtelomeric repression in TEL1-hy909 mutants 8
sensitized to subtelomere-inducing stressors in general. Indeed, TEL1-hy909 mutants were sensitive to 9
rapamycin in a SIR2-dependent manner (Figure S5C), suggesting a general role in subtelomeric gene 10
expression. We conclude that, even with a functional Rad53-Spt21-Histone axis, the subtelomeric silencing 11
of switch response genes can contribute to glucose dependence. Moreover, our observations implicate 12
the Tel1 kinase in modulating glucose dependency through the control of subtelomeric chromatin. 13
Hyper-acetylation of excess histones affects central carbon metabolism
14
We next asked how excess histones could affect glucose dependence through acetylation turnover. 15
Acetylation requires Ac-CoA as acetyl donor, and the level of Ac-CoA depends on glucose availability 14. 16
Therefore, we decided to investigate the acetylation state of excess histones. Using an anti-acetyl lysine 17
antibody (T52), we found that global acetylation of H3 and H4 strongly increased within 2h after Rad53 18
depletion, in spite of glucose restriction (Figure 4A). Acetylation increased several-fold more than histone 19
levels, implying that the excess histones were preferentially acetylated. Consistently, preventing histone 20
over-production by deletion of SPT21 completely abolished the hyper-acetylation (Figure 4B), and 21
Spt21S276A-driven histone over-production under glucose restriction was sufficient to induce high 22
acetylation (Figure 4C). These findings suggest that hyper-acetylation can be a direct consequence of 23
excess histones. We therefore hypothesized that, in rad53 mutants experiencing glucose restriction, the 24
increased H3/H4 levels, accompanied by their massive acetylation, could further affect the already limiting 25
pool of Ac-CoA and, consequently, the Ac-CoA-dependent anabolic metabolism. 26
We analyzed the metabolic consequences owing to Rad53 defects. Consistent with carbon metabolite 27
limitation, sml1Δrad53Δ cells spontaneously de-repressed glucose starvation genes (Figures S6A and S6B), 28
showed histone-dependent induction of targets of metabolic (Mig1, Nrg1) and stress response (Msn2/4) 29
transcription factors (Figure S6C). and shared transcriptome signature similarity with mutants of the 30
glucose-activated Ras signaling pathway (srv2Δ, ram1Δ) 43 (Figure S6D). 31
We analyzed the metabolome of sml1Δ, sml1Δrad53Δ, sml1Δhht2Δ and sml1Δrad53Δhht2Δ cells cultured 32
in a synthetic medium with glucose as sole carbon source. We found that sml1Δrad53Δ cells showed global 33
metabolite alterations which were rescued in sml1Δrad53Δhht2Δ cells and therefore dependent on excess 34
histones (Figures 4D and 4E). Specifically, sml1Δrad53Δ cells showed histone-dependent reduction of 35
central carbon metabolites, including Ac-CoA, glycolysis intermediates and Ac-CoA-derived fatty acids 36
(Figures 4E-4G), and an accumulation of the storage carbohydrate trehalose (Figure S4E). To test if excess 37
histones were sufficient to induce the observed alterations, we acquired the metabolic profile of 38
sml1Δspt21S276A cells. Indeed, the metabolite alterations in sml1Δspt21S276A and sml1Δrad53Δ cells were 39
overall similar (Figure S6F). In particular, we observed reduced downstream glycolysis intermediates, Ac-40
CoA and Ac-CoA-derived fatty acids in sml1Δspt21S276A mutants (Figures 4F, 4G, and S6G). 41
Since central carbon metabolites are derived from glucose through glycolysis, we asked if a reduction of 42
glycolysis rate contributed to the low levels of central carbon metabolites. We performed 13C-glucose flux 43
analysis of sml1Δ, sml1Δrad53Δ and sml1Δrad53Δhht2Δ cells, cultured in synthetic medium. While the 44
label incorporation into pyruvate, the end product of glycolysis, was mildly reduced in sml1Δrad53Δ 45
mutants compared to the sml1Δ control, the labeling was not restored in sml1Δrad53Δhht2Δ cells (Figure 46
S6H). Hence, although Rad53 may influence glycolysis, this effect was independent from histone levels. In 1
yeast, pyruvate is directly decarboxylated in the cytoplasm to yield acetate for Ac-CoA synthesis, and 2
increased cytoplasmic Ac-CoA consumption may reduce its flux into the TCA cycle. We therefore measured 3
the carbon label incorporation into TCA intermediates and found a mild reduction in the labeling efficiency 4
of Citrate and α-Ketoglutarate, which was restored by HHT2 deletion (Figure S6H). These data show that 5
excess acetylated histones in sml1Δrad53Δ cells correlate with reduced glucose flux into the TCA cycle. 6
We next tested the combined effect of glucose restriction (ethanol, low glucose) and RAD53 deletion 7
(sml1Δrad53Δ vs. sml1Δ). As expected, glucose restriction in sml1Δ cells reduced glycolysis intermediates 8
and fatty acids, and caused an accumulation of TCA intermediates for mitochondrial respiration (Figures 9
4H, S7A, and S7B), and Ac-CoA levels were below the detection limit. Deletion of RAD53 further enhanced 10
the depletion of Ac-CoA-derived fatty acids, reduced the level Ac-CoA-derived sterol precursors, and 11
reduced the accumulation of a subset of TCA metabolites (Figure 4H). 12
Ac-CoA for acetylation and anabolic reactions can be directly and rapidly derived from imported acetate 13
14. Hence, we hypothesized that providing acetate as an Ac-CoA source to sml1Δrad53Δ cells might 14
alleviate their glucose dependence. Indeed, acetate supply increased the level of Ac-CoA-derived fatty 15
acids and sterol precursors and ameliorated the sensitivity of sml1Δrad53Δ cells to glucose restriction 16
(Figures 4H and 4I). This rescue did not correlate with a restoration of the affected TCA cycle intermediates 17
(Figure 4H), suggesting that replenishment of TCA cycle intermediates was not the cause of enhanced 18
proliferation. Moreover, it further improved the growth of sml1Δrad53Δsir2Δ mutants under glucose 19
restriction (Figure 4I). Hence, our data suggest that limitation of Ac-CoA and some of its derived 20
metabolites contributed to the glucose dependence of rad53 mutants. In summary, these findings imply 21
that in sml1Δrad53Δ cells, excess histones impose glucose dependence by limiting Ac-CoA and Ac-CoA-22
derived central carbon metabolites. 23
Discussion
1
We show that the DDR kinase Rad53 acts on the conserved histone regulator Spt21NPAT to limit histone 2
production. Loss of this regulation results in histone accumulation and acetylation, and accounts for the 3
specific glucose dependence of rad53 mutants. We further show that excess histones interfere with the 4
tolerance to glucose restriction by two separable mechanisms, the SIR-dependent silencing of starvation-5
induced subtelomeric domains, and the depletion of central carbon metabolites (Figure 5). 6
Previous studies suggested that direct binding of excess histones to Rad53 initiates their degradation 2 and 7
that, following DNA breaks, DDR signaling suppresses histone accumulation 3. Here we provide evidence 8
of a non-canonical function of the Rad53 kinase in limiting histone levels in the absence of DNA damage 9
insults, and of a baseline activity of the Rad53-Spt21 axis in limiting histone expression during an 10
unperturbed S phase. The model is consistent with studies describing that unperturbed DNA replication is 11
sufficient for basal DDR activation 22,33,44. This Rad53-mediated regulatory loop is likely integrated in the 12
signal transduction cascade involving the two upstream DDR kinases, Mec1 and Tel1, although further 13
work will be needed to address their specific roles in controlling glucose tolerance. While we consistently 14
observe stronger protein level imbalances of histone H4 than H3, deletion of the HHT2 open reading frame 15
(encoding H3) more efficiently suppresses glucose dependence than deletion of the HHF2 open reading 16
frame (encoding H4) (data not shown). This suggests that H3 is the major histone mediator of glucose 17
dependence. Notably, we observed that sml1Δspt21S276A cells are sensitive to the replication stress inducer 18
hydroxyurea, and deletion of SPT21 partially suppresses hydroxyurea sensitivity of sml1Δrad53Δ cells (data 19
not shown). However, deletion of HHT2 alone confers nearly no hydroxyurea resistance (data not shown). 20
It is therefore possible that the Rad53-Spt21 axis may also play a role under conditions of replication stress 21
but facilitate a more complex balance of histone regulation than during glucose restriction. 22
The activities of Spt21 and its human homolog, NPAT, oscillate and peak in S phase when the need for 23
histone synthesis is high 30,45. Intriguingly, the Rad53 target site on Spt21 (S276) is conserved in NPAT 24
(S981). Although the Rad53 consensus motif changed during evolution, NPAT is regulated by S phase CDK 25
activity 32, which is one of the most important DDR targets. During evolution, NPAT regulation may 26
therefore have shifted from direct to indirect regulation, and complemented with additional regulation 27
layers such as mRNA stability 46. 28
In budding yeast, subtelomeres constitute the largest known regions in which nuclear envelope 29
attachment is coupled to a constitutive silent chromatin state by the SIR complex 34. This silent chromatin 30
harbors stress response genes that become active during carbon source limitation 19. We show that histone 31
control by the Rad53 kinase counteracts SIR-dependent gene silencing to support the response to 32
metabolic stress. Since Sir3 levels determine subtelomeric silencing 47, and Sir3 expression is elevated in 33
sml1rad53 cells in an HHT2-dependent manner, excess histones may mediate subtelomeric silencing in 34
part by modulating Sir3 expression. By using the specific TEL1-hy909 allele that maintains Rad53 active 35
and histone levels limiting, but causes aberrant sub-telomere silencing, we have uncoupled DDR-mediated 36
subtelomeric repression from DDR-dependent histone control. The mechanism by which Rad53 and Tel1 37
influence subtelomere silencing seems therefore different: while in rad53 mutants the muffling of 38
subtelomeric switch response genes is caused by exceeding histones, subtelomeric silencing in TEL1-hy909 39
mutants likely results from telomere length expansion 42. 40
The nuclear envelope is a hub for silenced subtelomeric chromatin 48 and our observations imply that 41
chromatin attachment to the nuclear periphery may influence tolerance to glucose starvation. 42
Accordingly, glucose dependence of both rad53and TEL1-hy909 mutants is alleviated by ablating the SIR 43
complex, which is a mediator of chromatin silencing and attachment. These data point out a potential 44
physiological relevance of the nuclear envelope-chromatin association in influencing glucose tolerance. 45
Moreover, in light of recent observations implicating the DDR in controlling chromatin-nuclear envelope 46
attachment, altogether our findings pinpoint a key role for the nuclear envelope in influencing not only 1
replication stress 35 and mechanotransduction 49, but also cell metabolism. 2
The scenario emerging from our observations underlines the existence of an integrated network mediated 3
by different DDR kinases that controls histone levels and subtelomeric silencing and couples the epigenetic 4
state of the cell with metabolic changes. In normal cells, subtelomeres may thus “sense” histones as 5
readout for protein synthesis capacity, which is directly influenced by glucose availability. Our data 6
contribute to unmask a key role for histones in modulating glucose tolerance. In mammalian neurons, 7
histone availability directly determines activity-dependent transcription, nucleosome re-depositioning, 8
synaptic connectivity and behavior 50. Thus, correct histone dosage may similarly dictate metabolic and 9
signaling responses in mammals, but the genomic response domain may depend on the cell type and 10
stimulus. 11
Cells react to the metabolic stress induced by glucose restriction by modulating glucose sensing pathways. 12
We found that genetic backgrounds mimicking different aspects of glucose restriction, such as high AMPK 13
(snf1G53R), low TOR (tor1Δ) and low RAS (ras2Δ) activity did not increase histone accumulation (data not 14
shown). 15
Our data suggest that increased Ac-CoA consumption directly contributes to metabolic imbalancements 16
in rad53 mutants. Glucose-derived Ac-CoA is thought to be limiting during glucose restriction 51. Ac-CoA 17
levels rise in G1 phase until a threshold is exceeded which allows acetylation of HATs and histones at genes 18
for S phase entry 14. Surprisingly, we found that cells with low glucose supply are capable of highly 19
acetylating excess histones, resulting in total acetylation levels which even exceed those found in high 20
glucose medium. The acetylation involves various HATs (SAGA, HAT1, RTT109, NuA4) (data not shown). 21
Our observations suggest that acetylation of excess histones directly consumes Ac-CoA, limits its 22
availability for biosynthetic reactions and induces glucose dependence. In the light of a strict temporal 23
compartmentalization of metabolic cycles 52, control of histone levels may therefore prevent an 24
unscheduled starvation response and metabolic reprogramming during S phase. The replication-coupled 25
histone control thus represents a way to guarantee Ac-CoA availability for replication-associated 26
processes, which becomes essential under conditions of glucose restriction. 27
We have shown that histone hyper-acetylation and subtelomere silencing are genetically separable causes 28
of glucose dependence, using the combination of H3 acetylation mutants and SIR2 deletion. However, 29
given the various regulatory roles of H3 and H4 acetylation on subtelomere expression, we assume that 30
histone hyper-acetylation likely influences subtelomere expression in some loci and thus have an 31
additional indirect impact on glucose dependence. 32
Cancers have an elevated glucose uptake and requirement in comparison with normal tissues, to fuel the 33
biosynthetic pathways driving rapid proliferation 4. Targeting of glucose metabolism 5 and nutrient 34
restriction 6 may complement classical cancer treatments in the future. In several types of cancer, histone 35
genes are amplified as a consequence of copy number increases of the HIST1 and HIST2 loci 53,54. Moreover, 36
various cancers exhibit up-regulation of specific histone genes 55,56. Notably, NPAT has an important role 37
in driving replication-dependent histone expression in breast cancers with Cyclin E2 overexpression 57, and 38
germline NPAT mutations are a candidate risk factor for Hodgkin lymphoma, highlighting a role for 39
excessive histone expression in tumorigenesis 58. Based on our findings, we suggest that high histone levels 40
in cancers may sensitize to the targeting of glucose metabolism or nutrient restriction, and may serve as 41
biomarker for the success of interventions targeting glucose metabolism. 42
Acknowledgments
43
We thank Adhil Mohammed, Michele Giannattasio, Gururaj Rao Kidiyoor, Giulia Bastianello, Silvia Biagini, 44
Ortensia Franzini, Giuseppe Martano and Angela Bachi for experimental support, helpful discussions and 45
help with data interpretation. We thank Barnabas Szakal for providing the tet-Rad53-Myc-AID strain. C.B. 1
was supported by a fellowship by Associazione Italiana per la Ricerca sul Cancro (AIRC) Fellowship i-Care 2
(Marie Curie co-funded by the European Union)—16173. E. Fabre acknowledges Labex “Who am I?” (ANR-3
11-LABX-0071, Idex ANR-11-IDEX-0005-02) and Cancéropôle Ile de France (ORFOCRISE PME-2015). This 4
work was supported by grants from Fondazione AIRC under IG 2017 – ID. 19783 (M.P.L.); Progetti di Ricerca 5
di Interesse Nazionale (PRIN) 2015 (M.P.L.). 6
Author Contributions
7
Conceptualization, C.B., and M.F.; Software, C.B.; Formal Analysis, C.B., M.C.L., R.B., and A.W.; 8
Investigation, C.B., A.A., E.Ferrari., M.C.L. R.B., R.C., M.G., and A.W.; Data Curation, C.B.; Writing – Original 9
Draft, C.B., E.Ferrari., and M.F.; Writing – Review & Editing, C.B., A.A., E.Ferrari., M.C.L., S.L., M.P.L., 10
E.Fabre, M.B.S., M.F.; Visualization, C.B., M.C.L.; Supervision, C.B., S.L., E.Fabre., M.B.S., and M.F.; Project 11
Administration, C.B., and M.F.; Funding Acquisition, C.B., and M.F. 12
Declaration of Interest
13
The authors declare no competing interests. 14
Figures
Figure 1. Rad53 mediates tolerance to glucose restriction by regulating the Spt21-histone axis
(A and B) 107 cells / mL were serially diluted (1:6), spotted on YP plates with the indicated carbon sources and grown for 2d.
(C) Rad53-AID cells were adapted to normal or low (DR) glucose, Rad53 depletion was induced by addition of Auxin and tetracycline, and samples were collected at the indicated times to detect Rad53 and histones by Western blot analysis (N = 3 replicates). The bar chart (right panel) provides a quantification of histone levels normalized by loading control Pgk1. Significances were calculated with 1-way ANOVA with post hoc Tukey HSD test.
(D) Quantitative MAss spectrometry analysis of PhosphoSubstrates (QMAPS) of Rad53-dependent phosphorylation events. Top: SILAC quantification was used to identify Dun1-dependent (rad53Δ; Heavy condition) and Rad53-dependent, Dun1-independent (dun1Δ; Light condition) phosphorylation events in low glucose. Each dot in the plot corresponds to a Rad53-dependent phosphorylation event. The horizontal position represents the relative fold abundance change. The Y-axis is arbitrary. The results are representative of two replicate experiments where the light and heavy conditions where swapped. Only
phosphopetides identified in both experiments were included. Bottom: Alignment of budding yeast Spt21 and human homolog NPAT around Spt21-S276.
(E and F) Rad53-AID cells with the indicated SPT21 genotype were adapted to low glucose and treated with Auxin and tetracycline for 2h (E) or 4h (F) to deplete Rad53. Samples were collected to quantify histone mRNAs by RT-qPCR (E) or proteins by Western blot analysis (F) (N = 3 replicates). Significance was calculated by Student’s t-test (two-sided, unpaired).
(G and H) 107 cells / mL were serially diluted (1:6), spotted on YP plates with the indicated carbon sources and grown for 2d.
(I) Spt21-AID and Spt21S276A-AID cells were adapted to low glucose and Auxin for 16h. Auxin was washed away to stabilize Spt21 and samples were collected after 6h to quantify proteins by Western blot analysis. Error bars indicate the standard deviation, D = glucose, DR = glucose restriction (0.01% in solid media in A, B and G, 0.04% in solid media in H, 0.02% in liquid media), Aux = Auxin, tc = tetracycline. See also Figure S1.
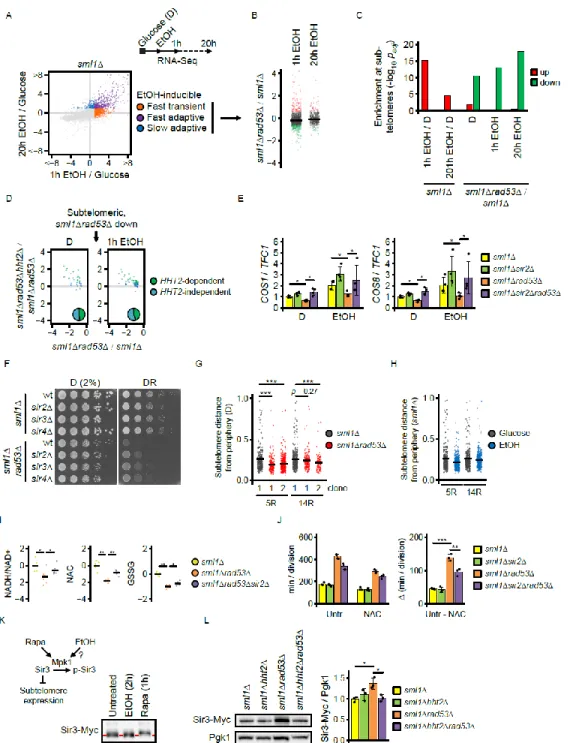
Figure 2. Excess histones disrupt adaptation to glucose restriction by subtelomere hyper-silencing
(A) Experimental strategy to analyze carbon source switch response by RNA-Seq analysis in synthetic complete medium. EtOH-inducible genes were categorized as transient or fast/slow adaptive or based on their increased expression at 1h or 20h after switching sml1Δ cells from glucose to ethanol.
(B) Expression of switch-induced genes in sml1Δrad53Δ vs. sml1Δ cells at 1h or 20h after carbon source switch. Each dot represents one gene. The values are the log2-transformed expression fold-changes between strains of the indicated genotypes.
(C) Enrichment analysis by hypergeometric test of genes in telomere proximity that are up- or down-regulated by carbon source switch (EtOH/D) in sml1Δ cells, or by deletion of RAD53 (sml1Δrad53Δ/sml1Δ).
(D) Classification of genes located within 40 kb from telomeres and repressed in sml1Δrad53Δ cells by HHT2 dependence. Each dot represents one gene. The values are the log2-transformed expression fold-changes between strains of the indicated genotypes.
(E) RT-qPCR quantification of the expression of the subtelomeric COS1 and COS8 genes in the indicated genotypes in glucose and 90 min after the switch to ethanol. TFC1 was used as normalization control. (N = 4 replicates). Significances were calculated by Kruskal-Wallis rank sum test, followed by Mann-Whitney test with Benjamini-Hochberg correction.
(F) 107 cells / mL were serially diluted (1:6), spotted on YP plates with the indicated carbon sources and grown for 2d.
(G-H) Jitter plots representing the distance of labeled subtelomeres 5R and 14R from the nuclear periphery. (G) Cells were cultured in normal glucose. Data from one parental sml1Δ control and two independent sml1Δrad53Δ clones are shown. (H) sml1Δ control were cultured in the indicated carbon sources. Significances were calculated by Kruskal-Wallis rank sum test, followed by Mann-Whitney test with Benjamini-Hochberg correction.
(I) Mass spectrometry analysis of redox metabolites in cells of the indicated genotypes cultured in low glucose. Metabolite levels were normalized by the median of all detected metabolites. Significances were calculated by Kruskal-Wallis rank sum test, followed by Mann-Whitney test with Benjamini-Hochberg correction.
(J) Cells were inoculated in YP + low glucose with or without supply of 1 mM N-acetylcysteine, and division speed was determined by cell counting over 2 days. The right panel indicates the reduction of division time by N-acetylcysteine. Significances were calculated with 1-way ANOVA with post hoc Tukey HSD test. (K) sml1Δ cells expressing endogenous 13xMyc-tagged Sir3 were cultured in normal glucose and subjected to either 2h glucose-to-ethanol switch or 1h rapamycin treatment. Protein extracts were prepared and Sir3 bandshift indicative of phosphorylation was analyzed by Western blot analysis. The red dashed line indicates the position of the high mobility band corresponding to un-phosphorylated Sir3. The scheme summarizes the regulation of subtelomere expression by Mpk1 through Sir3 phosphorylation.
(L) Cells of the indicated genotypes expressing endogenous 13xMyc-tagged Sir3 were culture in YPD, protein extracts were prepared, and the level of Sir3 protein was analyzed by Western blotting. The bar chart (right panel) provides a quantification of Sir3-Myc levels normalized by loading control Pgk1. Significances were calculated with 1-way ANOVA with post hoc Tukey HSD test.
D = glucose, DR = glucose restriction (0.01% in solid media, 0.04% in liquid media), EtOH = ethanol. * p < 0.05, ** p < 0.01, *** p < 0.001, See also Figures S2, S3 and S4.
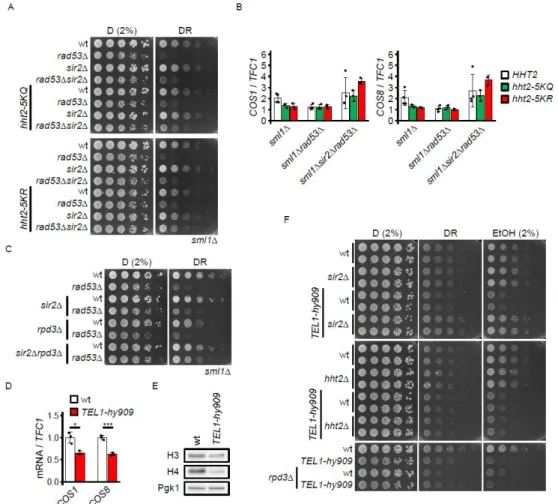
Figure 3. Separable influence of histone acetylation turnover and subtelomere silencing on glucose requirement
(A) 107 cells / mL were serially diluted (1:6), spotted on YP plates with the indicated carbon sources and grown for 2d.
(B) RT-qPCR quantification of the expression of the subtelomeric COS1 and COS8 genes in the indicated genotypes 90 min after the switch from glucose to ethanol. Expression levels were normalized to TFC1. (C) 107 cells / mL were serially diluted (1:6), spotted on YP plates with the indicated carbon sources and grown for 2d.
(D) RT-qPCR quantification of the expression of subtelomeric genes in wt and TEL1-hy909 cells grown in YP + 3% ethanol. Expression levels were normalized to TFC1. Significance was calculated by Student’s t-test (two-sided, unpaired).
(E) wt and TEL1-hy909 cells were adapted to YP + 3% ethanol for 20h and samples were collected during log phase to quantify proteins by Western blot analysis.
(F) 107 cells / mL were serially diluted (1:6), spotted on YP plates with the indicated carbon sources and grown for 2d.
D = glucose, DR = glucose restriction (0.01% in solid media), EtOH = ethanol. Error bars indicate the standard deviation. See also Figure S5.
Figure 4. Hyper-acetylation of excess histones affects central carbon metabolism
(A) Rad53-AID cells were adapted to normal or low glucose, Rad53 depletion was induced by addition of Auxin and tetracycline, and samples were collected at the indicated times to detect Rad53 and modified histones by Western blot analysis (N = 3 replicates). The bar chart (right panel) provides a quantification of histone acetylation normalized by total histone levels. Significances were calculated with 1-way ANOVA with post hoc Tukey HSD test.
(B) Rad53-AID cells with the indicated SPT21 genotype were adapted to low glucose and treated as indicated with Auxin and tetracycline for 4h to deplete Rad53. Samples were collected to detect modified histones by Western blot analysis.
(C) Spt21-AID and Spt21S276A-AID cells were adapted to low glucose and Auxin for 16h. Auxin was washed away to stabilize Spt21 and samples were collected after 6h to quantify proteins by Western blot analysis. (D) Global metabolome analysis of cells of the indicated genotypes cultured in synthetic complete medium with normal glucose. Replicates were clustered by centered log2 metabolite intensities (N = 5-6 replicates). (E) Classification of altered metabolites in sml1Δrad53Δ vs. sml1Δ cells by HHT2 dependence and super-pathway. Alterations in glycolysis, TCA cycle and PPP are depicted. Significances were calculated by SAM (FDR < 0.1).
(F) Jitter plots of total Ac-CoA levels from metabolomics data. The indicated genotypes are normalized by the average of the internal sml1Δ control strain. Significances were calculated by Kruskal-Wallis rank sum test, followed by Mann-Whitney test with Benjamini-Hochberg correction.
(G) Heat map representing fatty acid alterations from metabolomics data in cells with the indicated experimental vs. control genotypes. Asterisks indicate significant alterations by SAM analysis (FDR < 0.1). (H) Heat map representing fatty acid sterol synthesis and TCA cycle intermediate alterations from metabolomics data in cells with the indicated experimental vs. control genotypes or conditions. Asterisks indicate significant alterations by SAM analysis (FDR < 0.1).
(I) 107 cells / mL were serially diluted (1:6), spotted on YP plates with 0.01% glucose, with or without acetate, and grown for 2d.
Error bars indicate the standard deviation, D = glucose, DR = glucose restriction (0.01% in solid media, 0.02% in liquid media, 0.04% in liquid media for metabolomics), EtOH = ethanol, Aux = Auxin, tc = tetracycline. See also Figures S6 and S7.
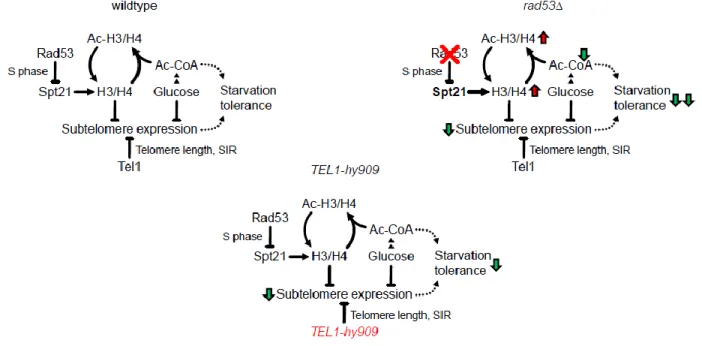
Figure 5. Model
Rad53 regulates histone expression through inhibition of Spt21NPAT by phosphorylation. Absence of this regulation causes accumulation of histones. Hyperacetylated excess histones reduce growth-limiting Ac-CoA-derived carbon metabolites. Excess histones also silence starvation-responsive subtelomeric genes. Hyper-acetylation and subtelomeric gene silencing reduce the glucose starvation tolerance of rad53 mutants. Hyperactive Tel1-hy909 increases telomere length and subtelomere silencing and thereby reduces glucose starvation tolerance in a histone-independent manner.
Supplementary Figures and Tables
Figure S1. Related to Figure 1
(A) Cells were adapted to the indicated glucose concentrations, and cultures were inoculated at low density. Cells were counted after 16 h and doubling times were calculated. N = 3 replicates of 2 independent clones.
(B) Workflow for SILAC-based quantification of Rad53-dependent phosphorylation events in glucose limiting growth conditions.
(C) SILAC quantification of the Spt21-S276 phosphopeptide. Quantification was performed using EXPRESS. Image captured from web based SORCERER viewer from Sagen.
(D) Sequest-based Peptide-Spectrum match (PSM) for the Spt21-S276 phosphopeptide. Image captured from web based SORCERER viewer from Sagen.
(E) Rad53-AID cells with the indicated SPT21 genotype were adapted to normal or low glucose and treated with Auxin and tetracycline as indicated to deplete Rad53. Samples were collected to quantify histone mRNAs by RT-qPCR. Data of Figure 1E are contained in this Figure. N = 3
(F) Rad53-AID cells with the indicated SPT10 genotype were adapted to low glucose and treated as indicated with Auxin and tetracycline for 4h to deplete Rad53. Samples were collected to detect histones by Western blot analysis. Lysate corresponding to an equal amount of cells was loaded per lane. The difference in Pgk1 levels likely represents a regulation by Spt10.
(G) Rad53-AID cells were adapted to low glucose and arrested with α factor for 1h as indicated (G1). Rad53 depletion was induced by addition of Auxin and tetracycline, in the presence of α factor where indicated (G1). Samples were collected after 2h to detect Rad53 and histones by Western blot analysis.
Error bars indicate the standard deviation, D = glucose, DR = glucose restriction (0.02% in liquid media), Aux = Auxin, tc = tetracycline
Figure S2. Related to Figure 2
(A) Depiction of subtelomeric gene expression. The rectangular boxes show the effects of carbon source switch (green lines: ethanol / glucose in sml1Δ) and RAD53 deletion (red lines: sml1Δrad53Δ/sml1Δ in
ethanol) on gene expression within 40 kb of telomeres. The boxes represent data from 1h (left) or 20h (right) carbon source switch. The chromosomes 1 to 16 are arranged along the vertical axis. For each chromosome, the black baseline represents a 0 fold-change, and the vertical position above or below the baseline represents an up- or down-regulation. Logistic transformation was applied to all fold-changes. Clusters of ethanol-inducible genes that are repressed by RAD53 deletion (beige-colored boxes) were selected manually for deletion. Bottom/right gene cluster panel: Genes significantly repressed in sml1Δrad53Δ/sml1Δ were classified by ethanol inducibility (inducible: yellow, not inducible: red), manually grouped by biological process and clustered by STRING.
(B) Cumulative sum of repressed genes in sml1Δ rad53Δ vs sml1Δ cells cultured in the indicated conditions along the first 40 kb from all telomeres in comparison with the total gene occupancy.
(C-G) 107 cells / mL were serially diluted (1:6), spotted on YP plates with the indicated carbon sources and drugs, and grown for 2d. Nicotinamide = 4 mM, Rapamycin = 1.5 ng/mL, Chlorpromazine = 10 µM
(H) Cells of the indicated genotypes expressing endogenous 13xMyc-tagged Sir3 were cultured in normal glucose and subjected to 1h treatment with 200 ng/mL rapamycin. Protein extracts were prepared and Sir3 bandshift indicative of phosphorylation was analyzed by Western blot analysis. The red dashed line indicates the position of the high mobility band corresponding to un-phosphorylated Sir3.
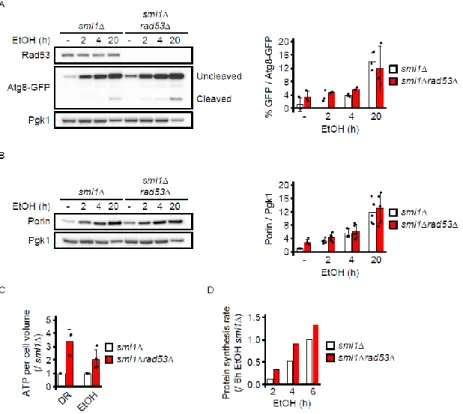
Figure S3. Related to Figure 2
(A) Cells of the indicated genotypes ectopically expressing the Atg8-GFP fusion protein were switched from glucose to ethanol medium for the indicated durations. Protein extracts were prepared and the levels of GFP (cleaved protein) and Atg8-GFP (uncleaved protein) were determined by Western blotting using an anti-GFP antibody. The bar chart in the right panel shows the ratio of cleaved vs. uncleaved protein as measure of autophagy activity. The experiment was performed with 3 independent clones of each genotype.
(B) Cells of the indicated genotypes were switched from glucose to ethanol medium for the indicated durations. Protein extracts were prepared and the level of the mitochondrial protein Porin was determined by Western blotting. The bar chart in the right panel shows the level of Porin normalized to Pgk1. The experiment was performed with 5 independent clones of each genotype.
(C) Cells of the indicated genotypes were adapted to low glucose or ethanol, extracts were prepared from from 1.5 mL culture at ~ 2x10⁶ cells / mL by zirconia bead breakage, and relative ATP levels were measured with a luminescence assay (abcam ab113849). The experiment was performed 3 times in low glucose and 4 times in ethanol. ATP levels were normalized to cell number and cell volume as measured with a CASY Ton cell counter device. ATP / cell volume was normalized to the sml1Δ control of the respective experiment.
(D) Cells of the indicated genotypes were cultured to logarithmic phase in normal glucose and switched to 3% ethanol in Methionine-free synthetic complete medium. After 1h, 3h or 5h, the Methionine analog L-homopropargylglycine was added for 1h at 50 µM. Fixation and staining were performed according to the manufacturer’s instructions (ThermoFisher C10428). Total Methionine analog incorporation was quantified by flow cytometry as measure of protein synthesis rate.
Figure S4. Related to Figure 2
(A-B) 102 strains covering all mutants with deletions of genes in telomere proximity from the haploid synthetic genetic array library were selected and glucose dependence was determined by spot assay. 107 cells / mL were serially diluted (1:6), spotted on YP plates with the indicated carbon sources, and grown for 2 or 3 days as indicated. The arrowheads indicate mutants with slow growth in low glucose or ethanol. (C) RT-qPCR quantification of the expression of YMR315W and YOL162W genes in the indicated genotypes and carbon sources. TFC1 was used as normalization control.
(D) sml1Δ strains containing deletions of subtelomeric gene clusters depicted in Figure S2A. Each deletion strain is named after the chromosome number and arm of the deleted gene cluster. Two independent clones were deletion were analyzed for glucose dependence by spot assay. 107 cells / mL were serially diluted (1:6), spotted on YP plates with the indicated carbon sources, and grown for 2 or 3 days as indicated.
Figure S5. Related to Figure 3
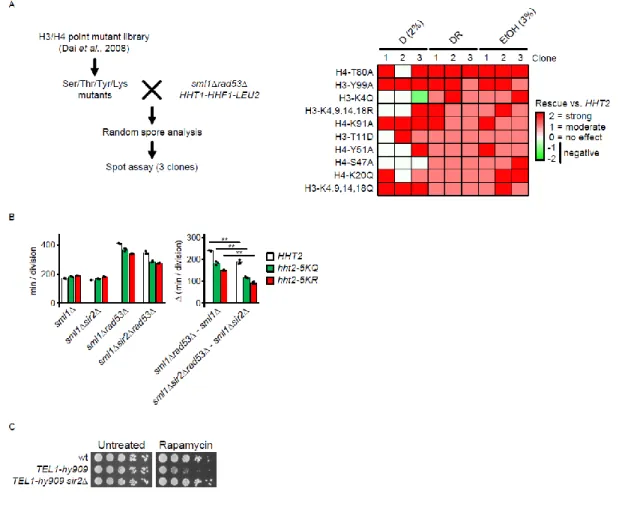
(A) Screening for functional histone modification sites mediating glucose dependence. Mutants of potentially modifiable amino acids in H3 and H4 were selected from the indicated library and crossed with a sml1Δrad53Δ HHT1-HHF1-LEU2 query. Diploids were sporulated and sml1Δrad53Δ HHT1-HHF1-LEU2 clones with individual histone point mutations were obtained by random spore analysis. Sensitivity to low glucose and ethanol of 3 independent clones per genotype were analyzed by spot assay, and the genetic interaction relative to the histone wild-type control was assessed visually (right panel). All strains contain the wild-type HHT1-HHF1 locus with the LEU2 selection marker integrated in proximity.
(B) Division times of strains in Figure 3A in liquid culture. Cells were inoculated in YP + low glucose and division speed was determined by cell counting over 2 days. Significance was calculated by Student’s t-test (two-sided, unpaired).
(C) 107 cells / mL were serially diluted (1:6), spotted on YPD plates with or without 1.5 ng/mL rapamycin and grown for 2d.
D = glucose, DR = glucose restriction (0.01% in solid media, 0.04% in liquid media), EtOH = ethanol. ** p < 0.01
Figure S6. Related to Figure 4
(A) Classification of differentially expressed genes in sml1Δrad53Δ vs. sml1Δ cells cultured in 2% glucose by carbon source switch signature and telomere proximity. The RNA-Seq data used for this analysis is presented in Figure 2.
(B) Classification of switch-like differentially expressed genes in sml1Δrad53Δ vs. sml1Δ cells by HHT2 dependence.
(C) Transcription factor target enrichment analysis within the indicated gene signatures by hypergeometric test with BH correction. Arrows show the direction of expression alteration. Transcription factor target annotation was obtained from Beyer et al., 2006 59.
(D) Transcriptome profile intersection analysis with similar literature datasets suggested by the SPELL tool (Hibbs et al., 2007) 60.
(E) Classification of altered metabolites related to trehalose synthesis in sml1Δrad53Δ vs. sml1Δ cells in normal glucose by HHT2 dependence.
(F) Comparison of altered metabolites in sml1Δrad53Δ vs. sml1Δ cells (x axis) and sml1Δspt21S276A vs. sml1Δ cells (y axis) cultured in normal glucose. The R value shows a high correlation of the fold-changes.
(G) Metabolite alterations in glycolysis and TCA cycle in sml1Δspt21S276A vs. sml1Δ cells are depicted. (H) Cells of the indicated genotypes were cultured in synthetic medium with 2% unlabeled glucose in log phase. An equal amount of medium with 2% 13C-glucose (all carbons labeled) was added at 0 min, and samples were quenched at the indicated time points. Metabolites were extracted and labeled vs. total metabolites were quantified by LC/MS analysis.
Figure S7. Related to Figure 4
(G) Comparison of altered metabolites in ethanol vs. normal glucose (x axis) and low glucose vs. normal glucose (x axis) in sml1Δ cells. The cells were adapted to the respective carbon source for 20h and harvested during the logarithmic growth phase. The R value shows a high correlation of the fold-changes. (H) Metabolite alterations in glycolysis, TCA cycle and trehalose metabolism in sml1Δspt21S276A vs. sml1Δ cells are depicted.
Table S1. Rad53-dependent phosphopeptides identified in two SILAC experiments. Related to Figure 1
Gene
Name Rad53-dependent Phosphopeptides
Fold Change (sml1Δdun1Δhht2Δ vs. sml1Δrad53Δhht2Δ) CYC8 K.ANSIPSphosVIGAQEPPQEASPAEEATK.A 1.15 ENP1 R.ILDDGSphosNGEDATR.V -1.01 LAS1 R.M(SS)phosFGTVGKK.N 1.49 MRP8 K.QVSphosELQDLVKK.Q 1.03 NPL3 R.ENSphosLETTFSSVNTR.D 1.09 NUP2 K.QA(SS)phosFSFLNR.A -1.10 NUP60 R.SNLSphosQENDNEGK.H 1.07 POL1 K.VKIDPDSSTDKYLEIE(SS)phosPLK.L -1.17 RLP24 K.LVESphosNPELLR.L 1.21 RPL6B K.QYLSASphosFSLK.N 1.13 SEC16 R.ELSphosEVASR.L 1.27 SPT21 R.TQSphosLPIWNLKPNIANTGFPR.N 979.41