A new WebGIS approach to support ground penetrating
radar deployment
Mémoire
Paulo Guilherme Tabarro
Sous la direction de :
Jacynthe Pouliot, directrice de recherche
Richard Fortier, codirecteur de recherche
Résumé
En raison de l’agglomération complexe des infrastructures souterraines dans les grandes zones urbaines et des préoccupations accrues des municipalités ou des gouvernements qui déploient des systèmes d’information foncière ou des industries qui souhaitent construire ou creuser, il devient de plus en plus impératif de localiser et de cartographier avec précision les pipelines, les câbles d’énergie hydroélectrique, les réseaux de communication ou les conduites d’eau potable et d’égout. Le géoradar (Ground Penetrating Radar ou GPR) est un outil en géophysique qui permet de produire des images en coupe du sous-sol desquelles de l’information utile sur les infrastructures souterraines peut être tirée. Des expériences antérieures et une analyse documentaire approfondie ont révélé que les logiciels disponibles pour réaliser des levés GPR qui sont utilisés directement sur le terrain et hors site ne reposent pas ou très peu sur des fonctionnalités géospatiales. En outre, l’intégration de données telles que la visualisation de données GPR dans des espaces géoréférencés avec des orthophotos, des cartes, des points d’intérêt, des plans CAO, etc., est impossible. Lorsque disponible, l’ajout d’annotations ou l’interrogation d’objets géospatiaux susceptibles d’améliorer ou d’accélérer les investigations ne proposent pas des interfaces conviviales.
Dans ce projet de recherche, une nouvelle approche est proposée pour déployer le GPR et elle est basée sur quatre fonctionnalités issues du Web et des systèmes d’information géographique (WebGIS) jugées essentielles pour faciliter la réalisation de levés GPR sur le terrain. Pour démontrer la faisabilité de cette nouvelle approche, une extension de la plate-forme logicielle existante GVX (conçue et vendue par Geovoxel) appelée GVX-GPR a été développée. GVX-GPR propose aux utilisateurs d’instruments GPR quatre fonctionnalités soit 1) intégration de cartes, 2) géo-annotations et points d’intérêt, 3) géoréférencement et visualisation de radargrammes et 4) visualisation de sections GPR géoréférencées. Afin de tester l’approche WebGIS et GPX-GPR, deux sites d’étude ont été relevés par deux professionnels différents, un expert et un non-expert en géophysique, ont été sélectionnés. Une première expérimentation réalisée sur le campus de l’Université Laval à Québec prévoyait l’identification de trois objets enterrés soit un câble électrique, une fibre optique et un tunnel dont leur position XYZ était connue. Le deuxième essai s’est passé à l’Universidade Federal do Rio de Janeiro
à interpréter les données GPR brutes en permettant l’interaction entre les données géospatiales (en ligne) et les profils de données GPR, et finalement pour la cartographie à produire tout en respectant la norme CityGML (donc utile au partage éventuel des données). De même, une fois le système maitrisé, GVX-GPR a permis d’optimiser la durée du levé.
Ce projet de maitrise a donc permis d’élaborer une nouvelle approche pour effectuer des levés GPR et proposer un outil logiciel pour tester la faisabilité de celle-ci. Une première étape de validation de la faisabilité et de l’utilité a été réalisée grâce aux deux tests effectués. Évidemment, ces deux tests sont des premiers pas dans une phase plus large de validation qui pourrait s’effectuer, et ils ont ouvert la porte à des ajustements ou l’ajout d’autres fonctionnalités, comme la manipulation des outils de visualisation 3D et l’ajout de filtres et traitement de signal. Nous estimons néanmoins ces premiers tests concluant pour ce projet de maîtrise, et surtout ils démontrent que les instruments GPR gagneraient à davantage intégrer les données et fonctionnalités géospatiales. Nous pensons également que nos travaux vont permettre à des communautés de non spécialistes en géophysique de s’intéresser aux instruments de type GPR pour les levés d’objets enfouis. Notre approche pourra les aider à préparer les données géospatiales utiles à la planification, à effectuer le levé terrain et à produire les cartes associées.
Abstract
Due to the complex agglomeration of underground infrastructures in large urban areas and accordingly increased concerns by municipalities or government who deploy land information systems or industries who want to construct or excavate, it is imperative to accurately locate and suitability map existing underground utility networks (UUN) such as pipelines, hydroelectric power cables, communication networks, or drinking water and sewage conduits. One emerging category of instrument in geophysics for collecting and extracting data from the underground is the ground penetrating radar (GPR). Previous experiments and a thorough literature review revealed that GPR software used in and off the field do not take advantage of geospatial features and data integration such as visualization of GPR data in a georeferenced space with orthophotographies, map, point of interest, CAD plans, etc. Also missing is the capability to add annotation or querying geospatial objects that may improve or expedite the investigations. These functions are long-lived in the geospatial domain, such as in geographic information system (GIS). In this research project, a new approach is proposed to deploy GPR based on four core WebGIS-enabled features, used to support field investigations with GPR. This WebGIS is based on an existing platform called GVX, designed and sold by Geovoxel as a risk management tool for civil engineering projects.
In this proposed approach, a generic guideline based on GVX-GPR was developed which users can follow when deploying GPR. This approach is based on four core features which are missing on most GPR software, (1) map integration, (2) geo-annotations and points of interest, (3) radargram georeferencing and visualization, and (4) georeferenced slice visualization. In order to test the designed WebGIS-based approach, two different professionals, an expert in geophysics and a person without any background in geophysics, used the proposed approach in their day-to-day professional practice. The first experiment was conducted at Université Laval (Québec – Canada) when the subject undertook an area to a survey in order to identify 3 possible targets pre-mapped. The second, with a Geophysics-specialist, took place in Rio de Janeiro, at Universidade Federal do Rio de Janeiro’s campus. This study covered an area counting on an unknown number of buried objects, aiming at reproducing a realistic survey scenario.
This project enabled the development of a new approach to leverage GPR surveys and proposed a new tool in order to test the approach’s feasibility. A first step into the validation of this proposal has been taken towards a feasibility and utility evaluation with two tests accomplished. Unmistakably, these are the first steps of a likely larger validation process, opening up new possibilities for the continuity of the project such as the addition of signal processing techniques and 3D data handling. We nevertheless consider these conclusive for this master’s project, above all demonstrating the value add by geospatial data integration and functions to GPR instruments. This work is also intended to the community of newcomers, or interested in GPR, to further explore this technology, since this approach shall facilitate the preparation, execution, and post-processing phases of a GPR survey.
Table of contents
Résumé ...ii
Abstract ... iv
Table of contents ... vi
List of Figures ... ix
List of Tables ... xii
List of abbreviations and acronyms ... xiii
Acknowledgements... xv
Foreword ... xvi
Chapter 1 - Introduction ... 20
1.1 Underground Utility Networks (UUN) ... 20
1.2 Detecting and Mapping UUN ... 22
1.2.1 Standards and Procedures ... 27
1.3 Problematic ... 28
1.4 Objectives ... 33
1.5 Methodology ... 34
1.5.1 Requirements’ gathering and feasibility analysis ... 35
1.5.2 Use case and class data modelling ... 36
1.5.3 Approach design and specialist validation ... 36
1.5.4 Software development ... 36
1.5.5 User test and validation... 37
2.4.1 Infrastructure overview ... 53
Chapter 3 - A WebGIS to Support GPR 3D Data Acquisition: A First Step for the Integration of Underground Utility Networks in 3D City Models ... 56
Résumé ... 56
Abstract ... 57
3.1 INTRODUCTION ... 58
3.1.1 The lack of Underground Utility Data ... 58
3.1.2 3D Data acquisition with Ground Penetrating Radar ... 59
3.1.3 Research project objectives ... 61
3.2 GVX-GPR – An integrated approach ... 62
3.2.1 The GIS system - GVX GPR module ... 62
3.2.2 Preliminary Results ... 63
3.3 CONCLUSION ... 67
Chapter 4 - Detection of buried infrastructures using ground penetrating radar: The validation of a map-based approach for GPR users ... 68
Résumé ... 68
Abstract ... 69
4.1 INTRODUCTION ... 70
4.1.1 Underground Utility Networks’ Detection and Damage Prevention ... 70
4.1.2 Problem statement ... 71
4.1.3 Objectives ... 72
4.1.4 Methodology ... 74
4.2 Ground Penetrating Radar ... 74
4.2.1 Principles and Devices ... 75
4.2.2 Technology and map-based systems for GPR ... 77
4.2.3 GPR and GIS Integration ... 79
4.2.4 Standards and Procedures ... 79
4.4 Experiments ... 83
4.4.1 First Experiment... 83
4.4.1.1 Case study ... 83
4.4.1.2 GPR Survey ... 84
4.4.1.3 Results and discussion ... 85
4.4.2 Second Experiment ... 87
4.4.2.1 Case study ... 87
4.4.2.2 GPR Survey ... 87
4.4.2.3 Results and discussion ... 89
4.5 Conclusion... 90
Acknowledgements... 91
Chapter 5 - Results and Discussions ... 92
5.1 User Testing #1 ... 92
5.1.1 Study Site and Equipment ... 92
5.1.2 Survey Setup and Execution ... 94
5.1.3 User Discussion and Results ... 96
5.2 User Testing #2 ... 98
5.2.1 Study Site and Equipment ... 98
5.2.2 Survey Setup and Execution ... 98
5.2.3 User Discussion and Results ... 100
Chapter 6 - Conclusions and Recommendations ... 106
Return on the Objectives ... 106
Summary of the Contributions ... 108
List of Figures
Figure 1.1: A complex UUN underground environment (Courtesy of Geovoxel). ... 21
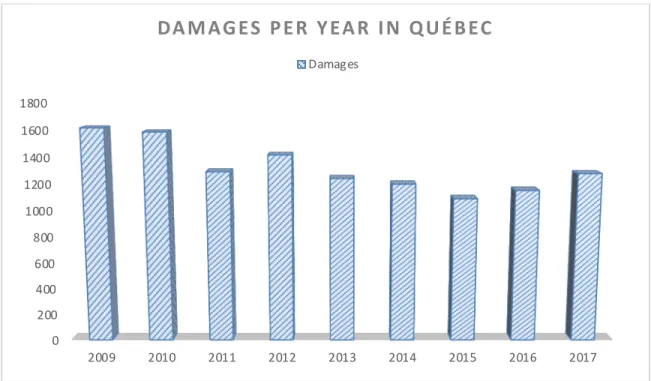
Figure 1.2: Damages per year in the state of Quebec according to Info-Excavation. ... 23
Figure 1.3: A fictitious GPR mesh showing the line pattern followed by a GPR operator. ... 24
Figure 1.4: Example of a GPR radargram profile and a 3D cube generated from the interpolation of multiple profiles. ... 25
Currently, most of the GPR technologies count on annotations on profiles to demark likely targets on the profiles, feature which is usually combined with hyperbola fitting. Some companies have also taken steps forward and allowed users to directly translate these annotations into geo-annotated points, mitigating user error when translating a location from a GPR profile to a real-word coordinates. An example (Figure 1.5) IDS’s Opera Duo, which displays on a map the points annotated by GPR users. ... 25
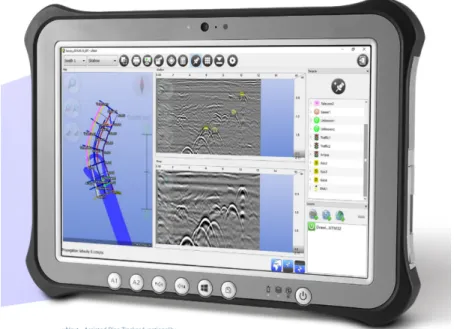
Figure 1.5: uNext by IDS displaying a multiple-view screen with geo-referenced features on the left side and GPR radargrams on the right-hand side. ... 26
With multiple profiles combined through interpolation methods and profiles annotated with targets, these electromagnetic signals become a 3D GPR cube. With these profiles as cross-sections and 3D cube in hands, the GPR operator perform the interpretation of electromagnetic interferences and may be able to draw conclusions about the presence of likely UUN. Figure 1.6 is the representation of interpreted results directly in a 3D cube environment with the software RADAN. ... 26
Figure 1.6: 3D data manipulation on RADAN (Geophysical Survey Systems, inc.). ... 26
Figure 1.7: Flow diagram of the engineering approach used in the research project presented herein.... 35
Figure 2.1: Inhereted data model from CityGML displaying the main features and their relations. ... 44
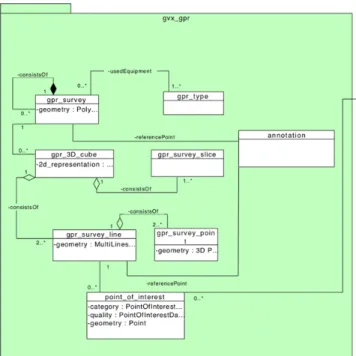
Figure 2.2: Class diagram developed to store and organize GPR data utilized by GVX-GPR... 45
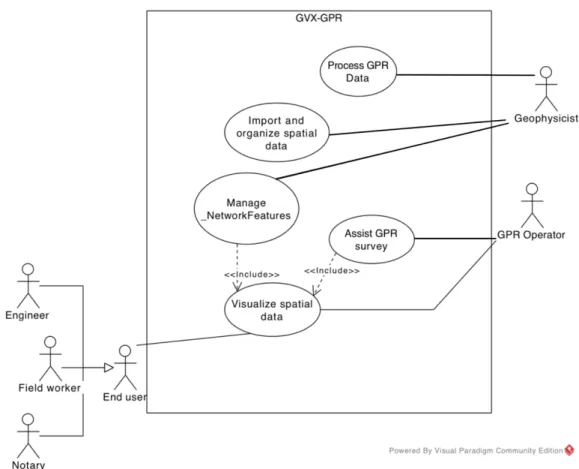
Figure 2.3: Use case diagram representing the main actors and main actions of GVX-GPR. ... 47
Figure 2.4: Sub-diagram representing actions for the action Visualize Spatial Data. ... 48
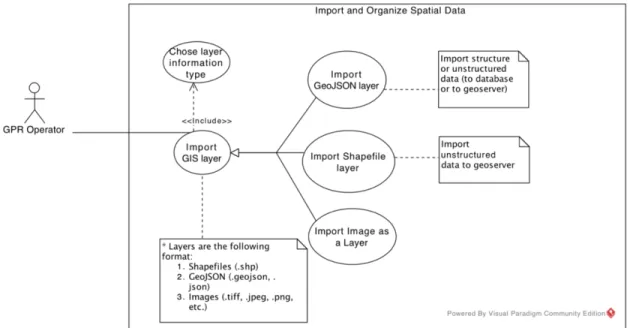
Figure 2.5: Use case diagram describing action Import and Organize Spatial Data. ... 49
Figure 2.6: Use case diagram for Assist GPR Survey. ... 50
Figure 2.7: Use case diagram for Process GPR Data’. ... 50
Figure 2.8: Use case diagram Manage_NetworkFeatures. ... 51
Figure 2.9: GVX platform-as-a-service during the construction of a tunnel in Brazil (Losier et al., 2015). 52 Figure 2.10: Multisource data integration on GVX represented by 5 main types of data. ... 53
Figure 2.11: High-level view of the architecture and technology components used during the development of the WebGIS interface. ... 55
Figure 3.1: Example of underground utility networks, central London. Image courtesy of Hitachi (Source:
Bentley Intelligent 3D Models). ... 59
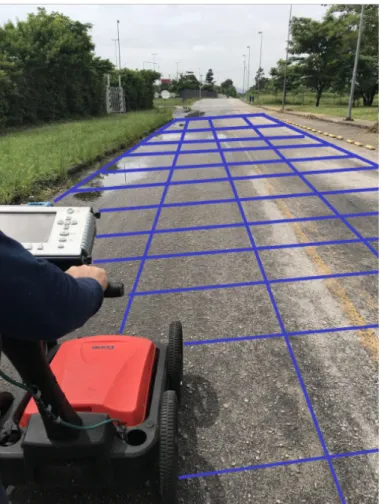
Figure 3.2: Ground-penetrating radar survey in progress. ... 60
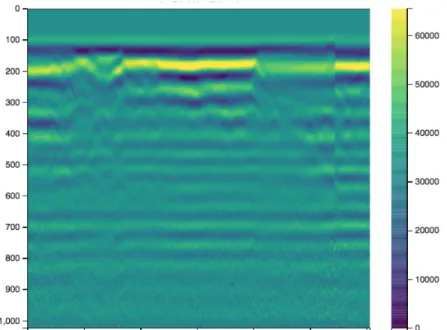
Figure 3.3: GPR profile showing hyperbolic diffractions indicating possible UUN’s. Image courtesy of Geovoxel. 61 Figure 3.4: Current GVX’s dashboard. ... 63
Figure 3.5: Use case of the new GVX-GPR module. ... 64
Figure 3.6: Class diagram of the new GVX-GPR module. ... 64
Figure 3.7: GVX-GPR mock-up interface. ... 65
Figure 3.8: A georeferenced horizontal slice of a 3D GPR cube (purple rectangle) overlapped with the existing information (road in red and pre-surveyed UUN in blue). ... 66
Figure 3.9: A multi-angle view of the studied site. ... 66
Figure 4.1: Example of underground utility networks, Rio de Janeiro (Courtesy of Geovoxel). ... 70
Figure 4.2: Block diagram representing the components of a GPR. ... 75
Figure 4.3 : MALA X3M in action at Université Laval – Québec. ... 76
Figure 4.4: GPR data: a) Radargram showing a clear target, being the X-axis the distance and Y the depth of investigation (courtesy of Geovoxel), b) 3D cube of a buried cable produced using Voxler, the blue axis indicates the depth while the red and green axis are the X and Y distances (source Pouliot et al., 2016). ... 77
Figure 4.5: The WebGIS approach proposed to assist the deployment of GPR surveying... 81
Figure 4.6: The surveyed area located in the Campus of Université Laval in Québec City, Québec, Canada, with one GPR survey line represented in red and points of interest in orange and red in the GVX-GPR user interface ... 84 Figure 4.7: GVX-GPR in action - on left the selected non-specialist with the system - on right an example of the user interface with in red the GPR surveyed line and two possible targets located both on the 2D map and the radargram. 85
Figure 5.2: GVX-GPR’s layer selector open (black dashed square) displaying to the user the available layers for the survey, along with red markers meaning geo-annotated images and/or comments about the survey site. 94 Figure 5.3: Area surveyed for survey 2016 (blue polygon) and area surveyed for survey 2017 (red polygon) and in orange, the buried fibre optic. ... 95 Figure 5.5: Planned GPR profiles of the survey area (5.4.a). Actual GPR profiles uploaded in GVX-GPR (5.4.b). 100
Figure 5.6: A multi-view perspective of a selected GPR profile, containing the selected feature (upper part, only partially displayed), a larger map view (bottom, left photograph), and the street view from Google Street View (bottom, right photograph). ... 101 Figure 5.7: GPR depth slice (top figure) showing the likely existence of a water main (identified by white arrows) and radargram (bottom figure). ... 101
List of Tables
Table 1.1: Questions and answers about software and deliverables submitted to two companies. ... 31 Table 4.1: Review of GPR options for displaying and interacting with data (yes = feature observed, no = feature not observed, partially = feature is there but not fully operating). ... 78 Table 4.2: Structured form filled out by for the user (non-GPR specialist) of GVX-GPR module after the first experiment in the campus of Laval University, Québec, Canada... 86 Table 4.3: Structured form filled out by the user (GPR specialist) of GVX-GPR module after the second experiment at the Federal University of Rio de Janeiro (Brazil). ... 90 Table 5.1: Score given by the user on the impact of the features on each success criteria (0 – no impact at all, 10 – great impact). ... 103
List of abbreviations and acronyms
ADE – Application Domain ExtensionASCE – American Society of Civil Engineers CAD – Computer-Aided Design
CSA – Canadian Standards Association ETL – Extract, Transform, and Load GIS – Geographic Information System GPR – Ground Penetrating Radar MVC – Model, View, Controller MVP – Minimal Viable Product UML – Unified Modeling Language UUN – Underground Utility Networks XP – Extreme Programming
A goal is a dream with a deadline.
Acknowledgements
First, I would like to thank the people who actively helped me to pursue my studies and help me in this journey of coming to a new country, learning a new language, and being introduced to a culture I didn’t know.
First of all, I would like to wholeheartedly thank Ms Jacynthe Pouliot, my professor, research director, and, most of all, friend, for every minute spent helping me out, correcting my errors, guiding me through the steps of carrying out a research project of this magnitude. Without you guidance and your trust, I wouldn’t have succeeded. A special thanks to Louis-Martin Losier, for having indicated me, worked with me, actively participated in my studies and research subjects, and also being a friend, with a lot of compassion through the roughest moments. My true gratitude to Prof. Richard Fortier for his contributions and teachings, as well as willingness to collaborate with the project.
Enormous thanks to all my very special friends who have supported me through all the moments and rough patches. Understanding and sharing my grieves and smiles.
I would also like to express my gratitude to Natural Sciences and Engineering Research Council of Canada and Mitacs accelerate to funding this research project, and to Geovoxel Brazil and Promark-Telecon for providing equipment and highly courteous and proficient professionals for our experiments.
Finally, thanks to my family and friend (in Brazil), who even far far away, never let me have the feeling of being alone.
Foreword
This dissertation presents a novel approach to the deployment of Ground Penetrating Radar in order to properly locate and map underground utility networks. Initially, this research was projected to develop a technology which would be an integrating part to a real-time display of GPR’s. Finally, in the beginning of 2017, with my conversations with Prof. Jacynthe Pouliot, vice dean of research at the faculty of forestry, geography, and geomatics at Université Laval, and Louis-Martin Losier, PhD in environmental geotechnics, we noticed the potential to have Geovoxel’s existing solution developed until a level that it would not be a real-time display for GPR’s but a tool to help the end-to-end process. With the help of Prof. Richard Fortier, co-director of research, professor, and director of the Centre d'études Nordiques, and his expertise in GPR, we were able to delimit a project and scope for this Master’s project. This project is framed within the research of Prof. Jacynthe Pouliot, funded by the Natural Sciences and Engineering Research Council of Canada. Along this funding, Geovoxel Inc. has also contributed to its funding through a Mitacs Accelerate scholarship.
All the results presented in this dissertation were obtained during experiments, with openly accessible data sources, and open license software/tools. Some of the assumptions utilized as basis for its problematics and motivation were conducted by the research team in the past years previous the project debut. For instance, Prof. Jacynthe Pouliot’s contribution to the evaluation of user needs when visualizing underground utility networks on cartographical interfaces and Jean-Michel Lavoie’s research based on the use of GPR for land information systems. From their results and conclusions, the research team and I, we have designed, planned, executed, and tested the software and approach in question.
After the first user experiment conducted in the autumn 2017, we submitted a first conference publication, which took place in October 2017, in Melbourne – Australia. This first extended abstract presented the first results obtained and the evaluation process which guided us through our proposition. The published extended abstract information is found below.
Available online: https://www.int-arch-photogramm-remote-sens-spatial-inf-sci.net/XLII-4-W7/43/2017/isprs-archives-XLII-4-W7-43-2017.pdf
Publisher: The International Archives of the Photogrammetry, Remote Sensing and Spatial Information
Sciences
Volume/Issue: XLII-4/W7
A second user experiment, providing more solid results for the research was conducted in January 2018, at Universidade Federal do Rio de Janeiro (Brazil) with the partnership of Geovoxel Brazil. These results along with data processing and interpretation provided the team with further material for a second manuscript which has been submitted to an international journal presenting a closer to complete overview of the research project. The information about this manuscript are presented below.
Title: Detection and location of buried infrastructures using ground penetrating radar: An original approach
based on GIS and data integration
Journal: International Journal of 3-D Information Modeling (IJ3DIM) Date: under review (accepted with major modifications)
Type: Paper
Authors: Paulo Guilherme Tabarro, Jacynthe Pouliot, Richard Fortier, Louis-Martin Losier Open access: No
Status: Under revision, previously accepted with major corrections Publisher: IGI Global eEditorial Discovery
Chapter 1 - Introduction
1.1 Underground Utility Networks (UUN)
As the cities worldwide are keeping a fast-paced growth, the utilities supplied to the population such as Internet, hydroelectricity, sewerage, water, etc. are growing just as much (Aydin, 2008; as cited in Jeong et al., 2004, p. 225). Simplistically categorizing infrastructures, they can be found above the ground level and in the underground. Often, infrastructures under the ground such as cables, pipes, ducts, etc., are referred to as Underground Utility Networks (UUN). An example of a complex UUN located in downtown Rio de Janeiro, Brazil, is shown in Figure 1.1. Due to the increasing apprehension of underground utility’s damage, a practice called Subsurface Utility Engineering, formalized by ASCE (2002), has been proposed, introducing a new framework to manage risk by identifying and assuring quality of underground utilities (CSA, 2011, p. 4).
When building houses, edifices, pavement as well as expanding these structures, it is of extreme importance to identify, beforehand and during trenching activities begin, how structures are laid on the subsoil (Costello et al., 2007; Lew and Anspach, 2000; Metje et al., 2007). This is related to social-economic impacts to business and inconveniences to the population when the unknown UUN are damaged during excavation. The awareness of UUN location upon digging ensures population of reliable supply of services such as hydroelectricity, internet, water pipes, water pipes, and gas pipelines (Info-excavation 2015; Tan and Looi, 2013). A great number of the functioning infrastructures were built years or decades ago, when mapping technologies were not as mature as nowadays and standards were not outlined or widespread. Due to this inherited lack of knowledge of what is under the ground, ground disturbances pose an imminent risk for governmental and private stakeholders as well as households when planning and executing developmental projects, since they can cause damages to UUN and disrupt essential services such as drinking water and electricity to the population. Ground disturbances are defined as digging, excavation, trenching, ditching, tunneling, boring/drilling/pushing, augering, topsoil stripping, land levelling/grading, and plowing for several purposes such as the installation of new UUN (CSA, 2011, pp.
prevention when services keep running following a ground disturbance, without major impacts to population, businesses, and governmental organizations. In Figure 1.1, ground disturbances without a good mapping of the UUN available before the excavation would likely result in severe damages to the utilities and disrupting the services.
In addition, if none or inaccurate information is available about the UUN during ground disturbances and when an utility is affected, the question falls into who is responsible for the repairing costs and as well as the deficient service to the population, since 80% of the damage caused to subsurface infrastructure caused an interruption of service in Quebec (Info-Excavation, 2015).
Ideally, in order to avoid these extra costs, accidents, and damages to UUN, before the beginning of any ground disturbance, engineering companies and households should be able to have ample access to unified UUN database resources of the surrounding areas targeted to be disturbed (Girard and Pouliot, 2015). This mapping resources should offer enough spatial information for the operators of the construction to be able of avoiding any types of hazards. This information must give the users the ability to geographically identify objects and their characteristics. In other words, users have, with minimal effort, access to information on the objects’ location, depth, gage, and function of the UUN belonging to the delimited project area.
1.2 Detecting and Mapping UUN
The importance of properly locating and mapping underground infrastructures is brought, more and more, to public and private organizations. Two questionnaires on the innovation in locating and characterizing UUN from the Transportation Research Board in Washington D.C. illustrate some of the problems faced by utility directors, representing 34 states of the US (Sterling et al., 2009). In the first questionnaire, the issues for not accurately mapping underground utilities are discussed while, in the second one, the best practices in locating and characterizing the most problematic underground utilities are presented. Based on the results presented in these questionnaires, the cost, time, and lack of management are the largest issues related to the proper location of UUN. However, two statements seem extremely relevant for the purpose of the research undertaken herein. Nine among twenty six responders affirmed that getting accurate information on UUN from specialized consultants and current equipment to locate UUN are not enough good. The follow up comments in these questionnaires are of equal or higher relevance and strengthen the importance of the research project presented in this M.Sc. thesis (Sterling et al., 2009):
• Develop public geospatial databases.
• Get high-quality mapping early in any engineering project involving ground disturbances. • Require professional survey to accurately locate UNN for as-built information.
• Mandate use of the Standard Guidelines for the Collection and Depiction of Existing Subsurface Utility Data.
This problematic presented by Sterling dates from 2009, however, this scenario does not seem to have been reverted. For instance, in 2017, Info-excavation reported over five damages per business day in the province of Québec, Canada, implying a raise of 11% in the number of damages relative to 2016, which already represented a CAD$123 million in social-economic-related direct and indirect costs (Info-excavation, 2017). According to
Figure 1.2: Damages per year in the state of Quebec according to Info-Excavation.
The linear behavior of the number of accidents can be attributed to multiple factors. However, it reveals that, to date, despite the standards and procedures being created, either the community is still absorbing/comprehending the importance and laying out strategies of best practices at their fullest. Another likely reason can also be the number of developments being conducted along the years, resulting in the market of SUE could not being able to provide enough proficient workforce to achieve better numbers. Moreover, outside the infrastructure and land management community, the population as a whole plays an important role in the awareness of the need for proper location of underground object prior excavation.
In case of non-existing documentation, a solution which has been largely adopted is to perform non-destructive surveys such as Ground Penetrating Radar (GPR) profiling, radio detection, and electrical resistivity tomography, aiming at collecting underground images or signals for geographical, dimensional, and compositional aspects of buried objects (Samet et al., 2017, pp. 1). With such information, it is possible to represent UUN georeferenced data in maps and geospatial software with the main goal of providing the users with a robust understanding of the UUN before ground disturbances.
The GPR is one of the widely accepted and most technological methods to gather subsurfacedata (Jaw and Hashim, 2013, p. 21). It uses electromagnetic signal transmitter and receivers to produce subsurface image under the form of cross-section along GPR survey line in which electromagnetic interferences due to UUN are
0 200 400 600 800 1000 1200 1400 1600 1800 2009 2010 2011 2012 2013 2014 2015 2016 2017
DAMAGES PER YEAR IN QUÉBEC
Damagesidentified. Prior to start GPR acquisition, a GPR practitioner, professional or non-professional GPR operator, has the needed documentation for identifying area of coverage, hypotheses, and possible targets. With these documents in hand, the GPR operator is expected to carry out data acquisition in a given region of interest. After understanding the survey goals to locate UNN and assessing the terrain accessibility, the GPR operator usually divide the area of coverage into blocks and, subsequently, determine a mesh, which depending on the covered area and the targeted utilities is spaced by regular intervals as guidelines (Figure 1.3).
During data acquisition in the field, as a rule a thumb almost independently applied on the nature of the project, the GPR operator follows equally spaced intervals but also avoids all obstacles found along the survey lines. The images generated from the equally spaced GPR survey lines are then interpolated and transformed from single 2D cross-sections (Figure 1.4).
Figure 1.4: Example of a GPR radargram profile and a 3D cube generated from the interpolation of multiple profiles.
Currently, most of the GPR technologies count on annotations on profiles to demark likely targets on the profiles, feature which is usually combined with hyperbola fitting. Some companies have also taken steps forward and allowed users to directly translate these annotations into geo-annotated points, mitigating user error when translating a location from a GPR profile to a real-word coordinates. An example (Figure 1.5) IDS’s Opera Duo, which displays on a map the points annotated by GPR users.
Figure 1.5: uNext by IDS displaying a multiple-view screen with geo-referenced features on the left side and GPR radargrams on the right-hand side.
With multiple profiles combined through interpolation methods and profiles annotated with targets, these electromagnetic signals become a 3D GPR cube. With these profiles as cross-sections and 3D cube in hands, the GPR operator perform the interpretation of electromagnetic interferences and may be able to draw conclusions about the presence of likely UUN. Figure 1.6 is the representation of interpreted results directly in a 3D cube environment with the software RADAN.
Apart from GPR, other technologies are used independently or interchanged with each other (and GPR) when detecting underground utility networks (Desai et al., 2016):
1. Induction utility locators: the most common survey method for UUN, even though it requires either an existing background signal or an induced current. In a trial and error deployment, induction locators are capable of detecting most power cables but not water mains, PVC pipes, etc, if not added by an induction generator;
2. Acoustic location method: also trial and error-based, utilizes an acoustic to identify sounds introduced into the mean, which usually is a liquid or a gas;
3. Magnetic locators: use objects’ magnetic properties to locate them, which can be applied to networks with limited applicability;
4. Magnetic surveys: measures soil disturbances to earth’s magnetic field (using the magnetized materials).
1.2.1 Standards and Procedures
Worldwide, the initiatives for properly formalizing practices and quality of data for SUE have been emerging over the last decade. In the United States, the American Society of Civil Engineering has proposed the standard ASCE 38-02 which describes four levels of quality and their means of acquisition. Both Canada and Malaysia4 have similarly followed the framework and implemented the respective standards CSA S250 and the Standard Guideline for Underground Utility Mapping. The American and Canadian standards not only propose methods but also standardize how data is represented (ASCE, 2002; CCGA, 2014; CSA, 2016).
These standards recommend that engineers have to talk and define with companies both the level of quality and the deliverable expected and recommend improvements of level of quality for certain areas that seem worth reviewing. According to ASCE 38-02, the levels of quality defined are as follows.
• Level of Quality A: The position and dimensions of the infrastructure are measured by the actual exposure of the infrastructure. A least-possible excavation is performed to avoid damage to these infrastructures. A recommended accuracy is usually of 15mm.
• Level of Quality B: Site undergoes survey(s) with geophysical methods. The tolerance of the accuracy is stablished by the project owner.
• Level of Quality C: Based on the visualization of external infrastructures (manholes, poles, etc.), a professional correlates these items to conclude where utilities are located.
• Level of Quality D: Information from existing records and oral collections
In the UK, BSI has proposed, alongside clients and contractors, a thorough guide for data acquisition of the underground. It lays a framework for quality levels’ requirements and the procedure recommended to achieve so, in a more detailed manner, varying from verification of the exposed infrastructure to simply accessing previously mapped data on location analytics solutions. The standards proposes levels of quality ranging from A to D, like the previous ones. However, what differentiates this standard from the ones previously mentioned is the enforcement of survey-specific parameters in order to achieve expected qualities of data B, which is broken down to four new categories. This is done by categorizing which type of survey the site will receive. For instance, the standard describes that to achieve a level of quality for survey methods B1 (the highest), with single/multi-channel GPR, users would be required to perform a 1m grid. The quality levels are defined are follows:
• B1: Accuracy level of 15cm • B2: Accuracy level of 25cm
• B3: Accuracy level of 50cm, with or without depth
• B4: No level of accuracy defined. Infrastructure is believed to be buried but without conclusive evidence
As what can be considered as the single most important point of converge between these standards is the fact that all of them proposing as the best practice, the mapping UUN’s while they are still exposed, aiming to avoid costs and errors that are tightly correlated to other acquisition methods.
1.3 Problematic
Although the use of GPR to locate UUN is growing in popularity, their manipulation is not trivial and GPR data interpretation still stands as a great barrier for skilled and unskilled GPR practitioners (Cassidy, 2009; Jol 2008; Rahman and Zayed, 2016; Li, 2015). As claimed by Cassidy (2009) “Unfortunately, the ease of both use and data interpretation is also GPR’s pitfalls, as many inexperienced practitioners fail to fully appreciate the true
Taking the province of Québec as an example, a system called FITNO5, which is the register of public service networks, provides information on which companies may own buried infrastructures in a given area, but this register does not offer a geographical interface to visualize UUN’s on a map (Pouliot et al., 2015). Another source of information for underground cadastral data is a Quebec’s “call before dig” service called Info-Excavation. This organization, formed as a consortium of companies but managed as a separate institution, offers a service free of charge which demands from utility owners to indicate, with ground marks or documentation, where their infrastructure is located. In the case of missing records or unprecise information, the area has to undertake re-surveying.
In the case of surveying being a requirement and GPR the choice for this data acquisition, a time-consuming interpretation process takes place and may last up to three times longer than the fieldwork, generally done with highly specialized software, in a stage called post-processing phase (Benedetto and Pajewski 2015; Jol, 2009; Rodrigues, 2016). As a result, during the interpretation phase, if a survey appears to be lacking information, the GPR operator has to return to the surveyed site to gather the missing information, adding costs and time to the project execution.
Based on previous experiments with various GPR instruments and software (Lavoie and Pouliot, 2016) and literature review revealing efforts for integrating GPR and GIS (Dallaire and Garneau, 2008; Li et al., 2015; Themistocleousa et al., 2015; Talmaki et al., 2013; Tischler, 2003; Zheng et al., 2004), only a limited number of GPR software offer capacities for spatial data visualization and overlaying GPR data with other sources of data. Even though most GPR’s have an interface capable of showing the data collected in real time, operations using this interface such as signal processing, hyperbola fitting, geographic interaction such as adding annotation, attribute or metadata, drawing line and box, or querying spatial database are very limited, if they exist at all. GPR data are often not georeferenced in an official coordinate system, which limits the capability for integrating such data with multiple sources of valuable spatial data. Some GPR instruments allow GPS to be integrated for real-time georeferencing images (Li et al., 2014; Rial et al., 2006), but yet, GPS signal in urban areas is highly disturbed or even absent due to a dense number of buildings and interferences from radio emissions6.
As debated in Lavoie and Pouliot (2016), besides the need of geospatial tools not only to empower GPR surveys but provide ample access to this information, a comparative assessment of the visualization of underground utility networks on map-based interfaces was performed by the research team. Four distinct issues have been identified: (1) cadastre mapping of UUN is missing geospatial data and put management of rights,
5https://foncier.mern.gouv.qc.ca/Portail/notaires-avocats/inscription-au-registre-foncier/fitno/ 6https://www.gps.gov/spectrum/
responsibilities, and restrictions associated to such objects at risk, (2) GPR data and instruments are very relevant for such data acquisition, (3) most land-surveyors have limited skills regarding manipulation of GPR instruments and data, and they are not able to appreciate the value of such source of information/equipment, (4) current GPR’s operators do not really know/worry about having georeferenced data or applying integrated and standardized geospatial database or GIS approaches or innovative solutions like augmented reality visualization. Additionally, a market assessment, made by Geovoxel in Brazil, revealed that among 13 companies that offer GPR survey as a service, none of them offered to its customers geospatial deliverables, but CAD plans instead. CAD plans are a spread 2D/3D technology for technical drawing and annotation designs. In addition, industrial and governmental customers of GPR services’ providers often rely on old-fashioned CAD documents as data source, frequently stored it in paper format or unstructured and unsystematic ways (Beck & Stickler 2009; Jeong et al., 2004).
Despite of CAD’s acceptance and diffusion for representation of UUN outside the blueprint’s world, manuals and standards provide proper guidelines for geospatial data collection, mapping, and representation of UNN (ASCE 2002; CCGA 2014; Chen and Cohn 2010; CSA, 2011, 2016; Metje et al., 2007). Some manuals go as far as outlining the density of survey lines required in order to achieve higher data accuracy levels (BSI, 2008). Following studies such as Thomas et al. (2009), stakeholders are not satisfied with levels of accuracy superior of 100 mm. Other requirements regarding depth show that GPR imposes limitations when targets are at depths larger than 3 m (in scarce cases), thus imposing even higher standards for data precision. Despite of their existence, studies still reveal a linear behaviour of the number of strikes (such as in Figure 1.2). This may be due to many reasons, but it is rational to conclude that either standards do not propose enough procedures or that GPR professionals are yet unaware of their importance. Currently, these communities (SUE engineers, geophysicists, geomaticians) do not frequently work collectively; even though the society in general would greatly benefit of such collaboration.
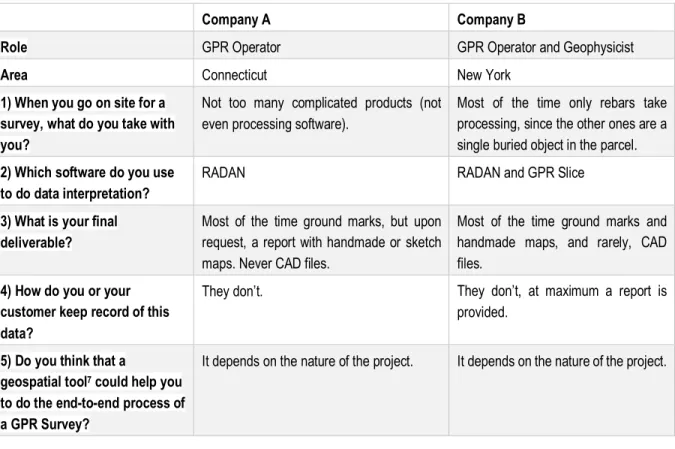
To better identify the needs of GPR practitioners, a series of questions about the software used by their GPR operators when surveying and the deliverables which they have to provide to their clients have been submitted to two companies (not disclosed for privacy reasons). The answers to these questions are given in Table 1.1. According to the two interviewed GPR users, representing their respective company, they mostly perform simple surveys to find a single buried infrastructure in a parcel. However, the lack of geospatial software integration is an important limitation. In question 2, they use standalone software which requires the use of a computer in the field for processing and interpretation purposes if required. This is unpractical for production levels. In addition, only the GPR Slice software relies on geospatial features according to the available markers on site. This software also depends on internet connection and does not allow users to draw directly in a georeferenced environment to generate standard-compliant data. Most of the maps generated during surveys by both GPR practitioners are handmade maps and used to support a report when needed, but most of the time, the data lifecycle ends as a soil mark, and not in a structured database which has to be supplied to governmental agencies and notaries who may use it for cadastral purpose. And, finally, the users showed a great interest in trying the new proposed solution and would be willing to test this solution.
Table 1.1: Questions and answers about software and deliverables submitted to two companies.
Company A Company B
Role GPR Operator GPR Operator and Geophysicist
Area Connecticut New York
1) When you go on site for a survey, what do you take with you?
Not too many complicated products (not even processing software).
Most of the time only rebars take processing, since the other ones are a single buried object in the parcel.
2) Which software do you use to do data interpretation?
RADAN RADAN and GPR Slice
3) What is your final deliverable?
Most of the time ground marks, but upon request, a report with handmade or sketch maps. Never CAD files.
Most of the time ground marks and handmade maps, and rarely, CAD files.
4) How do you or your customer keep record of this data?
They don’t. They don’t, at maximum a report is provided.
5) Do you think that a
geospatial tool7 could help you
to do the end-to-end process of a GPR Survey?
It depends on the nature of the project. It depends on the nature of the project.
Comments Most of the time, the surveys are very straightforward and do not require any processing. In these cases, no software is required and also the customer does not need to have a lot of information resources on the surveyed area. However, the GPR practitioner has declared a lot of curiosity for the solution and would be interested to test it.
GPR user does very punctual work but he is very enthusiastic and he thinks that the proposition is very well arranged.
In summary, a series of problems related to UUN and GPR surveys to accurately locate UUN have been identified as a basis for this research project presented herein:
• Digging without enough map resources often leads to UUN damages and disruption of essential services;
• Not only underground cadastral mapping but also mapping resources in general are often incomplete for UUN risk management;
• GPR users arrive to survey sites with no or scarce information about the survey area (boundaries, properties, obstacles);
• When on site, GPR users do not have tools that support remote access to information and/or complete post-processing software solutions;
• Despite of GPR’s popularity, most users are able to handle it but not to interpret the data;
• GPR data interpretation is toilsome, ineffective (may not find all buried objects in the area), and inefficient (too much time and resources spent to carry out a single survey);
• Current GPR software relies minimally on geospatial tools, which have a large synergy with this domain; • Surveys’ deliverables are often unstandardized and became paper reports, handmade maps, and soil marks, instead of digital maps and databases that comply with software and organizations standards across the industry and government.
1.4 Objectives
The overall objective of the research project is to improve the deployment of GPR investigation by supplying to users WebGIS capabilities available on a portable device in the field. To achieve this objective, a new innovative approach is proposed taking into account the workflow and needs of GPR users, specialists, and end users while performing an end-to-end survey. This approach aim at responding to the assessed need of geospatial tools with new features in a map-based, online, software provided by Geovoxel. This WebGIS module is called GVX-GPR. In this module, geographical features are exploited to improve the deployment of GPR survey in the field and assist the GPR specialists in the data processing and interpretation of GPR survey. A new WebGIS was developed and it provides to GPR operators multiple layers of structured spatial data including GPR scans and the ability to geo-annotate, in a controlled manner, points of interest. This module is easily operated on site through devices such as tablets and/or smartphones. The new WebGIS-based approach aims to help GPR operator to:
• Conduct GPR surveys that bring resources into more effective actions and results, increasing users’ comprehension of the survey site and the interpreted data,
• Ease the GPR deployment for not only experienced professionals but also newcomers, increasing the usage of this geophysical tool for UUN detection and location,
• Achieve more complete interpretation with less technical effort, being as close as possible to identify and locate all UUN,
• Provide ample access to online information resources and tools, even though GPR practitioners may be outside the office,
• Perform more efficient production of subsurface maps, which support decision-making process for field work, and
• Deliver more reliable underground infrastructure data, available to a larger community of users.
As long-term contributions, the proposed approach for the deployment, processing and interpretation of GPR surveys intends to aid customers, industry, official authorities in proposing more rigorous and integrated procedures for locating and mapping UUN, and managing and disseminating geospatial information. In having more precise location of UUN, the impact for the society may be noticeable by possibly reducing the number of damages during ground disturbances, increasing the security for heavy equipment operators and citizens, lowering the disruption of essential services, and as proposing more efficient usage of land. Thus, unanticipated costs for repairing utilities or lessening risks of services’ interruption due to trenching hazards can be also avoided. Finally, the outcomes of this research project may encourage the creation of a new market for
geospatial technology industry since this segment of the industry is currently lacking businesses involving GPR handling and data processing. This projects’ ambition is also to expand the knowledge base in both geomatics and geophysics by promoting an integrated and interoperable WebGIS-enabled solutions.
An important point to be made about this research and its scope is that the accuracy of GPR instruments and the performance characteristics of GPR such as signal quality or detection range, which vary in many ways as soil condition, conductivity property, kind of utilities, etc., are not addressed in this thesis. The proposal is focusing on adding GIS functionalities and spatial data integration procedure during the GPR investigation.
1.5 Methodology
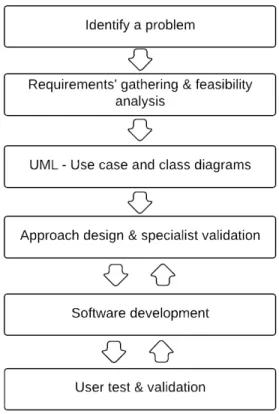
As shown in Figure 1.7, the project follows an engineering approach from the identification of problems met by the GPR users to test and validation of the solution. A literature review has been also performed to review the current GPR survey solutions, best practices, and existing technology. Specific requirements have been assessed and validated in a series of interviews with companies offering GPR service as well as operators. A conceptual model has been created through the use of Unified Modelling Language (UML) case diagrams, with a data model integrating the necessities of the approach. Then, a GPR deployment methodology has been defined and validated again with users. With the conceptual modelling and requirements in hands, the MVP has been developed using a software development methodology and tested with two different categories of users.
Figure 1.7: Flow diagram of the engineering approach used in the research project presented herein.
Along the descriptions of the sub-items of this methodology, some parts are described with more relevant context in the two published articles presented in Chapters 3 and 4.
1.5.1 Requirements’ gathering and feasibility analysis
The requirements gathering for the project is based on X pillars. Initially, a review of literature to analyze the existing technologies and trends for GPR data visualization with GIS is performed. In a second stage, with an existing experience developed by the research team, a few difficulties were acknowledged. Once these difficulties were formed, an analysis with GPR users was carried out as a way of comparing if the difficulties found by the research team in previous experiences are applicable to GPR professionals in different sectors (industry, research, etc.). As a result, with a list of problems related to GPR surveys, users’ needs are compared to what is currently offered by GPR manufacturers, 3rd party independent software producers, and open-source project, in order to evaluate the missing points. Therefrom, in further talks with GPR users, a list of requirements is defined along with proposed practices and software features as feasible solutions. Hence, this research project aims to actively pursue new solutions to supply the GPR community with new ideas and ways of joining aspects from both domains (geophysics and geomatics).
1.5.2 Use case and class data modelling
The first goal related to the software’s conceptual design and data model’s definition is to perform a data modelling using a UML taking into account a large literature review done on the best practices in GPR data acquisition, and interviews with GPR operators. UML is the widest utilized standardized modelling language, which consists of a set of diagrams types to specify, build, view, and document software. The guideline for acquisition planning is then translated to UML diagram type called use case diagrams, which stands as an illustration of the users, actions, and the interaction between them on the system. With a conceptual design capable of attending the highlighted hypothesis formulated, a database design, which integrates GPR data, survey-relevant data, and the semantically-rich standard 3D model of cities and urban utilities, is presented. This data model has to comply with existing standardized data models that integrate 3D objects from an urban environment such as pipes and cables as well as other objects that may be relevant during a survey.
1.5.3 Approach design and specialist validation
A GPR deployment approach defines a practical way of executing GPR surveys (following a guideline) and using at the same time the module developed herein as a supporting tool. The definition of this approach relates to when users prefer to use given features for targeting results. During the approach design, the main steps of a GPR survey are identified and, within each one, which tasks could be more suitably carried out by the GPR operators. This approach definition does not try to limit what GPR operators have to do in which of the steps, but rather to formalize a way of conducting a GPR survey with the developed WebGIS and how each one of the proposed features is planned to be used within the approach once they are conceived.
1.5.4 Software development
The software development methodology which will be used to approach this problem is the Extreme Programming method (XP method)8, which is part of an umbrella term for software development named Agile Methodology9. Due to the high importance this project gives to user’s experience and needs fulfillment, the XP method has been chosen by its elevated demand of interaction between the end-users of the project and the
approach to solving complex problems of user necessities by requiring small teams to have excellent communication skills to understand users’ issues.
The development is based on user stories, which are a short description of an action that users are able of taking in the software. It represents the action taken by a user who envisions to have a given result in the software. User stories are strongly correlated to the use case diagram, since may represent a direct translation of use cases (one user story being one use case), or they can be the breakdown of a use case, representing more feasible and detailed tasks for the developers (See next chapter). For this project, user stories are the direct translation of the use case diagrams. For example, a user story is “Visualize 2D GPR data” and it implies that a feature has to contain end-to-end functions for users to perform this action in the system.
Apart from the approach used by the software development itself, GVX-GPR is mostly based on the current technology which GVX was built with (See next chapter). Even though constraints have not been imposed, the future utilisation of the software within the platform would be extremely facilitated if the same tools and frameworks are used. Thus, the WebGIS has been inherited most of the existing tools and functionalities in GVX, at the same time that requirement-specific tools have been added as needed.
1.5.5 User test and validation
This phase validates user requirements for qualitative criteria such as usefulness and friendliness to newcomers in the GPR domain. At the same time, a measurable approach such as efficiency of time and resources and effectiveness (e.g. if the number improvements or the time saved while executing determined tasks such as preparation, execution, treatment, and delivery) has been developed according to the user perception. This distinction is a key and central concept in this research project. During the development of the tests, no quantifiable approach is conducted such as how many features have been or not found, but rather a quantifiable change on the perception of GPR user’s (e.g. user A concludes that the impact of feature B decreases time of process X in approximately Y%). Due to time constraints, software development constraints, difference in complexity of different sites (for unbiased analysis), and elaborateness of survey planning, it is believed to be the most feasible approach for this research project. In order to do that, user feedback and the judgement of the research team are significant parts of the evaluation. This approach is very common in the technological entrepreneurship environment, where ideas need to be iteratively improved in order to rapidly acknowledge and respond to real users’ needs.
Two study cases have been selected for this research project. Due to the complexity of interpreting geophysical data collected by GPR, the first set of GPR operators are non-specialists using the equipment with minimal or
no training. Even though a professional locator knowing how to identify underground features, the use of a GPR does not seem to be obvious for the majority of those who operate it. In previous observations, the research team has witnessed professional land surveyors not able to set up the equipment properly, even using configurations not related directly to the geophysical properties of the surveyed site. Thus, such observations lead to conclude that non-specialists are one of the main targets of this research, taking into consideration that any facilitation offered during their handling of the equipment would be of great benefit.
Subsequently, the platform has been tested with professionals who have an in-depth knowledge of the technology and geophysical principles applied by a GPR. The purpose of this case study with professional users is to verify if the toilsome process of interpreting complex GPR data could be simplified and make the delivery process more efficient. The research team has access to two GPR instruments to perform experiments while Geovoxel Brazil possesses GPR instruments which have been used for the field tests. The two selected study sites are located in Canada and Brazil, with the view of expanding the reach of the research and exploring further variables that may affect the tests. It is believed that cross-continental tests could base the research project on more sound validation.
1.6 Expected results
The expected results of the research project can be summarized as five items. The first contribution can be seen as a map-based approach for GPR practitioners. This scientific project not only envisions to develop new tangible technologies but also a reproducible approach for newcomers, experts, and companies, to organize and understand the execution of a GPR survey. This approach suggests survey phases and sub-steps which are based for the integration between GPR instruments and map-based systems. Also considered as an expected result and tightly coupled with the approach’s development are the user experiments. At the end of this research, a set of features is tested and validated with users, which tells whether the approach is contributes positively for GPR survey. Moreover, it shall be able to assert which geographical features are missing and what are their
Thirdly, this research scientifically initiates discussion and raise awareness for a linger development of GPR technologies regarding geospatial features through extensive analysis and diversified user testing with two scientific papers presented in chapters 3 and 4. These papers formalize not only the approach but an initial analysis of user needs by proposing new visions towards the promising future of GPR.
The last and more specific category of expected results list are:
• A point-by-point analysis of GPR software and interfaces currently commercialized; • A broad analysis of the current practices applied to GPR;
• An expansive outline of user needs;
• A representative number of market assessments regarding GPR services and products;
1.7 Manuscript structure
It is important to understand that this M.Sc. thesis is organized following the structure of a dissertation by articles’ insertion as proposed by Université Laval’s Faculté de foresterie, de géographie et de géomatique. Two main articles in Chapters 3 and 4 are the core scientific values added by this research project. Initially, a context is introduced along with the problematics, objectives, and methodology.
Chapter 2 - "Modelling and Software Design" presents the conceptual modelling of the WebGIS, starting by the requirements’ gathering and user needs. Then, the UML diagrams (class and use case) are shown and explained. Finally, it concludes with a technology overview and architecture of the system.
In Chapters 3 and 4 which respectively correspond to papers 1 and 2, experiments performed with non-specialist and specialist GPR users respectively are presented and discussed. Both chapters count on forewords describing the publication details, context, and purpose of the publication (e.g. where it was published, why, the intent for that scientific community). These chapters have an introduction, problematics, methodology, results, conclusions, and discussions self-contained.
Chapter 5 - "Results and Discussions" expands on the results acquired on both publications for discussion purpose of not only formal questionnaires applied but informal talks recorded during the experiments, which could not be fully introduced in the articles due to size constraints.
Finally, in Chapter 6 - "Conclusions and Recommendations", the achievement of the global objectives, presented in first chapter’s, are discussed with the global comprehension and insights obtained during this research project, along with next steps and recommendations.
Chapter 2 - Modelling and Software Design
The current chapter, Modelling and Software Design, presents the requirements’ gathering, the conceptual modelling, and the system architecture and organization. Section 2.1 cover the user’s needs on which the approach and development is based. Section 2.2, introduces use case diagrams which depict all the high-level actions taken by users on the system, also featuring the actors involved during a GPR survey. The last section, 2.3, shows the main components and technologies of the WebGIS architecture of GVX-GPR in a high-level overview (due to open access due to confidentiality and copyright).
2.1 User Requirements
In order to address the issues and problematics previously discussed, user requirements are defined. This is dictated not only by what appears appealing in terms of technology, but taking into account the research team’s own experience with handling GPR as well as the experience of GPR professionals. The requirements obtained are presented in the next items as user requirements for the WebGIS interface.
The core requirement observed during these users’ requirement assessment can be highlighted as the need that GPR software has of geospatial features. Due to the mobility needs that GPR operators have when deploying GPR surveys, proposing a WebGIS interface, which counts on remote access to resources at the same time offering more handleability when operating another equipment, seems to be consistent. According to the way that a GPR survey has been perceived by the research team based on literature review and multiple user discussions, GPR practitioners shall be able to manipulate and access map resources before, after, and, exceptionally, during the execution of a survey. Accessing map resources not only mean being able to view open maps, at any given moment, but also to have in hand a unified view of the information belonging to the survey’s area. These map resources can range from open mapping services, proprietary information (e.g. A CAD plan of a private building), cadastral databases (e.g. parcels), etc. This information may be already contained in the system (e.g. having OpenStreeMap road maps as a default layer) at the same time that GPR operators and Geophysicists must be able of uploading data of known formats by the industry. This requirement has a high impact on how the data modelling of this software has been designed. An example is that by having compliant databases, users can more readily plug in new resources and outer databases, increasing the amount of survey-relevant data during a data acquisition.
Apart from only visualizing information on the map, all types of actors (GPR practitioners, geophysicists, engineers, notaries) have the need to generate their own map resources. According to all the professionals from the GPR domain interviewed during the research project, most of what is registered during a survey end up to
being free hand map sketches and pictures as reference points of the survey. Thus, users should have the ability of adding drawing, georeferencing objects, including GPR data, into the WebGIS interface.
Lastly, this approach is centered on unifying the two information resources in question, maps and GPR data. Thus, users shall be capable of handling GPR data in a geographic-coordinate-aware environment. After the survey and data processing, ’the software shall offer visualization of radargrams, 3D cubes (3D environment), and slices. Thus to the limitations and scope of this research, 3D cubes are acknowledged as part of user needs but not yet accounted as feature to be develop in this research project. Users shall therefore visualize radargrams and slices, and promptly connect them to the map, facilitating the spatial reference when looking at the information and assessing where the survey is located on the map.
2.2 Data Modelling
In order for data to be available for a larger community of users, usable across multiple platforms, and in well-known formats, this approach proposes the usage of a standard data model. The data is stored in a compliant database to a known standard, called CityGML (Kolbe et al., 2005). CityGML contemplates not only the data organization but the integration of available data provided by customers and/or open resources. Even though other standards exist (as of November 2018), at the moment of the research project scope’s definition, CityGML has been judged to be a pertinent choice for the scope of the project due to multiple reasons. CityGML was selected due to not many standards propose a comprehensive and semantics-rich description of underground infrastructure as CityGML proposes. As an example, at the beginning of the research, when InfraGML was non-official but yet and ongoing proposition for OGC, two of the main existing and adopted standards were CityGML and INSPIRE. CityGML is an existing and well-accepted standard in order to explore existing data that would be compatible and can be aggregated to GVX-GPR. Furthermore, CityGML is a known standard and part of the application schema proposed by OGC and ISO TC211, which provides an interoperable representation of 3D cities models. It comprises multiple aspects of these models including topology, geometry, and semantics, and respective level of details for given models. As a result, CityGML offers a standardized representation and
In order to map infrastructures on the system, a class diagram of the proposed WebGIS interface has been produced to illustrate the schematics of the application. The core diagram of the application is divided into two separate parts. One consists of the CityGML-derived data standard, which role is to store UUN’s and other city objects. The second portion is responsible for the management and storage of GPR data, which is not proposed by any standard to the date. These diagrams help the design and comprehension of the software by providing a high-level yet simple view of the main entities which such a system requires.
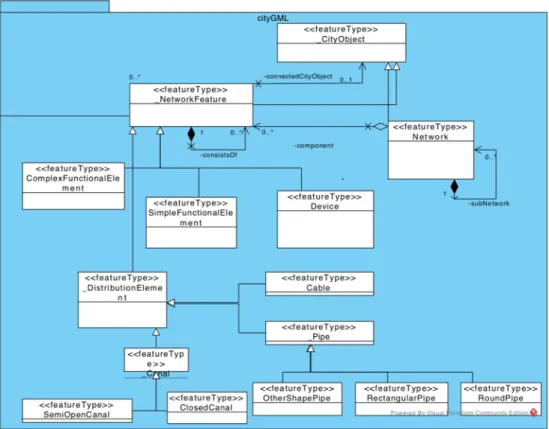
The data model inherited from CityGML Utility Network ADE (Becker et al., 2012) is presented in Figure 2.1. CityGML proposes an abstract entity called _CityObjects, which is a generic object belonging to a city model, but also a linkage to other CityGML datasets. For example, in the proposed model, a pipe is a specialization of a _CityObject, but in other CityGML datasets, it may be a house, a building, or a street. As mentioned, this ADE (Utility Network ADE) is centralized in a specialization of _CityObjects called _NetworkFeature (any composing element of UUN). This class is an abstract object to other four network object types that represent sub-types of components in underground utility networks:
• Device – Abstract class to represent the generalization of storage devices, measurement devices, controller devices, tech devices, and any other existing device (e.g. tank, switch, valve);
• ComplexFunctionalElement – Structures containing devices (e.g. stations, factories, treatment plants, pumping stations);
• SimpleFunctionalElement – Structures that do not contain devices (e.g. manhole, voltage regulator, inverted syphon);