HAL Id: tel-01859945
https://pastel.archives-ouvertes.fr/tel-01859945
Submitted on 22 Aug 2018
HAL is a multi-disciplinary open access
archive for the deposit and dissemination of sci-entific research documents, whether they are pub-lished or not. The documents may come from teaching and research institutions in France or abroad, or from public or private research centers.
L’archive ouverte pluridisciplinaire HAL, est destinée au dépôt et à la diffusion de documents scientifiques de niveau recherche, publiés ou non, émanant des établissements d’enseignement et de recherche français ou étrangers, des laboratoires publics ou privés.
Essays in Empirical Corporate Finance
Thorsten Martin
To cite this version:
Thorsten Martin. Essays in Empirical Corporate Finance. Business administration. Université Paris-Saclay, 2018. English. �NNT : 2018SACLH006�. �tel-01859945�
.4 .6 .8 1 1 .2 1 .4 1990 1991 1992 1993 1994 1995 1996 1997 1998 1999 2000 2001 2002 2003 Year
− 1 − .5 0 .5 −60 −50 −40 −30 −20 −10 0 10 20 30 40 50 60 Month
.0 5 .1 .1 5 .2 .2 5 −20 −16 −12 −8 −4 0 4 8 12 16 20 Quarter
− .4 − .2 0 .2 .4 −8 −7 −6 −5 −4 −3 −2 −1 0 +1 +2 +3 +4 +5 +6 +7 >=8 Month − .1 5 − .1 − .0 5 0 .0 5 .1 −8 −7 −6 −5 −4 −3 −2 −1 0 +1 +2 +3 +4 +5 +6 +7 >=8 Quarter
− .0 4 − .0 2 0 .0 2 .0 4 2004 2005 2006 2007 2008 2009 2010 2011 Year − .1 − .0 5 0 .0 5 .1 −8 −7 −6 −5 −4 −3 −2 −1 0 +1 +2 +3 +4 +5 +6 +7 >=8 Quarter
− .3 − .2 − .1 0 .1 .2 2004 2005 2006 2007 2008 2009 2011 2012 2013 Year − .2 − .1 0 .1 .2 .3 2004 2005 2006 2007 2008 2009 2010 2011 Year
Managerial Ownership Changes and Mutual Fund
Performance
Thorsten Martin, and Florian Sonnenburg*
First Draft: March 2015 This Draft: August 2015
ABSTRACT
We study the dynamics of fund manager ownership for a sample of U.S. equity mutual funds from 2005 to 2011. We find that ownership changes positively predict changes in future risk-adjusted fund performance. A one-standard-deviation increase in ownership predicts a 1.6 percent increase in alpha in the following year. Fund managers who are required to increase their ownership by fund family policy show the strongest increase in alpha. They do so by increasing their trading activity in line with the view that higher ownership aligns interests of managers with those of shareholders and induces higher effort.
JEL classification: G11, G14, G20, G23
Keywords: Mutual Funds, Fund Manager Ownership Changes, Fund Performance Predictability, Incentive Alignment, Superior Information
*Thorsten Martin is from the Department of Finance, HEC Paris, France. Email: thorsten.martin@hec.edu. Florian Sonnenburg is from the Department of Finance and Centre for Financial Research (CFR), University of Cologne, Germany. Email: sonnenburg@wiso.uni-koeln.de.
We thank Laurent Calvet, Jean Eduoard Colliard, Thierry Foucault, Johan Hombert, Stefan Jaspersen, Alexander Kempf, Hugues Langlois, Peter Limbach, Stefano Lovo, Alina Rosu, Clemens Otto, Jacques Olivier, Alexei Ovtchinnikov, Daniel Schmidt, Paul Tetlock, David Thesmar and participants at the CFR seminar, University of Cologne for comments on an earlier draft of this paper.
1
1 Introduction
Since March 2005, mutual funds have to report fund managers ownership within the Statement of Additional Information (SAI) using broad ownership ranges. By using one year of ownership data, Khorana, Servaes, and Wedge (2007) and Evans (2008) show that the level of ownership predicts future risk-adjusted performance. Since then, more and more fund investors are paying attention to manager ownership (see, e.g., Ma and Tang (2014)) and some mutual fund families adopted policies which require their managers to hold ownership
in the funds they manage.1 This raises the question if the increased attention to managerial
ownership and the implementation of ownership requirements by fund families is warranted. Does managerial ownership provide valuable information about future fund performance or is the observed cross-sectional correlation driven by unobserved fund characteristics? Does ownership align incentives and can ownership requirements therefore be used to increase performance? Or do managers have superior information about future fund performance and choose to invest in funds which they know will perform better in the future? Given the nature of their cross-sectional data, these early studies are unable to answer these questions.
We fill this gap in the literature by examining the relationship between ownership changes and changes in future risk-adjusted fund performance using a hand-collected panel data set on mutual fund manager ownership. Examining ownership changes has two advantages in our setting. First, we are able to eliminate any heterogeneity bias stemming from time-invariant unobserved fund characteristics. For instance, funds differ in the degree of managerial discretion in making investment decisions. This managerial discretion may lead to higher fund returns on average, but exposes the fund investor to greater risk of moral
1 in The Wall Street Journal MarketWatch (26/07/2006) and
Bloomberg BusinessWeek (14/01/2010). Both articles report that some mutual fund companies have started requiring their managers to invest in the funds they
2
hazard (see, e.g., Chen, Goldstein, and Jiang (2008)) and thus increases the optimal level of
ownership.2 Therefore, unobservable differences in managerial discretion may bias the
ownership coefficient upwards. If managerial discretion is relatively stable within funds over time, we are able to eliminate this bias by using a first-difference approach. Moreover, we control for changes in a host of fund, board and family characteristics as well as predictors of fund performance which have been recently proposed by the literature.
Second, the cross-sectional studies are unable to examine whether the positive relationship between ownership levels and performance reflects fund managers superior information about future fund performance or better alignment of fund managers and shareholders interests. We use changes in ownership mandated by family policy to disentangle the superior information and the incentive alignment hypotheses. The idea is that family mandated changes unlikely reflect a fund manager s information about future fund performance. If the positive relationship between manager ownership and fund performance reflects fund manager s superior information about future fund performance, we do not expect that ownership changes which are mandated by the fund family increase fund performance. If on the other hand manager ownership aligns the fund manager s interests with those of shareholders, we expect ownership changes to have a causal effect on performance even if the change is required by the fund family.
Using a hand-collected dataset on managerial ownership for a sample of single managed U.S. domestic equity mutual funds over the period from 2005 to 2011, we find that ownership changes are positively related to changes in future risk-adjusted fund performance no matter whether we measure performance as Fama and French (1993) three-factor alpha,
2 For example, Chen, Desai, and Krishnamurthy (2013) show that short-selling mutual funds outperform benchmarks by 1.5% per year. Consider a fund manager running two identical funds, but one is short-selling restricted and the other is not. From an optimal contracting perspective the manager should own more in the unrestricted fund as his ability to take actions against the interests of shareholders is greater. If this is the case, this creates a positive correlation between ownership and performance in the cross-section if short-selling restrictions are not controlled for.
3
Carhart (1997) four-factor alpha, or Pástor and Stambaugh (2003) five-factor alpha. The relation between increases in ownership and increases in future risk-adjusted fund performance is also economically significant: a one-standard-deviation increase in ownership leads to an increase in alpha between 1.1 percentage points for the Carhart (1997) four-factor alpha and 1.6 percentage points for the Pástor and Stambaugh (2003) five-factor alpha. This result stands several robustness tests regarding the construction of our ownership measure.
Next, we control for other predictors of fund performance. Recent studies show that the level of ownership (Khorana, Servaes, and Wedge (2007) and Evans (2008)), the industry concentration (Kacperczyk, Sialm, and Zheng (2005)), return gap (Kacperczyk, Sialm, and Zheng (2008)), active share (Cremers and Petajisto (2009), and Petajisto (2013)) and a fund s
R2 with respect to its benchmark (Amihud and Goyenko (2013)) predict future fund
performance. We find that ownership changes are highly significant predictors of changes in future risk-adjusted fund performance even after controlling for the lagged level of ownership
as well as changes in industry concentration, active share, return gap and R2. A
one-standard-deviation increase in ownership predicts an increase in risk-adjusted performance of up to 1.6 percentage points.
We then analyze whether the documented positive relation between ownership changes and changes in risk-adjusted performance is due to incentive alignment or due to superior information. To disentangle these two hypotheses, we use the adoption of fund family policies requiring managers to hold some ownership in all funds they manage. We proxy for such a policy by using the ownership information we observe. If in a given year and fund family at least one fund has zero ownership, we define that the fund family has no strict ownership requirement in place. Contrary, if all funds within a given fund family have ownership greater than zero in a given year, we define that the family has a strict ownership requirement in place.
4
We find that future risk-adjusted performance increases even stronger with ownership when managers increase their ownership simultaneously to the adoption of a new family policy which requires managers to hold some ownership in their funds. A one-standard-deviation ownership increase simultaneous to the adoption of an ownership requirement by the family increases alpha between 0.4 and 0.5 percentage points more than other ownership increases. As these changes are most likely not driven by fund managers superior information about future fund performance, these results support the view that ownership aligns interests of fund manager s and shareholders and causally affects fund performance. One possibility is that mandatory ownership increases induce the manager to exert more effort to seek out profitable investment opportunities. In line with this view, we find that mandatory ownership changes strongly predict future changes in trading activity. Managers who increase ownership simultaneously to the adoption of a family wide ownership requirement increase their active share, turnover, unobserved actions and their equity holdings and decrease their cash holdings.
The paper contributes to three main strands of the literature. First, our paper relates to the growing literature on
governance is significantly improved if more independent directors are on the board or if independent directors have a higher ownership in the fund and thus a higher motivation to effectively monitor the fund (see, e.g., Tufano and Sevick (1997), Ferris and Yan (2007), Khorana, Tufano, and Wedge (2007), Cremers, et al. (2009), and Ding and Wermers (2012). More related to our study, Khorana, Servaes, and Wedge (2007) and Evans (2008) show in their cross-sectional analysis that managers with higher levels of ownership have better future fund performance. Our study contributes to this literature in two ways. To begin with, we are the first who use panel data on managerial ownership. Therefore we are able to rule out that any unobservable fund, manager or family fixed effects lead to a spurious correlation between ownership and performance. Our second contribution to this literature is that we are able to
5
disentangle the superior information and incentive alignment hypotheses and we find support for the latter.
Second, our paper is related to a growing body of literature that analyzes managerial incentives in the mutual fund industry. Several studies look at the relationship between fund managers incentives and their risk-taking behavior arising from the convex flow-performance relation (e.g., Brown, Harlow, and Starks (1996), Chevalier and Ellison (1997), Koski and Pontiff (1999), Kempf and Ruenzi (2008) , Kempf, Ruenzi, and Thiele (2009), and Schwarz (2011)). Another strand of this literature analyzes the link between advisory fee contracts and performance (e.g., Elton, Gruber, and Blake (2003), Dass, Massa, and Patgiri (2008), and Massa and Patgiri (2009)). In a recent paper, Ma, Tang, and Gómez (2015) show that fund managers with explicit performance-based incentives perform better. We complement this literature by showing that fund manager ownership can act as an explicit
incentive tool to align manager and shareholders .
Third, our paper relates to the vast literature of managerial ownership in corporations. We find that ownership changes which are mandated by the fund family increase fund performance and therefore contribute to the controversy if manager ownership can be used to change firm value (see, e.g. Himmelberg, Hubbard, and Palia (1999), Zhou (2001) , and Fahlenbrach and Stulz (2009)).
The rest of the paper proceeds as follows. Section 2 describes the data and compares our sample to the CRSP universe of mutual funds. In Section 3, we analyze the relation between ownership changes and changes in future risk-adjusted performance. In section 4, we examine if the results are robust to controlling for changes in other predictors of fund performance. In section 5 we explore how ownership changes due to fund family policy rather than personal portfolio decisions affect performance and Section 6 concludes.
6
2 Data and summary statistics
For our empirical analysis, we use data from three sources: (1) the Center for Research
in Security Prices (CSRP) Survivor-Bias Free US Mutual Fund Database3, (2) Thomson
Financial Mutual Fund Holdings Database and (3) mutual funds Statement of Additional Information (SAI) filed with the SEC.
From the CRSP Survivor-Bias Free Mutual Fund Database we gather information on mutual funds monthly returns, total net assets, and other fund characteristics. We focus on single actively managed, domestic equity funds with no manager replacements during our sample period and exclude bond funds and international funds as well as index funds. We use investment objective. We aggregate the Lipper segments into seven broad categories: Aggressive Growth, Growth and Income, Income, Growth, Sector Funds, Utility Funds, and Mid-Cap Funds. Many funds offer multiple share classes which are listed as separate entries in the CRSP database. As these share classes are backed up by the same portfolio, we aggregate all share classes at the fund level to avoid multiple counting.
We match the CRSP funds to the Thomson Financial Mutual Fund Holdings Database using MFLINKS tables. Our last data source is the mutual funds SAI (in SEC filings 485APOS and 485BPOS), which are Part B of the mutual fund s prospectus. The data from the SEC filings 485APOS and 485BPOS can be downloaded in text files from SEC EDGAR.
that the fund name often differs from the filer name under which a mutual fund discloses its filings with the SEC or that the filings 485APOS and 485BPOS may contain SAI from multiple funds. The SAI reports detailed information on each portfolio manager s ownership in the fund. The ownership is reported in seven ranges: None; $1 $10,000; $10,001 $50,000;
3 Source: CRSP, Center for Research in Security Prices. Graduate School of Business, The University of Chicago. Used with permission. All rights reserved.
7
$50,001 $100,000, $100,001 $500,000, $500,001 $1,000,000, or over $1,000,000. We convert these ownership ranges into dollar amounts using the bottom of each range.
We build two ownership measures: (1) We construct a yearly percentage ownership measure by dividing the converted dollar amount by a fund's year end total net assets (TNA) as suggested by the existing literature studying the impact of ownership on firm value going back to Jensen and Meckling (1976). (2) We define ownership changes as the difference between fund managers current and lagged percentage ownership. To control for commonly used board characteristics, we further collect the following board information from the SEC files: Name of director, and whether the director is interested or independent as defined in the Investment Company Act (ICA). Our data cover 2,196 fund-year observations over the period 2005-2011.
Table 1 compares the summary statistics of our sample to the CRSP mutual fund universe with respect to the
(Family TNA) flows, the turnover ratio of the fund, and the Pástor and Stambaugh
(2003) five-factor alpha. Table 1 also provides summary statistics on the board and ownership measures for our sample of funds, namely the
directors on the board, the level of ownership and the change in ownership. Please insert TABLE 1 approximately here
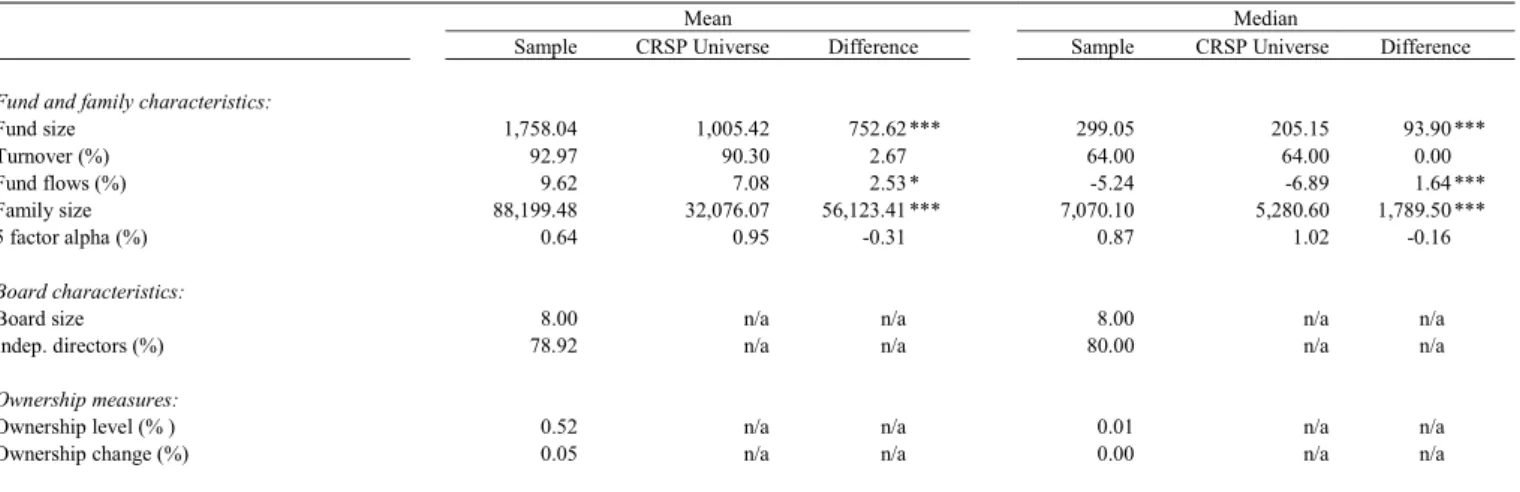
The sample comparison shows that our sample funds are larger and belong to larger families. They also have slightly higher turnover and attract more flows. These differences are likely due to our sample selection criteria as we exclude team-managed funds as well as funds with manager changes to prevent that group dynamics or manager replacements drive the results. Further, as we are interested in manager ownership changes, we exclude funds without at least two consecutive years in the sample. The average fund in our sample has
8
managerial ownership of 0.52 percent of the fund's TNA and changes it on average by 0.05 percent per year.
3 Ownership changes and changes in future fund performance
In this section we analyze the relation between ownership changes and changes in future risk-adjusted performance (Section 3.1). We check the robustness of our results in Section 3.2.
3.1 Main results
To examine the relation between ownership changes and changes in future risk-adjusted performance, we use three different performance measures: (1) Fama and French (1993) three-factor alpha, (2) Carhart (1997) four-factor alpha, and (3) Pástor and Stambaugh (2003) five-factor alpha. The alpha measures are determined based on a yearly estimation of the respective factor models. We calculate the performance measures based on gross returns as gross returns better reflect the quality of the investment decisions of the fund manager. To
onthly net return observations.
We conduct first-difference regressions and use the change in the annualized
performance measures from t-1 to t as dependent variable
Performance
in theseregressions:
i,t i,t-1
1 i,t-1 2 i,t-1 3 i,t-1 1 i,t-1 2
+ dSize ) +
+ BoardSize + IndepDirectors + i,t-1 i,t
(1)
Our main independent variable is the change in managerial ownership form year t-2 to t-1
Ownership
. We add further variables to control for changes in fund, fund family, and9
governance characteristics. All of these changes are also measured from t-2 to t-1. At the fund
level, we add changes in
FundSize
, andturnover ratio
Turnover
as control variables to the regressions. At the fund family level,we control for changes in the logarithm of the size
FamilySize
. Thegovernance controls include board size
BoardSize
as well aschanges in the fraction of independent directors on the board
IndepDirectors
. To controlfor any unobservable time or segment effects that could equally affect all funds in a given year or a particular market segment, respectively, we also include time and segment fixed effects in all regressions. We cluster the standard errors at the fund level. Table 2 presents the results.
Please insert TABLE 2 approximately here
The results clearly show that ownership changes are positively related to changes in future risk-adjusted performance. The coefficient of ownership changes is positive and significant at the 1%-level in all specifications. The effect is not only statistically but also economically significant: For example, when Pástor and Stambaugh (2003) five-factor alpha is used as performance measure, an increase in ownership by one-standard-deviation (0.02935) predicts a 1.6 percent higher alpha (= 0.02935 × 0.5311), after taking all control variables into account .The other control variables have no notable consistent impact on future risk-adjusted performance.
Overall, the results from this section provide evidence that the observed cross-sectional correlation between ownership and future fund performance is not stemming from a heterogeneity bias due to unobserved time-invariant fund characteristics.
10
3.2 Robustness
In this section we conduct additional tests to check that the positive effect of ownership changes on changes in future risk-adjusted performance is robust. The results from these tests are reported in Table 3.
Please insert TABLE 3 approximately here
Thus far, we have converted the bottom of each reported dollar range into dollar amounts. We now convert the reported dollar ranges into dollar amounts by assuming that the midpoint of the reported interval is always invested, except for ownership levels above $1 million, where we employ the bottom of the range. The results shown in Panel A remain similar: Ownership changes are positively associated with changes in future risk-adjusted performance.
In Panel B, we conduct a test to see whether our documented effect is driven by changes in the denominator of our ownership change measure. We replace our ownership change measure by a placebo ownership change measure. The nominator of this placebo ownership change measure takes on the mean dollar ownership in the sample for all funds and years whereas the denominator remains the fund size. Thus, all variation in this ownership change measure stems from variation in the denominator. We employ this measure in our first-difference regressions and do not find a significant effect on changes in future risk-adjusted performance. This implies that the positive relation between ownership changes and changes in future risk-adjusted performance is not simply driven by changes in the denominator of the ownership change measure.
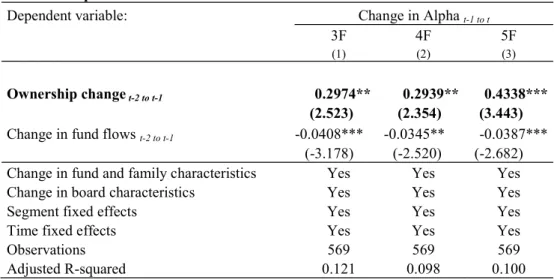
In Panel C, we additionally control for changes in fund flows. Although we control for changes in fund size, one might argue that the denominator of our ownership change measure is driven by changes in fund flows. Panel C shows that our main results do not change when
11
controlling for changes in fund flows: Ownership changes are positively related to changes in risk-adjusted performance even after controlling for fund flows.
Finally, we split our sample into small and large funds using the median fund size in the sample as cut-off. As we are using changes in percentage ownership as our main independent variable, the results could be driven by small funds as a given dollar ownership change leads to a larger percentage ownership change for small funds. The results from Panel D show that the observed effect of ownership on performance is not driven by small funds. Ownership changes predict future changes in performance for both small and large funds. The economic magnitude of the effect is even bigger for large funds. Given that the standard deviation of ownership changes for large funds (small funds) is 0.00053 (0.03913), a one-standard-deviation increase in percentage ownership of a large fund leads to an increase in risk-adjusted performance up to 2.0 percentage points (= 0.00053 × 37.156), compared to an increase in risk-adjusted performance up to 1.5 percentage points (= 0.03913 × 0.3867) for small funds.
Taken together, the findings in this section show that the baseline result of a positive impact of ownership changes on changes in risk-adjusted performance is robust to (1) using the midrange of the reported ownership range, (2) is not driven by changes in the denominator of the ownership measure, (3) is not driven by changes in fund flows, and (4) is not solely driven by small funds.
4 Ownership changes and other predictors of future fund performance
Having identified a robust measure to predict changes in future risk-adjusted performance, we now examine whether our measure survives after controlling for other existing measures to predict future performance.
12
In this context, Khorana, Servaes, and Wedge (2007) and Evans (2008), both provide evidence that the level of ownership is positively associated with superior future performance. Besides that, a growing body of literature uses holdings data of mutual funds to create performance predictability measures. Kacperczyk, Sialm, and Zheng (2005) develop the industry concentration index (ICI) and show that a high industry concentration is positively associated with future fund performance. Kacperczyk, Sialm, and Zheng (2008) use the return
gap (RG) defined as the difference between the reported fund return and the return predicted
from the previously disclosed fund holdings to measure unobserved actions by mutual fund
managers. They find a positive correlation between the return gap (RG) and future fund performance. Cremers and Petajisto (2009) and Petajisto (2013) measure a fund s active share (AS) as the extent to which a manager deviates from her benchmark and find that active share positively predicts future fund performance. Finally, without using holdings data, Amihud and
Goyenko (2013) show that a fund s R2 with respect to its benchmark positively predicts
performance.
To test if changes in ownership survive as performance predictability measure, we now additionally control for the lagged level of ownership and changes in industry
concentration (ICI), return gap (RG), active share (AS) and R2 in our regressions.
To compute the industry concentration index (ICI), we first sort all stocks into ten industries following Kacperczyk, Sialm, and Zheng (2005) and then calculate the weight for a specific industry in a portfolio by summing up the portfolio weights of all stocks belonging to that industry. The sum of the squared industry weights (averaged across the quarters of a year) is then used as a measure of industry concentration.
To calculate the return gap, we follow Kacperczyk, Sialm, and Zheng (2008) by comparing the realized fund returns with holding-based fund returns. The latter is a
13
hypothetical portfolio that invests in the previously disclosed fund holdings. We then compound the monthly return gap observations to come up with a yearly measure.
We use the active share database of Cremers and Petajisto (2009) and Petajisto
(2013).4 The active share is calculated as the absolute difference between the portfolio weight
the stock universe and divided by two.
To compute the R² measure of Amihud and Goyenko (2013), we first run yearly regressions of fund s monthly excess returns on the Carhart (1997) four factors. We then obtain the fund s R² from these regressions.
We add these other performance predictors to our baseline regressions from Section 3.1. The control variables are the same as in (1). We again control for time and segment fixed effects in the regressions. Standard errors are clustered at the fund level. For the sake of brevity we report only the results for the changes in ownership as well as for the lagged level of ownership and the changes in the other performance predictors. Results are provided in Table 4.
Please insert TABLE 4 approximately here
The ownership change measure is positive and significant at the 1% level for the three-factor and five-three-factor alpha (and at the 5%-level for the four-three-factor alpha). The effect is also economically significant: After controlling for the alternative predictors of fund performance, we still find an economically meaningful effect of ownership changes on changes in future risk-adjusted performance. A one-standard-deviation increase in ownership leads to an increase in four-factor alpha of 0.9 percentage points (= 0.02935 × 0.3055) and an increase in five-factor alpha of 1.6 percentage points (= 0.02935 × 0.5323). Of the alternative predictors
14
only changes in return gap are significantly negatively related to changes in future fund performance. The standard deviation of return gap is 0.03906. Thus, the estimated slope of -0.5725 based on five-factor alpha implies that a one-standard-deviation increase in return gap translates to a decrease of 2.2 percentage points (= 0.03906 × -0.5725) in five-factor alpha.
Overall, the results from this section clearly show that ownership changes predict future risk-adjusted performance even after controlling for existing predictors of fund performance.
5 Changes in ownership induced by family policies
The results so far indicate that the cross-sectional correlation between managerial ownership and fund performance is not merely driven by unobserved time-invariant fund, manager or family characteristics. We now turn to the question whether the positive correlation is driven by incentive alignment or superior information. Under the superior information hypothesis managers increase their ownership in funds because they know these funds will perform better in the future. Under the incentive alignment hypothesis, managerial ownership aligns the manager s interests with those of fund shareholders leading to better investment decisions resulting in better performance.
We use the adoption of fund family policies requiring managers to hold some ownership in all funds they manage to disentangle the superior information hypothesis from the incentive alignment hypothesis. The idea is to capture ownership changes which are mandated by the fund family and thus do not reflect the manager s information. Under the superior information hypothesis, we expect that these mandatory ownership changes are not related to future changes in fund performance. Under the incentive alignment hypothesis however, ownership leads to aligned incentives regardless if the change in ownership is mandatory or voluntary. Therefore we expect mandatory and voluntary ownership changes to
15
be positively related to future changes in fund performance under the incentive alignment hypothesis.
We construct a dummy variable for fund family policy changes which takes on the value one if the fund family did not have an ownership requirement in place in the past year and has such a requirement in place this year, and zero otherwise. As we cannot directly observe if such a family policy is in place, we proxy for it by using the ownership information we observe. If in a given year and fund family at least one fund has zero ownership, we define that in this fund family and year no strict ownership requirement is in place. If on the other hand, in a given year and fund family all funds in the family have ownership greater than zero, we define that in this fund family and year a strict ownership requirement is in place. We then interact the fund family policy change dummy with the ownership change measure and run first-difference regressions using the change in the respective performance measure as dependent variable. Other control variables are the same as in (1). We again control for time and segment fixed effects in the regressions and cluster standard errors at the fund level. For the sake of brevity we report only the results for the ownership change measure, the family policy change dummy and the interaction between both. The results are shown in Table 5.
Please insert TABLE 5 approximately here
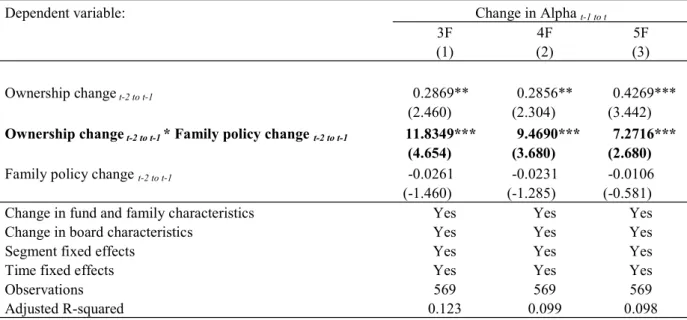
We find that both the change in the ownership measure as well as the interaction of this change with the fund family policy change dummy strongly predict future changes in risk-adjusted performance. Given that the standard deviation of ownership changes within the family policy change group is 0.00054 , a one-standard-deviation increase of funds where the family adopted an ownership requirement increases future alpha by 0.4 percentage points (= 0.00054 × 7.2716 (estimated slope for the five-factor alpha)) to 0.6 percentage points ((= 0.00054 × 11.8349 (estimated slope for the three-factor alpha)) more than for all other funds.
16
This leads to an overall effect of up to 1.6 percentage points based on five-factor alpha (= 0.02935 × 0.4269 + 0.00054 × 7.2716). These results support the incentive alignment hypothesis: Ownership has an even stronger effect on performance if the changes are mandated by the fund family.
Next we examine where this performance effect stems from. One possible explanation is that fund managers who are required by their fund family to start holding some ownership in the funds they manage subsequently exert more effort in seeking out profitable investment opportunities. If this is the case, we expect to observe increased activity by these fund managers. In Table 6 we employ the same setup as in Table 5, using changes in the fund s
active share, turnover, return gap, as well as cash and equity holdings as dependent variables.5
Please insert TABLE 6 approximately here
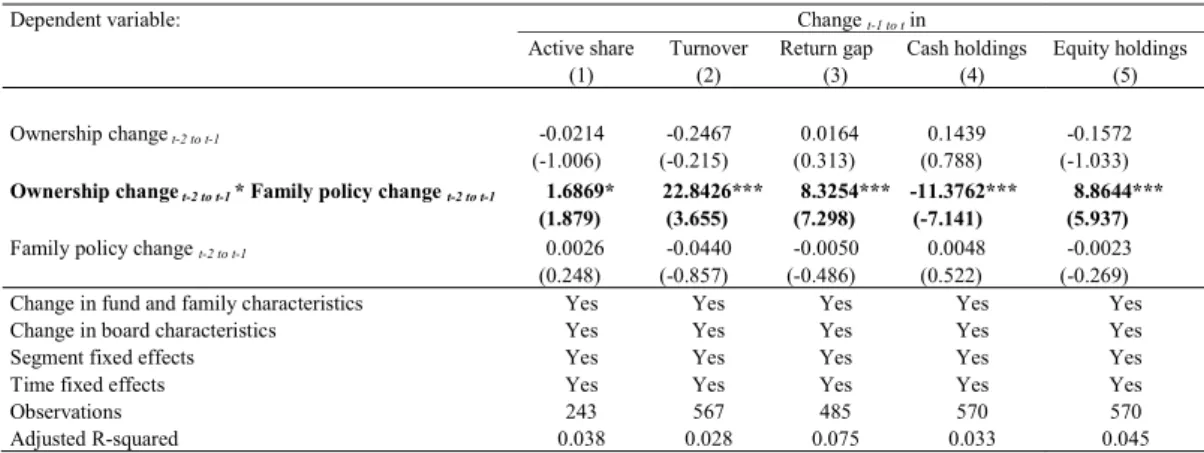
Table 6 shows that the interaction terms have the expected sign: A one standard deviation increase in percentage ownership concurrent to the adoption of an ownership requirement by the fund family increases active share by 0.09 percentage points (= 0.00054 × 1.6869), a fund s turnover by 1.23 percentage points (= 0.00054 × 22.8426), return gap by 0.45 percentage points (= 0.00054 × 8.3254) and equity holdings by 0.48 percentage points (= 0.00054 × 8.8644), whereas cash holdings decrease by 0.63 percentage points (= 0.00054 × -11.3762). The results reinforce the incentive alignment hypothesis: Ownership increases by funds when their families adopt ownership requirements significantly predict higher trading activity.
Taking all results of Section 5 together, we interpret them as supporting the view that managerial ownership aligns interests of managers with those of shareholders and induces managers to exert more effort.
17
6 Conclusion
In response to a number of scandals in the mutual fund industry, the Securities and Exchange Commission (SEC) adopted new disclosure requirements for mutual funds in 2004. Since March 2005, mutual fund managers are required to report their ownership in the funds they manage.
In contrast to earlier studies, we investigate the relationship between managerial ownership and fund performance dynamically. We find that managerial ownership changes are positively related to future changes in risk-adjusted fund performance. We show that this effect is robust to using the mid range instead of the minimum range of the reported dollar range and the results are not driven by changes in the denominator of our ownership measure or by small funds. We further show that our results hold even after controlling for the lagged level of ownership and changes in holdings-based predictors of future fund performance and a
fund s R2. Thus, the relationship between ownership changes and future risk-adjusted
performance is robust to controlling for existing predictability measures.
Using family ownership requirements, we disentangle the superior information and incentive alignment hypotheses: Contrary to the superior information hypothesis and in line with incentive alignment we find that ownership changes which are induced by family policies predict changes in future fund performance even better. Funds that are required to increase their ownership are associated with an increase in alpha by up to 1.6 percent per standard deviation of ownership increase. They do so by increasing their active share, turnover, unobserved actions, equity holdings and by decreasing their cash holdings.
Altogether, this study provides evidence that managerial ownership is an important tool to align manager interests with those of shareholders.
18
REFERENCES
Amihud, Yakov, and Ruslan Goyenko, 2013, Mutual Fund's R2 as Predictor of Performance, Review of Financial Studies 26, 667-694.
Bloomberg, BusinessWeek, 2010, Fund Managers: Betting Their Own Money.
Brown, Keith C., W. V. Harlow, and Laura T. Starks, 1996, Of Tournaments and Temptations: An Analysis of Managerial Incentives in the Mutual Fund Industry, Journal of Finance 51, 85 - 110.
Carhart, Mark M., 1997, On Persistence in Mutual Fund Performance, Journal of Finance 52, 57-82.
Chen, Honghui, Hemang Desai, and Srinivasan Krishnamurthy, 2013, A First Look at Mutual Funds That Use Short Sales, Journal of Financial And Quantitative Analysis 48, 761-787.
Chen, Qi, Itay Goldstein, and Wei Jiang, 2008, Directors' Ownership in the U.S. Mutual Fund Industry, Journal of Finance 63, 2629-2677.
Chevalier, Judith, and Glenn Ellison, 1997, Risk Taking by Mutual Funds as a Response to Incentives, Journal of Political Economy 105, 1167-1200.
Cremers, K. J. Martijn, and Antti Petajisto, 2009, How Active Is Your Fund Manager? A New Measure That Predicts Performance, Review of Financial Studies 22, 3329-3365. Cremers, Martijn, Joost Driessen, Pascal Maenhout, and David Weinbaum, 2009, Does Skin
in the Game Matter? Director Incentives and Governance in the Mutual Fund Industry, Journal of Financial And Quantitative Analysis 44, 1345-1373.
Dass, Nishant, Massimo Massa, and Rajdeep Patgiri, 2008, Mutual Funds and Bubbles: The Surprising Role of Contractual Incentives, Review of Financial Studies 21, 51-99. Ding, Bill, and Russ Wermers, 2012, Mutual Fund Performance and Governance Structure:
The Role of Portfolio Managers and Boards of Directors, Working Paper.
Elton, Edwin J., Martin J. Gruber, and Christopher R. Blake, 2003, Incentive Fees and Mutual Funds, Journal of Finance 58, 779-804.
Evans, Allison L., 2008, Portfolio Manager Ownership and Mutual Fund Performance, Financial Management 37, 513-534.
Fahlenbrach, Rüdiger, and René M. Stulz, 2009, Managerial Ownership Dynamics and Firm Value, Journal of Financial Economics 92, 342-361.
Fama, Eugene F., and Kenneth R. French, 1993, Common Risk Factors in the Returns on Stocks and Bonds, Journal of Financial Economics 33, 3-56.
Ferris, Stephen P., and Xuemin Yan, 2007, Do Independent Directors and Chairmen Really Matter? The Role of Boards of Directors in Mutual Fund Governance, Journal of Corporate Finance 13, 392-420.
Himmelberg, Charles P., Glenn R. Hubbard, and Darius Palia, 1999, Understanding the Determinants of Managerial Ownership and the Link Between Ownership and Performance, Journal of Financial Economics 53, 353-384.
Jensen, Michael C., and William H. Meckling, 1976, Theory of the Firm: Managerial Behavior, Agency Costs and Ownership Structure, Journal of Financial Economics 3, 305-360.
Kacperczyk, Marcin, Clemens Sialm, and Lu Zheng, 2005, On the Industry Concentration of Actively Managed Equity Mutual Funds, Journal of Finance 60, 1983-2011.
Kacperczyk, Marcin T., Clemens Sialm, and Lu Zheng, 2008, Unobserved Actions of Mutual Funds, Review of Financial Studies 21, 2379-2416.
Kempf, Alexander, and Stefan Ruenzi, 2008, Tournaments in Mutual-Fund Families, Review of Financial Studies 21, 1013-1036.
19
Kempf, Alexander, Stefan Ruenzi, and Tanja Thiele, 2009, Employment Risk, Compensation Incentives, and Managerial Risk Taking: Evidence from the Mutual Fund Industry, Journal of Financial Economics 92, 92-108.
Khorana, Ajay, Henri Servaes, and Lei Wedge, 2007, Portfolio Manager Ownership and Fund Performance, Journal of Financial Economics 85, 179-204.
Khorana, Ajay, Peter Tufano, and Lei Wedge, 2007, Board Structure, Mergers and Shareholder Wealth: A Study of the Mutual Fund Industry, Journal of Financial Economics 85, 571-598.
Koski, Jennifer, and Jeffrey Pontiff, 1999, How Are Derivatives Used? Evidence from the Mutual Fund Industry, Journal of Finance Research Letters 54, 791-816.
Laise, Eleanor, 2006, Another Way to Assess a Mutual Fund: Evidence Mounts That Performance Improves When Managers Invest in Their Own Portfolios, The Wall Street Journal.
Ma, Linlin, and Yuehua Tang, 2014, Portfolio Manager Ownership and Mutual Fund Risk Taking, Working Paper.
Ma, Linlin, Yuehua Tang, and Juan-Pedro Gómez, 2015, Portfolio Manager Compensation in the U.S. Mutual Fund Industry, Working Paper.
Massa, Massimo, and Rajdeep Patgiri, 2009, Incentives and Mutual Fund Performance: Higher Performance or Just Higher Risk Taking?, Review of Financial Studies 22, 1777-1815.
Journal of Political Economy 111, 642 - 685.
Petajisto, Antti, 2013, Active Share and Mutual Fund Performance, Financial Analysts Journal 69, 73-93.
Schwarz, Christopher G., 2011, Mutual Fund Tournaments: The Sorting Bias and New Evidence, Review of Financial Studies.
Tufano, Peter, and Matthew Sevick, 1997, Board Structure and Fee-Setting in the U.S. Mutual Fund Industry, Journal of Financial Economics 46, 321-355.
Zhou, Xianming, 2001, Understanding the Determinants of Managerial Ownership and the Link between Ownership and Performance: Comment, Journal of Financial Economics 62, 559-571.
20
Table 1 Descriptive statistics
This table reports summary statistics for our sample of single-managed US equity mutual funds between 2005 and 2011 compared to the CRSP universe. We report mean and median differences for both samples for the following variables: fund size as measured by the total net assets in million USD, the fund turnover (in %), the fund flows (in %), the fund family size calculated as the total net assets of all team- and single-managed mutual funds in the family, and the Pástor and Stambaugh (2003) five-factor alpha. As the board characteristics and ownership measures are not available for the CRSP universe (denoted as n/a), we only report means and medians for the following variables for our sample: the fund board size, the fraction of independent directors on the board, the fund manager ownership level (in % of TNA), and the fund manager ownership change (in %) defined as the difference between the current percentage ownership and the lagged percentage ownership. ***, **, and * denote statistical significance at the 1%-, 5%-, and 10%-level, respectively, for the difference in means and medians between both samples (based on t-tests and Mann-Whitney-Wilcoxon rank-sum tests).
Mean Median
Sample CRSP Universe Difference Sample CRSP Universe Difference Fund and family characteristics:
Fund size 1,758.04 1,005.42 752.62 *** 299.05 205.15 93.90 *** Turnover (%) 92.97 90.30 2.67 64.00 64.00 0.00 Fund flows (%) 9.62 7.08 2.53 * -5.24 -6.89 1.64 *** Family size 88,199.48 32,076.07 56,123.41 *** 7,070.10 5,280.60 1,789.50 *** 5 factor alpha (%) 0.64 0.95 -0.31 0.87 1.02 -0.16 Board characteristics:
Board size 8.00 n/a n/a 8.00 n/a n/a Indep. directors (%) 78.92 n/a n/a 80.00 n/a n/a Ownership measures:
Ownership level (% ) 0.52 n/a n/a 0.01 n/a n/a Ownership change (%) 0.05 n/a n/a 0.00 n/a n/a
21
Table 2 Ownership changes and changes in fund performance
This table reports results from first-difference regressions of performance on lagged percentage ownership using three different performance measures: (1) Fama and French (1993) three-factor alpha, (2) Carhart (1997) four-factor alpha, and (3) Pástor and Stambaugh (2003) five-factor alpha. The dependent variable is the change from year t-1 to year t of the respective performance measure. As fund control variables we
and the lagged family size (calculated as the total net assets of all team- and single-managed mutual funds in the family). As board control variables we use fund's lagged board size as well as the lagged fraction of independent directors on the board. All independent variables are calculated as changes from year t-2 to year t-1. The regression specifications include time fixed effects and segment fixed effects. Robust t-statistics of the regression coefficients in parentheses are based on standard errors clustered by fund. ***, **, and * denote statistical significance at the 1%-, 5%-, and 10%-level, respectively.
Dependent variable: Change in Alpha t-1 to t
3F 4F 5F
(1) (2) (3) (4) (5) (6) Ownership change t-2 to t-1 0.4372*** 0.4022*** 0.4340*** 0.3785*** 0.5409*** 0.5311***
(3.880) (3.101) (2.927) (2.954) (3.546) (3.726) Fund and family characteristics:
Change in fund size t-2 to t-1 0.0055 0.0002 -0.0023
(0.516) (0.020) (-0.175) Change in turnover t-2 to t-1 0.0176 0.0284* 0.0288*
(1.514) (1.843) (1.852) Change in family size t-2 to t-1 0.0104 0.0156 0.0153
(0.545) (0.819) (0.765) Board characteristics:
Change in boards size t-2 to t-1 -0.0009 -0.0020 -0.0055
(-0.205) (-0.465) (-1.255) Change in indep. directors t-2 to t-1 0.0372 0.0205 0.0569
(0.388) (0.246) (0.586) Segment fixed effects Yes Yes Yes Yes Yes Yes Time fixed effects Yes Yes Yes Yes Yes Yes Observations 864 606 864 606 864 606 Adjusted R-squared 0.112 0.111 0.071 0.093 0.063 0.091
22
Table 3 Robustness
This table reports results from first-difference regressions of performance on lagged percentage ownership using three different performance measures: (1) Fama and French (1993) three-factor alpha, (2) Carhart (1997) four-factor alpha, and (3) Pástor and Stambaugh (2003) five-four-factor alpha. The dependent variable is the change from year t-1 to year t of the respective performance measure. In Panel A, the percentage ownership measure is calculated using the midpoint of the reported ownership range instead of the bottom of each range. In Panel B, we replace our percentage ownership measure by a placebo percentage ownership measure. The nominator of this placebo ownership measure takes on the mean dollar ownership in the sample for all funds and years whereas the denominator remains the fund size. In Panel C, we additionally control for the change in fund flows. Panel D shows results for the subsamples of small and large funds using the sample median of fund size as cutoff. For sake of brevity, we only report the coefficients for the change in ownership. Other independent variables are defined as in Table 2. All independent variables are calculated as changes from year t-2 to year t-1. The regression specifications include time fixed effects and segment fixed effects. Robust t-statistics of the regression coefficients in parentheses are based on standard errors clustered by fund. ***, **, and * denote statistical significance at the 1%-, 5%-, and 10%-level, respectively.
Panel A: Mid range
Dependent variable: Change in Alpha t-1 to t
3F 4F 5F
(1) (2) (3)
Ownership change t-2 to t-1 0.4262** 0.4359* 0.5780** (2.088) (1.862) (2.439) Change in fund and family characteristics Yes Yes Yes
Change in board characteristics Yes Yes Yes
Segment fixed effects Yes Yes Yes
Time fixed effects Yes Yes Yes
Observations 606 606 606
Adjusted R-squared 0.112 0.095 0.093
Panel B: Placebo ownership change
Dependent variable: Change in Alpha t-1 to t
3F 4F 5F
(1) (2) (3)
Ownership change t-2 to t-1 0.9719 1.1012 1.2241 (1.147) (1.133) (1.257) Change in fund and family characteristics Yes Yes Yes
Change in board characteristics Yes Yes Yes
Segment fixed effects Yes Yes Yes
Time fixed effects Yes Yes Yes
Observations 606 606 606
23
Table 3 Continued
Panel C: Impact of fund flows
Dependent variable: Change in Alpha t-1 to t
3F 4F 5F
(1) (2) (3)
Ownership change t-2 to t-1 0.2974** 0.2939** 0.4338*** (2.523) (2.354) (3.443) Change in fund flows t-2 to t-1 -0.0408*** -0.0345** -0.0387***
(-3.178) (-2.520) (-2.682) Change in fund and family characteristics Yes Yes Yes
Change in board characteristics Yes Yes Yes
Segment fixed effects Yes Yes Yes
Time fixed effects Yes Yes Yes
Observations 569 569 569
Adjusted R-squared 0.121 0.098 0.100
Panel D: Small versus large funds
Dependent variable: Change in Alpha t-1 to t
Small funds Large funds
3F 4F 5F 3F 4F 5F
(1) (2) (3) (4) (5) (6)
Ownership change t-2 to t-1 0.2810** 0.2727** 0.3867*** 37.1560*** 19.9214* 21.9912** (2.211) (2.048) (2.896) (3.370) (1.746) (2.297) Change in fund and family characteristics Yes Yes Yes Yes Yes Yes
Change in board characteristics Yes Yes Yes Yes Yes Yes
Segment fixed effects Yes Yes Yes Yes Yes Yes
Time fixed effects Yes Yes Yes Yes Yes Yes
Observations 253 253 253 316 316 316
24
Table 4 Ownership changes and alternative predictors of future fund performance
This table reports results from first-difference regressions of performance on lagged percentage ownership using three different performance measures: (1) Fama and French (1993) three-factor alpha, (2) Carhart (1997) four-factor alpha, and (3) Pástor and Stambaugh (2003) five-four-factor alpha. The dependent variable is the change from year t-1 to year t of the respective performance measure. The ownership level is calculated as percentage ownership measure by dividing the converted dollar amount by a fund's year end total net assets (TNA) and lagged by one year. We use the active share measure of Cremers and Petajisto (2009) and Petajisto (2013). To measure the industry concentration, we follow Kacperczyk, Sialm, and Zheng (2005) and sort all stocks into ten industries and calculate the weight for a specific industry in a portfolio by summing up the portfolio weights of all stocks belonging to that industry. The sum of the squared industry weights (averaged across the quarters of a year) is then used as a measure of industry concentration. To calculate the return gap, we follow Kacperczyk, Sialm, and Zheng (2008) by comparing the realized fund returns with holding-based fund returns. The latter is a hypothetical portfolio that invests in the previously disclosed fund holdings. We then compound the monthly return gap observations to come up with a yearly measure. To compute the R² measure of Amihud and Goyenko (2013), we first run yearly regressions of fund´s monthly excess returns on the Carhart (1997) four factors. We then obtain the fund´s R² from these regressions. For sake of brevity, we only report the coefficients for the change in ownership and the additional control variables. Other independent variables include those defined in Table 2 and fund flows. All independent variables are calculated as changes from year t-2 to year t-1 (except for the ownership level in t-1). The regression specifications include time fixed effects and segment fixed effects. Robust t-statistics of the regression coefficients in parentheses are based on standard errors clustered by fund. ***, **, and * denote statistical significance at the 1%-, 5%-, and 10%-level, respectively.
Dependent variable: Change in Alpha t-1 to t
3F 4F 5F (1) (2) (3) Ownership change t-2 to t-1 0.4362*** 0.3055** 0.5323*** (2.895) (2.311) (4.183) Additional controls Ownership level t-1 0.0038 0.1581 0.0278 (0.024) (1.098) (0.200) Change in active share t-2 to t-1 0.3378** 0.2198 0.2080 (2.277) (1.444) (1.320) Change in industry concentration t-2 to t-1 -0.3426 -0.3353 -0.3768*
(-1.592) (-1.567) (-1.708) Change in return gap t-2 to t-1 -0.4957*** -0.4674*** -0.5725***
(-2.868) (-3.042) (-3.258) Change in R2
t-2 to t-1 0.1344 0.1097 0.1719 (0.890) (0.725) (1.080) Change in fund and family characteristics Yes Yes Yes
Change in board characteristics Yes Yes Yes
Segment fixed effects Yes Yes Yes
Time fixed effects Yes Yes Yes
Observations 321 321 321
25
Table 5 Family policy change: fund performance
This table reports results from first-difference regressions of performance on lagged percentage ownership and the interaction between the ownership change measure and a family policy change dummy using three different performance measures: (1) Fama and French (1993) three-factor alpha, (2) Carhart (1997) four-factor alpha, and (3) Pástor and Stambaugh (2003) five-factor alpha. The dependent variable is the change from year t-1 to year t of the respective performance measure. The family policy changes dummy takes on the value one if the fund family did not have an ownership requirement in place in the past year and has such a requirement in place this year, and zero otherwise. For sake of brevity, we only report the coefficients for the change in ownership, the family policy dummy and the interaction between ownership changes and family policy changes. Other independent variables include those defined in Table 2 and fund flows. All independent variables are calculated as changes from year t-2 to year t-1. The regression specifications include time fixed effects and segment fixed effects. Robust t-statistics of the regression coefficients in parentheses are based on standard errors clustered by fund. ***, **, and * denote statistical significance at the 1%-, 5%-, and 10%-level, respectively.
Dependent variable: Change in Alpha t-1 to t
3F 4F 5F
(1) (2) (3)
Ownership change t-2 to t-1 0.2869** 0.2856** 0.4269***
(2.460) (2.304) (3.442) Ownership change t-2 to t-1 * Family policy change t-2 to t-1 11.8349*** 9.4690*** 7.2716***
(4.654) (3.680) (2.680)
Family policy change t-2 to t-1 -0.0261 -0.0231 -0.0106
(-1.460) (-1.285) (-0.581)
Change in fund and family characteristics Yes Yes Yes
Change in board characteristics Yes Yes Yes
Segment fixed effects Yes Yes Yes
Time fixed effects Yes Yes Yes
Observations 569 569 569
26
Table 6 Family policy change: channels
This table reports results from first-difference regressions of various trading activity measures as dependent variables on lagged percentage ownership and the interaction between the ownership change measure and a family policy change dummy. Active share and return gap are defined as in Table 4. To examine changes in cash and equity holdings and, we measure cash (equity) holdings as reported cash (equity) from CRSP. The family policy changes dummy takes on the value one if the fund family did not have an ownership requirement in place in the past year and has such a requirement in place this year, and zero otherwise. For sake of brevity, we only report the coefficients for the change in ownership, the family policy dummy and the interaction between ownership changes and family policy changes. Other independent variables include those defined in Table 2 and fund flows. All independent variables are calculated as changes from year t-2 to year t-1. The regression specifications include time fixed effects and segment fixed effects. Robust t-statistics of the regression coefficients in parentheses are based on standard errors clustered by fund. ***, **, and * denote statistical significance at the 1%-, 5%-, and 10%-level, respectively.
Dependent variable: Change t-1 to t in
Active share Turnover Return gap Cash holdings Equity holdings (1) (2) (3) (4) (5)
Ownership change t-2 to t-1 -0.0214 -0.2467 0.0164 0.1439 -0.1572
(-1.006) (-0.215) (0.313) (0.788) (-1.033) Ownership change t-2 to t-1 * Family policy change t-2 to t-1 1.6869* 22.8426*** 8.3254*** -11.3762*** 8.8644***
(1.879) (3.655) (7.298) (-7.141) (5.937) Family policy change t-2 to t-1 0.0026 -0.0440 -0.0050 0.0048 -0.0023
(0.248) (-0.857) (-0.486) (0.522) (-0.269) Change in fund and family characteristics Yes Yes Yes Yes Yes Change in board characteristics Yes Yes Yes Yes Yes Segment fixed effects Yes Yes Yes Yes Yes Time fixed effects Yes Yes Yes Yes Yes Observations 243 567 485 570 570 Adjusted R-squared 0.038 0.028 0.075 0.033 0.045