POLYOLEFIN/CLAY NANOCOMPOSITE PEELABLE SEALANTS: MICROSTRUCTURE AND PERFORMANCE
SEYEDEH RAZIYEH MOHAMMADI DÉPARTEMENT DE GÉNIE CHIMIQUE ÉCOLE POLYTECHNIQUE DE MONTRÉAL
THÈSE PRÉSENTÉE EN VUE DE L’OBTENTION DU DIPLÔME DE PHILOSOPHIAE DOCTOR
(GÉNIE CHIMIQUE) DÉCEMBRE 2017
UNIVERSITÉ DE MONTRÉAL
ÉCOLE POLYTECHNIQUE DE MONTRÉAL
Cette thèse intitulée :
POLYOLEFIN/CLAY NANOCOMPOSITE PEELABLE SEALANTS: MICROSTRUCTURE AND PERFORMANCE
présentée par : MOHAMMADI Seyedeh Raziyeh
en vue de l’obtention du diplôme de : Philosophiae Doctor a été dûment acceptée par le jury d’examen constitué de:
M. CICOIRA Fabio, Ph. D., président
M. AJJI Abdellah, Ph. D., membre et directeur de recherche Mme HEUZEY Marie-Claude, Ph. D., membre
beloved sons Parsa and Borna for their
ACKNOWLEDGEMENTS
First, I wish to express my best appreciations to my dear advisor and mentor, Professor Abdellah Ajji, for his continuous support during my PhD study and writing this thesis. I sincerely thank his insight, encouragement, patience and guidance during development of this research. I am very honored that I did my PhD under his supervision. I highly appreciate his honesty, discipline and very supportive behavior with his research group. Also, I greatly thank him for the time he spent to precisely revise the articles of this research.
I am very grateful to my co-advisor Dr. Seyed Hesamoddin Tabatabaei for his valuable advices during the development of this research project. I highly appreciate our fruitful discussions and his scientific attitude during our meetings. I am very honored that I have had the opportunity to work with him.
Thanks to Prof. Chul B. Park, Prof. Marie-Claude Heuzey, and Prof. Fabio Cicoira for accepting to evaluate my thesis and to be a part of the jury in my thesis defense.
I would like to thank my friends and members of our research group in the Department of Chemical Engineering. I greatly value our friendship and I will keep in my mind our sweet memories in the group.
I also would like to thank the technical and administrative staff of the Department of Chemical Engineering at Polytechnique Montréal.
Most importantly, I would like to thank my beloved family. I would like to thank my parents for their unconditional love, presence, patience and support throughout the time I’ve been writing my thesis. Their encouragement had great influence on me to continue my study and doing my PhD. I warmly thank my parents in law for their encouragement. My most thanks go to my dear husband Ali who is my best friend ever. This journey would not have been possible without his valuable supports. I gratefully thank Ali for encouraging and inspiring me to pursue and follow all my dreams.
marchandises, l'électricité, l'agriculture, les aliments cosmétiques et les emballages médicaux est d'une grande importance en raison des demandes de plus en plus nombreuses des consommateurs. Les polymères à base de polyoléfines ont été largement utilisés comme matériaux d'étanchéité en raison de leurs propriétés mécaniques, rhéologiques et thermiques acceptables ainsi que de leur faible coût. Néanmoins, un grand nombre de formulations d'étanchéité constituées de mélanges à base de polyoléfine souffrent d'une fenêtre de température thermocollante pelable étroite (ΔTp).
L'incorporation de l’argile organo-modifiée (organoargile) aux couches de scellement est une nouvelle approche pour réaliser des scellants pelables avec un large ΔTp. Cependant, les produits
d'étanchéité pelables fabriqués à partir de nanocomposites d'argile sont à leur début et les facteurs clés contrôlant la performance de décollement des scellants nanocomposites n'ont pas encore été établis.
Dans la première partie de ce travail, nous discutons de l'effet de l'incorporation de divers types d’organoargiles sur la performance de pelage du scellant polyéthylène à faible densité (LDPE). Le mélange LDPE/organoargile non modifié représente une performance de joint d’étanchéité de verrouillage semblable au scellant de LDPE pur. L'augmentation de la quantité de modificateur de surface de l'argile entraîne une amélioration des performances de décollement. L'étude de diverses teneurs en organoargiles de 2 à 10% en poids indique qu'au moins 6% en poids d’organoargile sont nécessaires pour obtenir un ΔTp d'environ 12-15 °C à partir du scellant LDPE sans l’utilisation
d'agent compatibilisant. Les résultats de la diffraction des rayons X (WAXD) et de la microscopie électronique à transmission (TEM) indiquent qu'une amélioration substantielle de la dispersion et de la distribution des argiles dans la couche de scellement est obtenue en rendant l'organoargile compatible avec l'anhydride maléique greffé PE (PE-g-MA). En conséquence, le ΔTp augmente à
45 °C avec le même niveau de la teneur en organoargile (6% en poids). En augmentant le rapport pondéral PE-g-MA/organoargile de 2 à 5, une dispersion semi-exfoliante des argiles organo-modifiée dans la couche de scellement est obtenue et un ΔTp ultra-large de plus de 100 °C est
atteint. L'analyse des résultats du test de pelage en T et de la microscopie électronique à balayage (MEB) de la surface de scellement des scellants indique que la dispersion et la distribution des particules d'argile dans la zone du joint sont les principaux facteurs contrôlant la performance de pelage du PE/argile les scellants nanocomposites.
Dans la seconde partie de cette étude, nous examinons l'effet de la localisation de l'argile dans deux mélanges à base de LDPE, à savoir le LDPE/copolymère d'éthylène-acrylate de méthyle (EMA) et le LDPE/terpolymère éthylène-acrylate de méthyle-méthacrylate de glycidyle (EMA-GMA). Les résultats WAXD et TEM sont en accord avec les prédictions thermodynamiques qui montrent la localisation de l'argile à l'interface de LDPE/EMA et dans la phase dispersée EMA-GMA dans le mélange LDPE/EMA-GMA. La localisation de l'argile organo-modifiée est également confirmée par des analyses rhéologiques et mécaniques. L'incorporation de l'argile de 4 phr au système LDPE/EMA convertit son comportement de scellement de verrouillage en un comportement pelable avec un ΔTp large de plus de 35 °C. En revanche, l'aptitude au pelage du scellant
nanocomposite à base de LDPE/EMA-GMA/organoargile a légèrement changé par rapport au scellant de mélange LDPE/EM-GMA. La localisation des particules d'argile à l'interface du mélange LDPE/EMA se traduit par une réduction de la taille des particules et de la distance interparticulaire, ce qui facilite le pontage de la fissure lors du pelage. Cependant, l'encapsulation d'organoargiles dans la phase dispersée EMA-GMA agit contre la pelabilité.
Dans la troisième partie de ce travail, l'effet de la nanoargile sur la performance de pelage et le vieillissement des scellants de mélange LDPE/PB-1 sont étudiés. En utilisant l'analyse WAXD et l'imagerie TEM, on a démontré que lorsque l'argile est ajouté au mélange LDPE/PB-1, il a tendance à se localiser à l'interface des composants du mélange. Le mélange LDPE / PB-1 contenant 5% en poids d'agent d'étanchéité PB-1 et LDPE/organoargile contenant 1 phr d'argile organo-modifiée présentent tous les deux un comportement d'étanchéité semblable à celui du scellant LDPE pur. En revanche, le scellant LDPE/PB-1/organoargile contenant 5% en poids de PB-1 et 1 phr d'argile présente une performance de pelage polyvalente sur un large ΔTp d'environ 100 °C. L'efficacité de
1 phr organoargile dans l'amélioration de la pelabilité est réduite en augmentant la teneur en PB-1 dans les mélanges. Cela pourrait être dû à la plus faible couverture interfaciale des particules d'argile à l'interface des mélanges de LDPE/1 en raison de l'augmentation de la teneur en PB-1. La force d'arrachement des scellants LDPE/PB-1 contenant 5 à 20% en poids de PB-1 est diminuée au cours du vieillissement en raison de la formation de cristaux de PB-1 instables après le thermoscellage, tel que démontré par les analyses par WAXD. Aucune trace de la forme cristalline métastable II n'est détectée après thermoscellage des scellants nanocomposites LDPE/PB-1/organoargile, ce qui correspond à la performance de pelage constante observée pour les scellants nanocomposites.
SEM indiquent que PB-1 forme des structures nanofibrillaires dans les mélanges de LDPE/PB-1 contenant 5 à 20% en poids de PB-1. L'épaisseur moyenne des nanofibrilles de PB-1 a diminué significativement de 100 à 60 nanomètres lors de l'incorporation de 1 phr organoargile à l'agent d'étanchéité contenant 5% en poids de PB-1. L'épaisseur des nanofibrilles PB-1 a légèrement diminué de 190 à 170 nm et de 200 à 190 nm dans les scellants contenant respectivement 10 et 20% en poids de PB-1. Les résultats du FTIR et du WAXD ont révélé la présence de la forme stable I et possiblement la formation directe de la forme 1. Ceci peut être attribué à l'effet mémoire de la fusion et à la ségrégation des cristaux dans le procédé de thermoscellage rapide plutôt qu'à la fusion complète des cristaux. En plus des formes I/Iʹ, la forme métastable II est détectée juste après le thermoscellage qui est responsable du vieillissement des agents d'étanchéité LDPE/PB-1. Aucune trace de la forme II n'est observée après le thermoscellage du nanocomposite LDPE/PB-1/organoargile, alors que les cristaux avec les formes I et III sont détectés avec les caractérisations par FTIR et WAXD juste après le thermoscellage. Ceci est attribué à la cristallisation confinée des nanofibrilles PB-1 comme confirmé par les résultats de la caractérisation par FTIR polarisée qui indiquent l'orientation anisotrope des cristaux PB-1 dans les matériaux d'étanchéité nanocomposites. Ce confinement est imposé en raison de la solidification antérieure de la matrice de LDPE avec une température de cristallisation plus élevée à 95 °C comparée à celle de PB-1 à 75 °C. La cristallisation des nanofibrilles PB-1 dans du LDPE solidifié est encore confinée en présence d’organoargiles à l'interface et possiblement dans la phase PB-1.
Les résultats de cette étude établissent une stratégie pour produire des produits d'étanchéité pelables avec des performances de pelage souples et constantes sur une large gamme de températures de thermoscellage.
ABSTRACT
Nowadays, easy to open packaging for vast variety of applications such as merchandise, electrical, agricultural, cosmetic food and medical packaging is of great importance due to increasingly consumer demands. Polyolefin-based polymers have been extensively used as seal materials due to their acceptable mechanical, rheological and thermal properties as well as low cost. Nonetheless, many seal formulations made of polyolefin based blends suffer from narrow peelable heat seal temperature window (∆Tp). The incorporation of organoclay to seal layers is a novel approach to
achieve peelable sealants with broad ∆Tp. However, peelable sealants made of clay nanocomposites
are in their infancy and this dissertation reports on the key factors controlling the peel performance of the nanocomposites sealants containing nanoclay.
In the first part of this work, we discuss the effect of incorporation of various types of organoclays on the peel performance of low density PE (LDPE) sealant. PE/unmodified clay sealant represents a lock seal performance similar to neat LDPE sealant. Increasing the amount of clay surface modifier results in enhanced peel performance. Investigating various contents of organoclays from 2 to 10 wt% indicates that at least 6 wt% of organoclay is needed to achieve a ∆Tp of about 12-15
°C from LDPE sealant without the use of any compatibilizer. Wide angle X-ray diffraction (WAXD) results and transmission electron microscopy (TEM) images indicate that a substantial enhancement in the dispersion and distribution of the organoclays in the seal layer is achieved upon compatibilizing the organoclay with PE-grafted maleic anhydride (PE-g-MA) copolymer. As a result, the ∆Tp enhances to 45 °C with the same level of the organoclay content (6 wt%). By
increasing PE-g-MA/organoclay weight ratio from 2 to 5, a semi-exfoliate dispersion of the organoclays in the seal layer is achieved and results is an ultra-wide ∆Tp of over 100 °C. Analyzing
the T-peel test results and scanning electron microscopy (SEM) of the peel fractured surface of the sealants indicated that the dispersion and distribution of the clay particles in the seal area are the main factors which control the peel performance of the PE/clay nanocomposite sealants.
In the second part of this study, we examine the effect of organoclay localization in two PE based blends i.e. LDPE/ethylene-methyl acrylate copolymer (EMA) and LDPE/ethylene-methyl acrylate-glycidyl methacrylate terpolymer (EMA-GMA). The WAXD and TEM results are in agreement with the thermodynamic predictions which show the localization of organoclay at the interface of LDPE/EMA and within the EMA-GMA dispersed phase in the LDPE/EMA-GMA blend. The
peelable one with a wide ∆Tp of over 35 °C. In contrast, the peelability of the
LDPE/EMA-GMA/organoclay nanocomposite sealant marginally changed when compared to the LDPE/EM-GMA blend sealant. The localization of clay particles at the interface of LDPE/EMA blend results in a reduced particle size and interparticle distance, which facilitate the crack bridging upon peeling. However, the encapsulation of organoclays within the EMA-GMA dispersed phase works against peelability.
In the third part of this work, the effect of nanoclay on the peel performance and aging of the LDPE/PB-1 blend sealants are investigated. Using WAXD analysis and TEM imaging, it is shown that when organoclay is added to the LDPE/PB-1 blend, it tends to localize at the interface of the blend components. The LDPE/PB-1 blend containing 5 wt% of PB-1 and LDPE/organoclay sealant containing 1 phr organoclay both exhibit lock seal behavior similar to the neat LDPE sealant. In contrast, LDPE/PB-1/organoclay sealant containing 5 wt% of PB-1 and 1 phr organoclay shows a versatile peel performance over a wide ∆Tp of about 100 °C. The effectiveness of 1 phr organoclay
in enhancing peelability is reduced by increasing PB-1 content in the blends. This might be due to the lower interfacial coverage of the clay particles at the interface of LDPE/PB-1 blends due to increase in the PB-1 content. The peel force of the LDPE/PB-1 sealants containing 5 to 20 wt% of PB-1 is decreased upon aging due to the formation of unstable form II crystals of PB-1 after heat sealing as approved through WAXD experiments. No trace of the metastable crystal form II is detected after heat sealing of the LDPE/PB-1/organoclay nanocomposites sealants which is in line with the consistent peel performance observed for the nanocomposite sealants.
In the fourth part of this study, the underlying mechanism of PB-1 polymorphism after heat sealing of the LDPE/PB-1 blend and nanocomposite sealants is investigated. SEM images indicate that PB-1 forms nanofibrillar structures in the LDPE/PB-1 blends containing 5 to 20 wt% PB-1. The average thickness of PB-1 nanofibrils significantly decreased from 100 to 60 nanometers upon the incorporation of 1 phr organoclay to the sealant containing 5 wt% of the PB-1. The thickness of PB-1 nanofibrils moderately decreased from 190 to 170 nm and from 200 to 190 nm in the sealants containing 10 and 20 wt% of PB-1, respectively. FTIR and WAXD results revealed the presence of the stable form I and possibly direct formation of form Iʹ. The presence of form I and direct formation of form I΄ can be attributed to melt memory effect and crystal segregation in the fast heat
sealing process rather than complete melting of the crystals. In addition to the forms I/Iʹ, the metastable form II is detected right after the heat sealing which is responsible for the aging of the 1 sealants. No trace of form II is observed after the heat sealing of the LDPE/PB-1/organoclay nanocomposite, while the crystals form Iʹ and form III are detected trough FTIR and WAXD patterns right after heat sealing. This is attributed to the confined crystallization of the PB-1 nanofibrils as confirmed by the results of polarized FTIR experiment which indicate anisotropic orientation of the PB-1 crystals in the nanocomposite sealants. This confinement is imposed due to the earlier solidification of the LDPE matrix with a higher crystallization temperature at 95 °C compared to that of the PB-1 at 75 °C. The crystallization of PB-1 nanofibrils in solidified LDPE is further confined in the presence of organoclays at the interface and possibility within the PB-1 phase.
The results of this study establish a strategy to produce peelable sealants with versatile and consistent peel performance over a wide range of heat seal temperatures.
ACKNOWLEDGEMENTS ... IV RÉSUMÉ ... V ABSTRACT ... VIII TABLE OF CONTENTS ... XI LIST OF TABLES ... XV LIST OF FIGURES ... XVI LIST OF SYMBOLS AND ABBREVIATIONS... XXII LIST OF APPENDICES ... XXV
CHAPTER 1 INTRODUCTION ... 1
1.1 Introduction ... 1
CHAPTER 2 LITERATURE REVIEW ... 4
2.1 Film casting ... 4
2.2 Heat sealing process ... 5
2.2.1 Platen pressure ... 6
2.2.2 Dwell time ... 6
2.2.3 Heat seal temperature ... 6
2.2.4 Effect of molecular architecture and crystallinity on heat seal properties ... 8
2.3 Peelable sealants ... 9
2.4 Fracture Mechanisms upon peeling ... 12
2.5 Layered silicates nanoparticles for easy opening packaging ... 13
2.6 Morphology of immiscible polymer blends ... 18
2.6.1 Effective parameters on morphology of polymer blends ... 19
2.6.2 Quantitative method to predict localization of nanoparticles in a blend ... 31
2.7 Originality of the work ... 35
2.8 Objectives ... 36
CHAPTER 4 ARTICLE 1: PEELABLE PE/CLAY NANOCOMPOSITE SEALS WITH
ULTRA-WIDE PEELABLE HEAT SEAL TEMPERATURE WINDOW ... 40
4.1 Abstract ... 40 4.2 Introduction ... 41 4.3 Experimental ... 43 4.3.1 Materials ... 43 4.3.2 Nanocomposite preparation ... 43 4.3.3 Film casting ... 44 4.3.4 Heat sealing ... 44 4.3.5 Mechanical test ... 45 4.3.6 Thermal analysis ... 45 4.3.7 Morphology analysis ... 45
4.3.8 Fourier Transform Infrared (FTIR) Spectroscopy ... 46
4.3.9 Rheological analysis ... 46
4.4 Results and discussion ... 46
4.4.1 Microstructure ... 46
4.4.2 Seal and Peel Properties ... 48
4.4.3 Peel – seal microstructure relationship ... 51
4.4.4 Fractured surface analysis ... 56
4.4.5 Peeling mechanisms ... 60
4.5 Conclusion ... 61
4.6 Acknowledgements ... 62
4.7 References ... 62
CHAPTER 5 ARTICLE 2: EFFECT OF NANOCLAY LOCALIZATION ON THE PEEL PERFORMANCE OF PE BASED BLEND NANOCOMPOSITE SEALANTS ... 70
5.1 Abstract ... 70
5.2 Introduction ... 71
5.3 Experimental ... 73
5.3.1 Materials ... 73
5.3.2 Clay polymer nanocomposite film preparation ... 73
5.3.6 Thermal analysis ... 75
5.3.7 Microstructure analysis ... 76
5.3.8 Rheological analysis ... 77
5.4 Results and Discussion ... 77
5.4.1 Thermodynamic predictions ... 77 5.4.2 Microstructure ... 79 5.4.3 Peel performance ... 82 5.5 Conclusion ... 90 5.6 Acknowledgements ... 91 5.7 References ... 91
CHAPTER 6 ARTICLE 3: NOVEL POLYETHYLENE/POLYBUTENE-1/CLAY NANOCOMPOSITE PEELABLE SEALANTS WITH VERSATILE PEEL PERFORMANCE 100 6.1 Abstract ... 100 6.2 Introduction ... 101 6.3 Experimental ... 103 6.3.1 Materials ... 103 6.3.2 Sample preparation ... 103 6.3.3 Characterization ... 104
6.4 Results and discussion ... 105
6.5 Conclusion ... 117
6.6 Acknowledgements ... 118
6.7 References ... 118
CHAPTER 7 ARTICLE 4: CONFINED CRYSTALLIZATION OF POLYBUTENE-1 NANOFIBRILS IN LOW DENSITY POLYETHYLENE/ POLYBUTENE-1/ORGANOCLAY NANOCOMPOSITE FILMS ... 125
7.1 Abstract ... 125
7.2 Introduction ... 126
7.4 Results and Discussion ... 128
7.5 Conclusion ... 133
7.6 References ... 133
CHAPTER 8 GENERAL DISCUSSION ... 138
CHAPTER 9 CONCLUSION AND RECOMMENDATIONS ... 142
9.1 Conclusion ... 142
9.2 Recommendations ... 145
BIBLIOGRAPHY ... 146
... 50 Table 5.1. Contact angles and the corresponding surface tension results at room and process
temperatures. ... 78 Table 5.2. Interfacial tensions of the components calculated at process temperature (200°C). ... 78 Table 6.1. Seal initiation temperature (Ti) and peelable heat seal temperature (∆Tp) of the blends and nanocomposite sealants of this study. ... 107
LIST OF FIGURES
Figure 2.1. A schematic of the film casting (Barborik & Zatloukal, 2015). ... 4 Figure 2.2. Schematic of the heat seal process (M. Nase et al., 2017). ... 5 Figure 2.3. SEM images of the peeled surfaces of LLDPE films sealed for 1 sec. Temperatures and
corresponding seal strengths are indicated (Mueller et al., 1998) ... 7 Figure 2.4. Correlation between sealing temperature and seal strength of the semi-crystalline
materials (Farley & Meka, 1994). ... 8 Figure 2.5. WAXS of LDPE/iPB-1 containing 20 m% iPB-1 after 2 and 240h after sealing at 413
K (left side), Peel force of the blend of LDPE/iPB-1 containing 20 m% iPB-1 as a function of time after sealing at 413 K (right side) (Kaszonyiova M, Rybnikar F, 2005). ... 11 Figure 2.6. Schematic of adhesive and cohesive peeling. ... 12 Figure 2.7. A typical force-displacement diagram obtained in a peel test: the continuous curve
indicates a real peel curve (a) and the dotted curve is an ideal peel curve without deformation of the seal (b). ... 13 Figure 2.8. Schematic picture of three main structures of polymer-nanoclays hybrids (LeBaron,
1999). ... 14 Figure 2.9. Phase separation in nanoclay/HDPE nanocomposites (a), exfoliated structure in the
same nanoclay/PS nanocomposites (b), and exfoliated structure for the same nanoclay/silicone rubber nanocomposites (Alexandre & Dubois, 2000). ... 15 Figure 2.10. TEM images of styrene based nanocomposites. Intercalated microstructure of
octadecylammonium-exchanged fluorohectorite/PS nanocomposites (left side) and exfoliated microstructure of bis(2-hydroxyethyl) methyltallow-exchanged montmorillonite/epoxy nanocomposites (right side) (Krishnamoorti et al., 1996). ... 16 Figure 2.11. Seal strength of 24.5 mm flat sealants, seals at 1000 psi pressure and 8 s dwell time to
fully equilibrate the seal interface (Manias et al., 2009). ... 17 Figure 2.12. Different morphologies for binary immiscible blends. a) Dispersed structure (TPU/PP
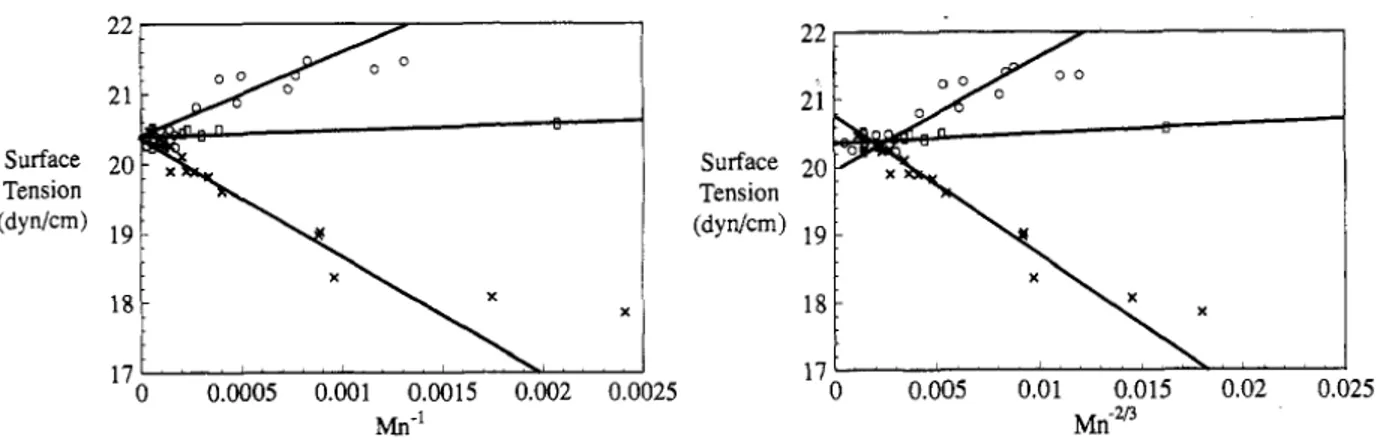
Figure 2.13. The surface tension of PDMS terminated with amine group (crosses), terminated with hydroxyl group (open circle) and terminated with methyl group (open Square) as a function of number average molecular weight (Mn) (Jalbert et al., 1993). ... 21
Figure 2.14. Critical Capillary number versus viscosity ration in simple shear flow and elongation flow (Grace, 1982). ... 24 Figure 2.15. Schematic picture of the evolutions of different morphologies by changing the volume
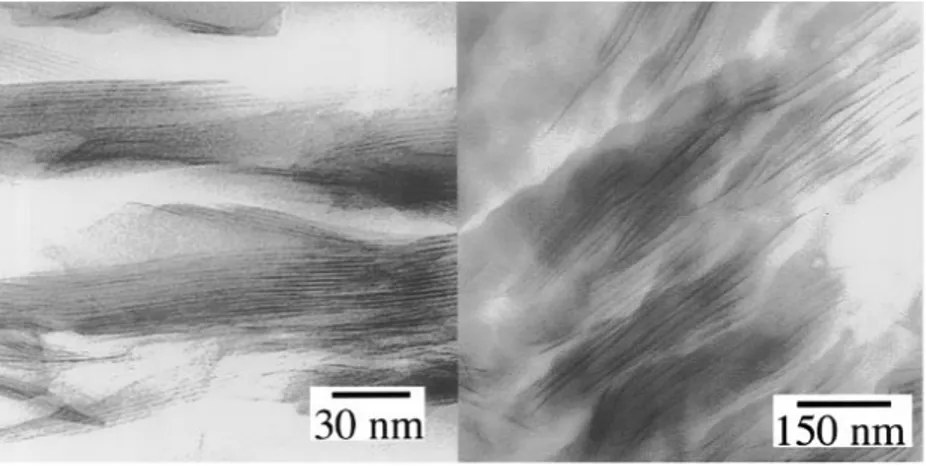
fraction of the components (S Ravati & Favis, 2010). ... 25 Figure 2.16. TEM images (left side) and traction-separation relationship (right side) for LDPE/iPB-1 blends with different contents of iPB-LDPE/iPB-1 (Michael Nase et al., 2009). ... 26 Figure 2.17. Schematic picture of three general developing stages for morphology evolution in
chaotic mixing (Sau & Jana, 2004). ... 27 Figure 2.18. The schematic picture of the effect of the copolymer on the coalescence of the
dispersed phase (J. Lee & Han, 2000). ... 29 Figure 2.19. Possible localization of solid particle, S, in polymer A and B. ... 33 Figure 2.20. schematic of localization of solid particle S in high viscose polymer A due to the
influence of the kinetic while S has affinity with polymer B and thermodynamic predicts its localization in polymer B. ... 35 Figure 4.1. WAXD patterns of the nanocomposite films: PE/NC Na+-6% (a), PE/C20-6% (b),
PE/C15-6% (c), 6% (d), 3% (e) and PE/PE-g-MA/C15-3% (5:1) (f). d001 indicates the clay gallery distance. ... 47
Figure 4.2. TEM micrographs of the nanocomposite films: PE/NC Na+-6% (a), PE/C20-6% (b), PE/C15-6% (c), 6% (d), 3% (e) and PE/PE-g-MA/C15-3% (5:1). The scale bars indicate 1 µm and the arrows indicate transverse direction (TD) of the films. ... 48 Figure 4.3. Peel strength of PE/C15 sealants with various clay concentrations as a function of
Figure 4.4. Peel force versus temperature of the neat PE sealant and its nanocomposite sealants. ... 49 Figure 4.5. Variation of the peelable heat seal temperature range (ΔTp) with ligament thickness.
... 53 Figure 4.6. Complex viscosity versus angular frequency of the nanocomposites at 190 °C and 10%
strain. ... 54 Figure 4.7. Force versus displacement upon peeling the PE/PE-g-MA/C15-3% (5:1) with semi-exfoliated morphology and PE/PE-g-MA/C15-6% with intercalated morphology. The arrows indicate tearing followed by elongation and strain hardening. ... 55 Figure 4.8. ATR-FTIR spectra of a) pure PE, b) PE/C20-6%, c) g-MA/C15-3%, d) PE/PE-g-MA/C15-3% (5:1), e) PE/C15-6%, f) PE/PE-g-MA/C15-6%. ... 56 Figure 4.9. Force-displacement diagrams (A) and force-displacement diagram of various
nanocomposites of this study (B): PE/C20-6% (a), PE/C15-6% (b), PE/PE-g-MA/C15-6% (c), PE/PE-g-MA/C15-3% (d) and PE/PE-g-MA/C15-3% (5:1) (e). ... 57 Figure 4.10. Adhesive energy release rate versus average ligament thickness of the sealants sealed
at various seal temperatures. The legend denotes heat seal temperature. ... 58 Figure 4.11. SEM micrographs of the peeled surfaces of PE/Na+-6% (a), PE/C20- 6% (b), PE/C15-
6% (c), PE/PE-g-MA/C15-3%, (d), PE/PE-g-MA/ C15-6% (e) and PE/PE-g-MA/ C15-3% (5:1) nanocomposite sealants. The scale bars denote 10 µm. ... 59 Figure 4.12. Schematic of the peeling a nanocomposite sealant. ... 60 Figure 5.1. Schematic of nanoclay localization in an immiscible polymer blend according to the prediction of the wettability parameter: (a) ω < -1, (b) ω > 1, (c) -1 < ω < 1. ... 78 Figure 5.2. WAXD diffraction patterns of (a) OC/PE, (b) OC/PE/EMA, and (c)
OC/PE/EMA-GMA sealants. ... 79 Figure 5.3. TEM micrographs of OC/PE/EMA (a, b, c) and OC/PE/EMA-GMA nanocomposites
(d, e, f). ... 80 Figure 5.4. SEM micrographs of the PE/EMA (a), OC/PE/EMA (b) PE/EMA-GMA (c) and
Figure 5.6. Peel performance versus temperature of the PE/EMA and OC/PE/EMA (a) and PE/EMA-GMA and OC/PE/EMA-GMA (b). ... 83 Figure 5.7. FTIR spectra of the neat PE film (a) after being peeled from various substrates:
PE/EMA (b), PE/EMA-GMA (c), OC/PE/EMA-GMA (d) and OC/PE/EMA (e). ... 84 Figure 5.8. Peel force of neat PE film sealed on neat EMA and neat EMA-GMA films. ... 85 Figure 5.9. Yield behavior of: PE/EMA, OC/PE/EMA (a) and PE/EMA-GMA and OC/PE/EMA-GMA (b). ... 87 Figure 5.10. Force-displacement diagrams and variation of the peeled seal deformation energy,
Ed,S, versus heat seal temperature of PE/EMA and OC/PE/EMA sealants (a and c),
PE/EMA-GMA and OC/PE/EMA-PE/EMA-GMA (b and d). The numbers after the nomenclatures of the samples indicate the heat seal temperature. ... 88 Figure 5.11. SEM micrographs of the peeled surfaces of PE/EMA (a), PE/EMA-GMA (b),
OC/PE/EMA-GMA (c) and OC/PE/EMA sealed at 120 ℃ (d), OC/PE/EMA sealed at 130 ℃ (e) and OC/PE/EMA sealed at 140 ℃. ... 89 Figure 5.12. Schematic of peel behavior of OC/PE/EMA and OC/PE/EMA-GMA sealants. ... 90 Figure 6.1. DSC micrograms of the neat PE, PB-1 polymers and their blends and nanocomposites. The arrows indicate endotherm corresponding to the crystal form I of PB-1. ... 105 Figure 6.2. Peel force versus seal temperature of the blends (a) and nanocomposites (b). ... 106 Figure 6.3. Force-displacement curves of PEPB5(a), NPEPB5 (b), PEPB10 (c), NPEPB10 (d),
PEPB20 (e) and NPEPB20 (f). The legends indicate the heat seal temperatures. ... 108 Figure 6.4. Stress-strain curves (a) and yield strength data (b) of LDPE/PB-1 blend and
nanocomposite films. ... 109 Figure 6.5. SEM images of the PEPB5 (a and d), PEPB10 (b and e) and PEPB20 (c and f) in MD-ND and TD-MD-ND cross section. The scale bars represent 0.5 µm. ... 110
Figure 6.6. Interparticle distance between the dispersed PB-1 phases in the LDPE/PB-1 blends and nanocomposites. ... 111 Figure 6.7. SEM images of the NPEPB5 (a and d), NPEPB10 (b and e) and NPEPB20 (c and f) in
TD-ND and MD-ND cross section. The scalebars represent 0.5 µm. ... 111 Figure 6.8. WAXD pattern of the neat PE/organoclay (a), PB-1/organoclay (b), NPEPB5 (c),
NPEPB10 (d) and NPEPB20 (e). ... 112 Figure 6.9. TEM images of NPEPB5 (a), NPEPB10 (b) and NPEPB20 (c) in ND-TD cross section.
The arrows indicate clay particles at the PE/PB-1 interface. ... 113 Figure 6.10. peel fractured surface of PEPB5 sealed at 130 (a), NPEPB5 sealed at 200 °C (b),
NPEPB10 sealed at 160 °C (c), NPEPB10 sealed at 165 °C (d), NPEPB20 sealed at 180 °C (e) and NPEPB20 sealed at 195 °C. ... 114 Figure 6.11. variation of the peel force of the blends (a) and nanocomposite sealants (b) of this
study. ... 116 Figure 6.12. WAXD patterns of the blends and nanocomposites sealants of LDPE/PB-1 containing
5 (a), 10 (b) and 20 wt% of PB-1 (c) immediately after the seal. ... 117 Figure 7.1 The SEM images of PEPB5 (a and d); PEPB10 (b and e) PEPB20 (c and f) in TD-ND (upper images) and MD-ND (lower images) cross sections. The yellow bars indicate 0.5 µm. ... 128 Figure 7.2. The SEM images of NPEPB5 (a and d), NPEPB10 (b and e) and NPEPB20 (c and f) in TD-ND (upper images) and MD-ND (lower images) cross sections. The yellow bars indicate 0.5 µm. ... 129 Figure 7.3. TEM images of NPEPB5 (a), NPEPB10 (b) and NPEPB20 (c). ... 129 Figure 7.4. WAXD patter of the neat blends and nanocomposites containing 5 (a), 10 (b) and 20
wt% of PB-1 (c) immediately after the seal. ... 130 Figure 7.5. Peel force of the blends (a) and nanocomposite sealants (b) right after, 24 hours and 10
days after being heat sealed. PEPB5, PEPB10 and PEPB20 were sealed at 130, 135 and a150 °C. the nanocomposites were sealed at 150 °C. ... 130
LIST OF SYMBOLS AND ABBREVIATIONS
Symbols:
𝐺𝐺∗ complex modulus 𝐶𝐶𝐶𝐶 contact angle 𝜌𝜌 density of polymers
σ𝑖𝑖𝑑𝑑 dispersive component of surface tension
𝜔𝜔 wettability parameter 𝐺𝐺 Gibbs free energy σ𝑖𝑖𝑖𝑖 interfacial tension
𝐺𝐺′′ loss modulus
𝑀𝑀𝑤𝑤 molecular weight of the polymers
σ𝑖𝑖𝑝𝑝 polar component of surface tension 𝛾𝛾̇ shear rate
𝐺𝐺′ storage modulus
σ surface/interfacial tension
𝜂𝜂 viscosity
𝜂𝜂 ∗ complex viscosity 𝜂𝜂0 zero shear viscosity
𝜆𝜆 x-ray wavelength
𝜃𝜃 the angle of the x-ray incident of reflected beam 𝑑𝑑 crystal plane distance
∆𝐻𝐻𝑚𝑚 heat of fusion
∆𝐻𝐻𝑚𝑚,100 enthalpy of 100% crystal
T𝑐𝑐 crystallization temperature
∆𝑇𝑇𝑝𝑝 peelable heat seal temperature range
E𝑝𝑝 plastic dissipated energy
E𝑎𝑎 adhesive fracture energy
E𝑑𝑑,𝑝𝑝 dissipated energy in the peel arm
E𝑑𝑑,𝑠𝑠 deformation energy of the peeled seal area
𝑊𝑊 width of the seal 𝐿𝐿 length of the seal
Abbreviations:
LDPE low density polyethylene HDPE high density polyethylene LLDPE linear low density polyethylene
PP polypropylene
PE polyethylene
mPE metallocene polyethylene
EMA ethylene-methyl acrylate copolymer EVA ethylene-vinyl acetate copolymer
EMA-GMA ethylene-methyl acrylate-glycidyl methacrylate terpolymer PB-1 polybutene-1
OC organoclay
NC nanoclay
CPN clay polymer nanocomposite
C15 Cloisite15
C20 Cloisite20
Na+ unmodified sodium montmorillonite MMT montmorillonite
OMt organomodified montmorillonite CEC cation exchange capacity
TD transverse direction MD machine direction ND normal direction
wt weight
PE-g-MA polyethylene grafted maleic anhydride WAXD wide angle x-ray diffraction
TEM transmission electron microscopy SEM scanning electron microscopy DSC differential scanning calorimetry FTIR Fourier transform infrared
POFTIR polarized Fourier transform infrared
ATR-FTIR attenuated transmission reflectance-Fourier transform infrared TSE twin screw extruder
CHAPTER 1
INTRODUCTION
1.1 Introduction
An effective packaging with appropriate barrier and mechanical properties, must be sealed tightly with the container to efficiently protect the product inside. In many cases, both sides of the seal are welded together so that the opening of the packaging is not possible unless by cutting instruments. Opening the packaging by this way is associated with many risks and is not convenient regarding to the modern life style. The high cost of compensations that is paid for the injuries related to packaging (Winder, Ridgway, Nelson, & Baldwin, 2002) along with increasing demands of consumers for convenient packaging, encourage film packaging manufacturers to produce user-friendly packaging with safe and effective seal performance (Gómez, Martín-Consuegra, & Molina, 2015). Easy opening packaging includes a wide variety of packaging with peelable sealant that requires a low peel force (about less than 650 N/m) to be opened (Manias et al., 2009). Basically, three rupture mechanisms or failures describe the peeling process: adhesive or interfacial failure (M. Nase, Großmann, Rennert, Langer, & Grellmann, 2014a), cohesive failure (Michael Nase, Langer, & Grellmann, 2008), and their combination (Martínez-García et al., 2008). In adhesive failure, the separation takes place either at the interface of the sealant and substrate or at the interface of the sealant layer and its adjacent layer in a multilayer film. No residue is left on the surface of the substrate after opening an adhesive film, therefore, these types of films are not recommended for perishable products. In the cohesive peeling mechanism, the separation takes place from inside of sealant layer and the residue of the seal remains on the substrate. Thus, this failure mechanism results in a more functional and reliable packaging performance. Furthermore, cohesive peels are less sensitive to the seal parameters i.e. heat seal temperature, pressure and dwell time (M. Nase et al., 2014a).
Cohesive peelable films are usually produced by blending two or more immiscible polymers and generally are thicker than the adhesive sealants to have enough room for separation from inside the seal layer (Hwo, 1987). Since the interface of the blend components is known to be the weakest point in an immiscible blend, therefore, cracks initiate at the interface of phases and develop throughout the inside of the seal layer upon peeling process. For this to happen, the yield strength of the sealant must be higher than the interfacial adhesions inside the seal layer, otherwise the
Among various polyolefins, PE and its counterparts are mainly used for seal applications owing to their fair mechanical properties and particularly their low cost (Coles, McDowell, & Kirwan, 2003; Han, 2005; Robertson, 2013). Many of these sealants suffer from narrow peelable heat seal temperature window, ∆Tp, possibly due to their insufficient incompatibility on one hand and their
low yield strength on the other (Liebmann, Schreib, E. Schlözer, & Majschak, 2012). Thus, the sealants yield upon peeling prior to be peeled. Blending at least 10 wt% of PB-1 with PE based materials is known as an effective approach to achieve peelable sealants with wide ∆Tp (Hwo,
1987). However, PB-1 exhibits unstable and complex polymorphism after heat treatment (Kalay & Kalay, 2002; Qiao, Wang, & Men, 2016; Yamashita, Kato, K., A., & H., 2007). After melting and during cooling at ambient pressure, PB-1 crystallizes into the kinetically favored metastable form II. The metastable form II spontaneously converts to thermodynamically favored stable form I crystal with time. This conversion is very slow and, depending on the physical conditions, may last several weeks. Since the density and thermal properties of forms II and I are very different, form II to form I conversion is accompanied by shrinkage and failure of the sealant (Azzurri, Flores, Alfonso, & Baltá Calleja, 2002; Michael Nase, Androsch, Langer, Baumann, & Grellmann, 2008). Thanks to the extensive research efforts, crystal from II to form I conversion might be accelerated with various approaches such as pressure (Nakafuku & Miyaki, 1983), orientation (Liu et al., 2012; Samon, Schultz, Hsiao, Wu, & Khot, 2000), copolymerization (Kaszonyiova, Rybnikar, Lapcik, & Manas, 2012; Shieh, Lee, & Chen, 2001; Stolte & Androsch, 2013) and incorporation of additive (Yamashita et al., 2007; X. Zhang, Zhang, & Shi, 1992) but, the metastable polymorphism of PB-1 still remains challenging, which restricts the fair use of this commercially interesting polymer in a variety of applications as well as packaging.
In addition to polymer blending, peelable seals with cohesive failure can be generated by incorporation of nanoclay in the seal layer (J. Zhang et al., 2009). Nanocomposite sealants can open a new window towards packaging industry since, taking advantage of the high barrier and mechanical performances of the nanoclays, monolayer films with lower thickness and less material as well as easier and faster melt processing can be produced instead of multilayer films with the same level of seal properties. It is known that the microstructure of nanocomposites, i.e. dispersion and distribution of nanoparticles, are the main parameters to control their final properties (Sinha
Ray & Okamoto, 2003b) while, there is lack of information on the effects of these key parameters on the peel and seal properties.
Furthermore, blending PE with its counterparts with lower softening point such as PE copolymers and terpolymers is a common approach to reduce the heat seal initiation temperature and optimize the seal properties of sealant. It is also reported that blending PE with its copolymers containing polar groups in the polymer backbone such as ethylene vinyl acetate copolymer (EVA) is effective to achieve peelable sealants with promoted peelability from PE/clay nanocomposite based sealants (Manias et al., 2009). In this regard, investigating the organoclay localization in the sealants composed of PE based blends is of great importance. In such a case, the preferred localization of the clay particles may profoundly affect the final properties of the sealant. To our knowledge, there is no literature to discuss the effect of organoclay localization on the peel performance of the sealants made of polymer blends.
2.1 Film casting
Cast extrusion is one of the most important techniques that is used to produce thousands of tons of polymer films and coatings. In the film casting process, a molten polymer is extruded through a flat die to form continuous thin sheet that is also called “web”. The extruded polymer is stretched in machine direction (MD) and rapidly cooled using air knifes and wound on calendar rolls, which are chilled with cold water (Figure 2.1). Although the thickness of the film near the die exit is increased due to die swell (because of molecular stress relaxation), the monotonic thickness reduction of the film takes place along the take-up length. The take-up length is defined as the distance between the die and chill roll. The amount of the stretch of the film along take-up length is called “draw ratio” which is defined as the ratio of the tangential velocity of the chill roll per linear velocity of the extruded polymer near the die. Necking and edge beading are respectively the inhomogeneity reduction in width and thickness of the film and are the two defects that usually take place during cast extrusion (Acierno, Di Maio, & Ammirati, 2000; Pol et al., 2014). Temperature variations from the die to chill roll as well as molecular weight, molecular weight distribution and presence of long chain branches are the parameters that affect necking and the edge breading defects (Barborik & Zatloukal, 2015; Chikhalikar et al., 2015; Rokade et al., 2017). The presence of long chain branches leads to a stress hardening and increases the deformation resistance of the film and consequently results in further and earlier necking near the die exit. The cooling rate of the extruded polymer is an important factor that affects polymer crystallinity after extrusion. A high cooling rate considerably decreases the degree of crystallinity of polymer (Mueller, Capaccio, Hiltner, & Baer, 1998).
2.2 Heat sealing process
Heat sealing is a process in which, two structures containing at least one thermoplastic layer are sealed over a time so called dwell time under specific heat and pressure (Figure 2.2). The seal pressure is defined as the minimum platen pressure that is required to bring the seal surfaces into an intimate contact as low as 5 Å. During sealing time, the applied pressure holds the two surfaces in a close contact and heat is transferred to the seal layer through conduction or radiation. The heat must be sufficient to make the seal structures molten and allow the seal surfaces to fuse together and make a homogenous interphase (Meka & Stehling, 1994; Theller, 1989).
The sealant characteristics are associated to material functions such as molecular weight, molecular weight distribution and crystallinity (Moreira, Dartora, & Paulo dos Santos, 2017; Planes, Marouani, & Flandin, 2011). Once the pressure is removed at the end of dwell time, the seal materials are still molten and soft. The molecular interactions in the seal layer must be high enough to maintain the seal layer against external forces that may act to pull them apart and withstand the strain while it is molten. The strength of the seal against external forces in a molten state to maintain its integrity is known as hot tack strength. In contrast to hot tack, which is the strength of the seal in molten or soft state right after sealing, the seal strength is defined as the strength of the seal after cooling to the ambient temperature. The maximum load required to pull the seal apart at ambient temperature is reported as seal strength (Aithani, Lockhart, Auras, & Tanprasert, 2006). The seal conditions including sealing pressure, dwell time and heat seal temperature significantly affect the seal properties as well as the mechanisms of failure upon peeling the seal (Iwasaki, Takarada, & Kikutani, 2016; Planes et al., 2011; Yuan & Hassan, 2007).
intimate contact and an increase in the platen pressure does not have considerable influence on the seal strength. Aithani et al. (Aithani et al., 2006) investigated the effect of seal parameters on the failure mechanisms of five different films including LDPE, LLDPE, LDPE-black, HDPE and cast PP (CPP). Their results revealed that a minimum pressure was required to initiate sealing. After sealing was initiated, increasing the pressure did not have notable effect on the seal strength of the sealants. The findings of another work by Yuan and Hassan (Yuan & Hassan, 2007) showed the same behavior for the effect of the platen pressure on the seal strength of an oriented polypropylene (OPP)/metallic cast polypropylene (MCPP). They observed that a minimum pressure (about 1.25 bars) was required to form a sealing layer and no seal was produced below that pressure. Further increasing the pressure during sealing did not affect the seal strength of the sealants.
2.2.2 Dwell time
The results of several studies revealed that increasing dwell time after the seal strength reaches a plateau does not have significant effect on seal strength. In fact, increasing dwell time below the seal strength plateau results in higher seal strength while increasing dwell time after reaching seal strength plateau does not have significant effect on it. By increasing the seal temperature, a lower dwell time is needed to achieve equivalent seal strength. Usually, lowering dwell time is more favorable in industry to increase the production rate. It is known that at temperatures under the melting point of seal material, dwell time does not have any influence on the seal strength while the required dwell time becomes shorter by increasing sealing temperature above the heat seal initiation temperature
2.2.3 Heat seal temperature
The effect of the heat seal temperature is predominant over the effect of the dwell time and platen pressure. Aithani et al. (Aithani et al., 2006) observed that increasing the heat seal temperature enhances the seal strength of the samples. Their results also revealed a predominant effect of the heat seal temperature on the seal strength over the effects of dwell time and pressure. Mazzola et al. (Mazzola, Cáceres, França, & Canevarolo, 2012) studied the correlation between the seal properties and heat sealing of polyolefin films. According to their results, the seal strength of
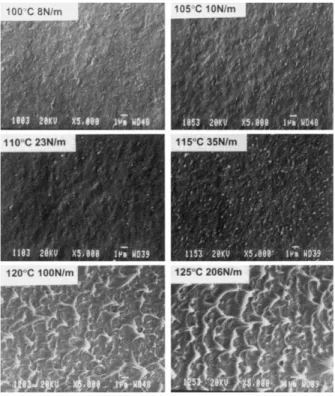
various polyolefins including ethylene plastomer (PEP) and terpolymer of propylene-ethylene-butene (TERP) increased by increasing the seal temperature. Tetsuya et al. (Tetsuya, Ishiaku, Mizoguchi, & Hamada, 2005) studied the effect of heat seal temperature on the mechanical properties of OPP/CPP films. They indicated that below the heat seal initiation temperature a weak seal is achieved while, increasing temperature beyond the heat seal initiation results in a hermetic seal. Similar results were earlier reported by Mueller et al. (Mueller et al., 1998). Figure 2.3 shows more fibril and membrane-like structures by increasing the seal temperature in the morphology of the peeled surfaces. An increase in the density of the interconnected structure by increasing temperature was attributed to the more diffusion of the molecular entanglements across the interface.
Figure 2.3. SEM images of the peeled surfaces of LLDPE films sealed for 1 sec. Temperatures and corresponding seal strengths are indicated (Mueller et al., 1998)
It was reported that heat sealing temperature must be higher than the melting point of seal materials to allow movement of the polymer chains across the interface (Lamnawar, Vion-Loisel, & Maazouz, 2010). By increasing the heat seal temperature, the seal strength enhances to reach a plateau. The temperature at which the plateau is started is called plateau initiation temperature (Tpi)
temperatures. Figure 2.4 illustrates the correlation between the heat seal temperature and seal strength. The width of the plateau in this curve is very important. The wider the heat seal plateau, the lower the heat sealing complexity and so one can increase the heat seal temperature to decrease the dwell time and increase the rate of the sealing process. The width of the plateau is dependent on the molecular characteristics of seal materials (Farley & Meka, 1994).
Figure 2.4. Correlation between sealing temperature and seal strength of the semi-crystalline materials (Farley & Meka, 1994).
2.2.4 Effect of molecular architecture and crystallinity on heat seal properties
It has been reported that the seal properties are strongly influenced by the molecular structures and rheological properties of seal materials. In order to attain a reliable seal, it is very important for the seal materials to be completely melted under the defined seal process conditions and defuse across the interface to make a strong bridge. For crystalline polymers, a good seal is obtained when all the crystals are melted, diffuse across the interface and form entanglements. More crystalline lamellas and tie chains are produced by increasing the molecular weight. Well-ordered crystalline structures are produced in long and linear chains which provide strong connected anchors to the tie chains (Farley & Meka, 1994; Moreira et al., 2017). It has been shown that low molecular weight chains with short chain branches (SCB) contain a small fraction of crystallinity and easily melt and fuse to the interface in heat sealing process. After the heat sealing, during the cooling, crystalline structures are formed again and strengthen the seal area. The crystalline structure produced by low molecular weight chains with SCB makes weak anchors and so are not responsible of the high seal
strength. Chains with low content of SCB have higher molecular weights and more crystalline structures with strong interconnecting anchors. These high molecular weight segments need more time and temperature to be molted in order to result in a fully sealed area (Mueller et al., 1998). Blending conventional polyethylene (PE which produced by the Ziegler-Natta catalysts) with metallocene polyethylene (mPE) results in a sealant with higher mechanical properties and seal strength, which is due to the narrower weight distribution of mPE. This improvement in mechanical and seal strength is accompanied with more difficulties in process-ability and heat sealing (Jordens, Wilkes, Janzen, Rohlfing, & Welch, 2000; Majumdar & Kale, 2001). It can be concluded that although increasing the molecular weight and molecular weight distribution of the seal material is accompanied with more difficulties in melt processing, but such materials have higher mechanical properties as well as stronger seal strengths.
Najerzadeh and Ajji (Najarzadeh, 2014) indicated that increasing the long chain branches (LCB) of PE results in lower adhesion strength across the seal while higher seal strength is achieved for sealants with more linear structure such as mPE.
2.3 Peelable sealants
The material selection is the first criterion to produce an appropriate sealant for different applications. The selected materials for easy to open films should be sealable through one of the following sealing methods: heat seal, radiofrequency, high frequency, high pressure and ultrasonic (Selke & Culter, 2016) and also should be easily peeled after sealing with low peel force (lower than 650 N/m) (Manias et al., 2009). During heat sealing, the hot jaws come to the direct contact with the outer layer and so first the heat transfers to the outer layer and then transfers to the inner seal layer. In order to prevent the adhesion of the outer layer to the seal jaw, the outer layer should not melt during the sealing process. Therefore, the melting temperature of the outer layer must be higher than that of the inner seal layer. The seal materials as well as the peelable seal materials are preferred to have a low heat seal initiation temperature to ensure a fast production line speed and also, to prevent the melting of the outer layers.
A low heat seal initiation temperature and a wider heat seal temperature window are in favor of a heat seal process with lowest possible complications especially for heat sensitive materials. The seal materials also need to have good hot tack strength that is the strength of the sealant against
irregularly and rigid shapes of the packed products. Low shear thinning to facilitate melt processing should also be considered in selection of the materials for easy opening seal films (Julie W. Gibbons, Alveda J. Williams, Rajen M. Patel, Jeffrey J. Wooster, Enrique Torres, Miguel A. Prieto Goubert, 2006).
Polyolefins are reported to have most of the required properties by the peelable sealants and are the best candidates for the seal layer due to their superior ability to be extruded, molded or blown into different shapes (Wagner Jr., 2009). Low cost, low heat seal initiation temperature and good rheological properties are among the advantages of polyolefins (Coles et al., 2003). Generally, polyolefins are thermoplastic materials derived from polyethylene (PE) or polypropylene (PP) (Wagner Jr., 2009).
Usually, two or more immiscible polymers are melt blended to produce peelable seals. Some examples of immiscible polymer blends that are used for peelable sealants are ionomer/ethylene vinyl acetate (EVA), EVA/polybutene-1 (PB-1), metallocene polyethylene (mPE)/propylene (PP), ethylene acrylic acid (EAA) copolymer/EVA and EAA/PB-1 (Liebmann et al., 2012). PB-1 is used as the minor phase in most of the peelable seal systems (Bai & Wang, 2003, US7055683 B2, 2003, US6630237 B2, 2003; Hwo, 1987; Mohammdi, Ajji, & Tabatabaei, 2015). PB-1 considerably reduces the heat seal initiation temperature and results in a wide range of peelable heat seal temperature. Although blending PB-1 with many polyolefins results in cohesive peelable film, but PB-1 is a polymorphic resin with different crystalline forms. PB-1 exhibits five different crystalline forms in which hexagonal crystalline form I and tetragonal crystal form II are of more interest. During melt crystallization in ambient pressure, crystals form II appear and then spontaneously transfer to thermodynamically stable crystalline phase I at room temperature (Holland & Miller, 1964; Kalay & Kalay, 2002; Qiao & Men, 2017; Stolte, Androsch, & Di Lorenzo, 2014). This phase transition is very slow and may be completed after several weeks. Different crystalline forms of PB-1 exhibit different physical, mechanical and thermal properties, therefore its crystal transformation lead to profound changes in its properties after melt processing (Azzurri et al., 2002; Kaszonyiova M, Rybnikar F, 2005). Nase et al., investigated the peel strength of films blends of LDPE/PB-1 (Michael Nase, Androsch, et al., 2008). Their results showed that after sealing at 413 K crystal-crystal transformation from meta-stable tetragonal form II to stable hexagonal form I,
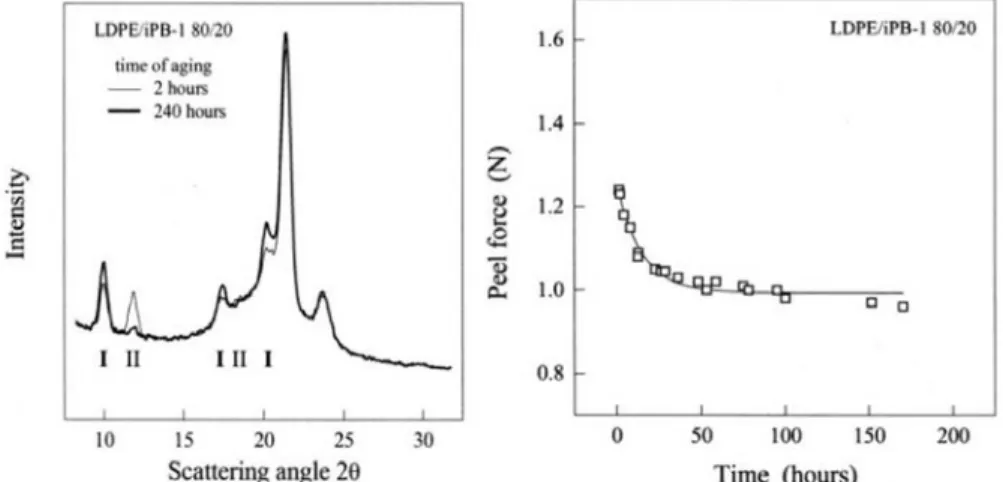
significantly reduced the peel strength of the sealant as it is illustrated in Figure 2.5. This figure also illustrates the wide angle X-ray scattering (WAXS) of the LDPE/iPB-1 containing 20 m% iPB-1 after 2 and 240 hours after sealing at 413 K. As it can be seen in this figure, by increasing the time from 2 hours to 240 hours the intensity of the peaks related to crystals form II at 11.9o decreased while the intensity of the peaks related to crystals form I at 9.9o increased.
Figure 2.5. WAXS of LDPE/iPB-1 containing 20 m% iPB-1 after 2 and 240h after sealing at 413 K (left side), Peel force of the blend of LDPE/iPB-1 containing 20 m% iPB-1 as a function of time after sealing at 413 K (right side) (Kaszonyiova M, Rybnikar F, 2005).
In addition to PB-1, although the blending of different thermoplastics with ionomers are also suggested in the literature, but peelable seal containing ionomers usually show stringiness upon peeling. In the packaging of the dry goods, ionomers may also cause static charge because of the ionic sites in their structure and so statically attract the seal contaminations. Ionomers have undesired odor and are expensive as well (Julie W. Gibbons, Alveda J. Williams, Rajen M. Patel, Jeffrey J. Wooster, Enrique Torres, Miguel A. Prieto Goubert, 2006, US 20050266257 A1, 2005). Application of nanoparticles to achieve easy opening packaging was reported in a few literatures. Kinigakis et al. (US9309027 B2, 2016) produced peelable sealant layer consisting of linear low density (LLDPE) as matrix with EVA resin and nanoparticles as minor phases. A similar formulation for sealant layer was also investigated by Manias et al. (Manias et al., 2009). The synergistic effect of the EVA resin and nanoparticles results in an interface which is strong enough to maintain the integrity of the sealant and is weak enough to dictate peel ability with cohesive failure in a broad range of heat seal temperatures with at least 30 o C heat seal temperature window.
integrity and interfaces in seal area. If polymer A is sealed against polymer A, a symmetric interface (A/A) is formed. In this case, a lock seal performance is achieved if the sealing temperature and dwell time are high enough to let the polymer chains melt and move across the interface and then, recrystallize upon cooling (Najarzadeh, 2014). Asymmetric interface (A/B) is formed either when, polymer A is sealed against polymer B or when, the sealant is heterogenous and made with polymer blends and nanocomposites (Manias et al., 2009; Michael Nase, Zankel, et al., 2008). In general, there are three types of peeling mechanisms in heterogenous systems including adhesive peel, cohesive peel and combination of them (M. Nase et al., 2017). In an adhesive peel fracture, the two interfaces are adhesively connected and cracks propagate exactly from the interface of the two adhered components during the peeling. Thus, no residue is left on the substrate after peeling (Ernesto Mendoza-Navarro, Diaz-Diaz, Castañeda-Balderas, Hunkeler, & Noret, 2013; M. Nase, Großmann, Rennert, Langer, & Grellmann, 2014b; Santos, Ribeiro, Portela, & Bordado, 2001). In a cohesive peel, the two sides of the seal are welded together while, the sealant is peeled from the weak interfaces inside the seal. Cracks are initiated at the interface of the blend components then, propagate in the seal in a zig-zag pass way upon further loading. In the cohesive peel fracture, some residue are left on the substrate and the peeled surface looks white because of the light scattering from the remained microdomains on the peeled surface (Michael Nase, Zankel, et al., 2008). These peeling mechanisms are illustrated in Figure 2.6.
Figure 2.6. Schematic of adhesive and cohesive peeling.
For a sealant to be cohesively peeled, the yield strength of the sealant plays a crucial role (Tetsuya et al., 2005). If the yield strength of the sealant is much lower than the adhesion forces in the seal structure, the sealant yields prior to be peeled. If the yield strength is equal to the adhesion forces
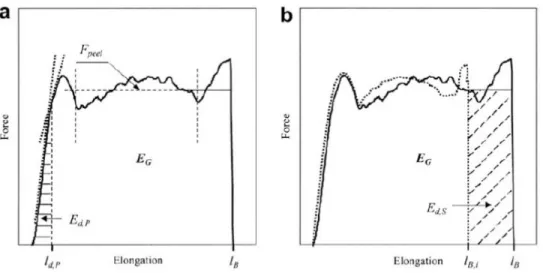
in the seal area, the sealant is yielded and elongated upon peeling. If the yield strength is higher than the adhesion forces inside the seal, the sealant is cohesively peeled. To better understand the fracture mechanisms, usually force-displacement data during the peeling process is necessary. Figure 2.7 indicates an example of the force-displacement diagram upon peeling. The average of the plateau zone is considered as the peel force. The total peel energy, EG, is defined as the whole
area under the force-displacement diagram. Ed,P and Ed,S are the energy dissipated in peel arm and
the energy dissipated due to the seal deformation respectively.
Figure 2.7. A typical force-displacement diagram obtained in a peel test: the continuous curve indicates a real peel curve (a) and the dotted curve is an ideal peel curve without deformation of the seal (b).
If the yield strength is lower than the adhesion forces in the seal layer, Ed,P significantly increased
without having a plateau upon peeling until the breakage of the sealant. If the yield strength of the seal is comparable to the adhesion forces in the seal area, a very small plateau is observed while, the portion of the Ed,S significantly increased. Finally, a wide plateau is achieved when, the yield
strength is higher than the adhesion forces in the seal area (M. Nase et al., 2017; Michael Nase, Langer, et al., 2008).
2.5 Layered silicates nanoparticles for easy opening packaging
Nanoparticles are a big category of particles which at least in one of their dimensions are smaller than 100 nanometers. According to their shape, size and principles of their precursors,
nano-Among various types of nanoparticles which can be used in food packaging applications, layered clay and silicate nanoparticles due to their better availability, superior reinforcements, low cost and simple processability are appropriate candidates for food packaging applications as well as for the use in seal layer (Arora & Padua, 2010). The most common type of layered nanoclays is montmorillonite (MMT) that is a hydrated alumina-silicate layered clay and are consisting of an edge-shared octahedral sheet of aluminum hydroxide between two silica tetrahedral layers (Azeredo, 2009). A very high surface to volume ratio and presence of unbounded atoms in their surface, make them unstable resulting in a high surface energy. To reduce energy and become stable, nanoparticles highly intend to agglomerate that results in inverse effects on their properties. Nanoclays also have high surface area (750 m2/g) and high aspect ratio (100-500) (Arora & Padua,
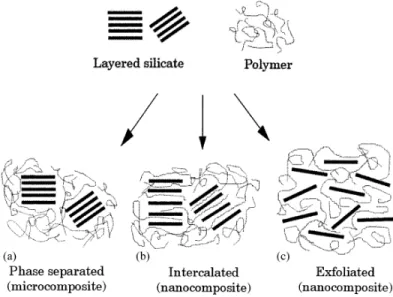
2010; Sinha Ray & Okamoto, 2003a). To take advantage from high surface area of the layered nanoclays, it is very important to disaggregate and disperse them in the polymer matrix. Depending on the dispersion state of the nanoclays in polymer matrix, three main types of polymer-clay nanocomposites morphologies are reported; tactoids, intercalated and exfoliated (LeBaron, 1999). These structures are illustrated in Figure 2.8.
Figure 2.8. Schematic picture of three main structures of polymer-nanoclays hybrids (LeBaron, 1999).
When polymer chains are unable to penetrate and intercalate into the layers of nanoclays, tactoids or phase separation occurs. Diffusion of a single or more than one polymer chain into the layers of the nanoclays results in intercalated nanocomposites. The structure in which layered nanoclays are completely separated and dispersed in polymer matrix is known as exfoliated. X ray diffraction (XRD) and transmission electron microscopy (TEM) are usually used to study nanoclay dispersion in the polymer matrix. According to the Bragg’s law (λ=2d sin θ), λ is intensity of diffraction peak, d is distance between nanoclays and θ is diffraction angle, by increasing the distances between layers of nanoclays, diffraction peak is shifted to a smaller diffraction angle. In an exfoliated structure, no peak is observed in XRD patterns due to the large space between the layers. In an exfoliated structure, TEM technique is used to study the morphology of the nanocomposites. Appearance of a broad peak at a very low diffraction angle (less than 2θ = 10 o) may be due to
coexsiting exfoliated and intercalated structures. In this case, XRD is not sufficient to characterize the morphology of the nanocomposites and TEM should be exploited as well (Alexandre & Dubois, 2000; Krishnamoorti, Vaia, & Giannelis, 1996). Figure 2.9 and Figure 2.10 illustrate the examples of the XRD patterns and TEM images to characterize morphology of nanocomposites.
Figure 2.9. Phase separation in nanoclay/HDPE nanocomposites (a), exfoliated structure in the same nanoclay/PS nanocomposites (b), and exfoliated structure for the same nanoclay/silicone rubber nanocomposites (Alexandre & Dubois, 2000).
Figure 2.10. TEM images of styrene based nanocomposites. Intercalated microstructure of octadecylammonium-exchanged fluorohectorite/PS nanocomposites (left side) and exfoliated microstructure of bis(2-hydroxyethyl) methyltallow-exchanged montmorillonite/epoxy nanocomposites (right side) (Krishnamoorti et al., 1996).
It is well-known that dispersion and distribution of nanoclays (exfoliated or intercalated) are the key factors controlling the final properties of nanocomposites such as mechanical (Fu & Naguib, 2006; Rhim, Hong, & Ha, 2009; Shah, Shukla, Shah, & Imae, 2016), thermal (Fukushima, Tabuani, Arena, Gennari, & Camino, 2013; S. W. Kim & Cha, 2014; Krump, Luyt, & Hudec, 2006; Modesti, Lorenzetti, Bon, & Besco, 2006; Molinaro et al., 2013; Sharma & Nayak, 2009; Yourdkhani, Mousavand, Chapleau, & Hubert, 2013), optical (Munhoz et al., 2017), electrical (Jlassi et al., 2016; Ma et al., 2014), barrier (Fereydoon, Tabatabaei, & Ajji, 2014; J.-K. Kim, Hu, Woo, & Sham, 2005; S. W. Kim & Cha, 2014) and rheological properties (Hajir Bahrami & Mirzaie, 2011). In melt processed polymer/clay nanocomposites, surface modification of clay nanoparticles and incorporation of compatibilizer are the most common approaches to increase the polymer/clay interactions and thus, enhance the dispersion and distribution of nanoclays in polymer matrix (Arora & Padua, 2010; Kiliaris & Papaspyrides, 2010; Pavlidou & Papaspyrides, 2008; Sinha Ray & Okamoto, 2003b).
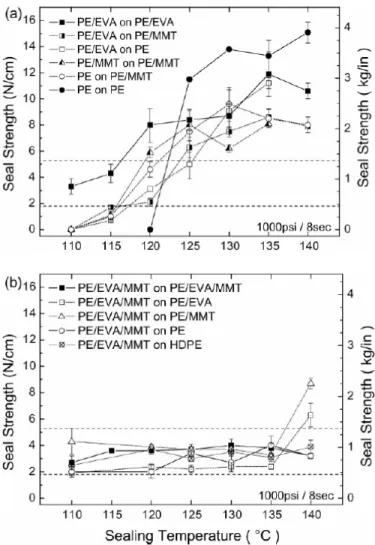
Despite significant breakthroughs in polymer nanocomposite in vast variety of applications, very limited studies have been conducted on the clay/nanocomposites for seal applications. Manias et al. (Manias et al., 2009) investigated the effect of incorporation of dioctadecyldimethyl ammonium-modified montmorillonite on peel behavior of PE/EVA/clay nanocomposites sealants. Their results showed that the presence of the EVA helped for a better dispersion of the nanoclays
in the matrix and also reduced the melting temperature of the PE. Samples without nanoparticles showed a peelable seal in a narrow heat sealing temperature window (about 5 0 C wide). The samples with both the nanoparticles and EVA in their formulations revealed a peel behavior in a broad temperature window (25-30 oC wide) with almost consistent peel strengths as depicted in Figure 2.11.
Figure 2.11. Seal strength of 24.5 mm flat sealants, seals at 1000 psi pressure and 8 s dwell time to fully equilibrate the seal interface (Manias et al., 2009).
The seal strength consistency of the PE/EVA/MMT nanocomposite sealants, clearly indicated that this behavior was the inherent property of the nanocomposite sealant and did not arise from sealing interface or sealing process. The traces of the EVA and MMT on the peeled surfaces were observed by ATR-FTIR and ESEM. The peel behavior of the PE/EVA/MMT nanocomposite seals were
Idiyatullina et al. (Idiyatullina, Vol’fson, Sabirov, & Yarullin, 2012) clearly showed that how montmorillonite clay nanoparticles increase the mechanical and thermal properties of PB-1. They indicated that adding 5 wt % of Cloisite15A into PB-1 accelerated its crystal transformations from the meta-stable form II to the stable form I. In the pure PB-1 resins, the phase transition from the form II to the form I occurred after 13.5 h and after 8 days the content of the form II in the resin was 6 %. While in montmorillonite containing PB-1, the phase transition occurred after 2.2 h and after 72 h the content of the crystal form II in the matrix was only 3 %.
Aithani and Brigges (Aithani & Briggs, 2009) invented different peelable films containing clay nanoparticles and showed incorporation of nanoparticles resulted in peelable sealant films with a wide range of heat seal temperatures. They also showed that incorporation of nanoclay in the seal layer significantly decreased the peel force as well as the aging of the films.
2.6 Morphology of immiscible polymer blends
Polymer blending is usually used to develop new materials with tailored properties (Rizvi & Park, 2014; Rizvi, Park, & Favis, 2015). Melt processing is typically employed to produce polymer blends with variety of morphologies for different applications. It is well-known that morphology of a blend significantly affects the rheological (García-Morales, Partal, Navarro, & Gallegos, 2006; McNally et al., 2002; Souheng Wu, 1987), mechanical (Heshmati, Zolali, & Favis, 2017; Meincke et al., 2004; Sepehr Ravati, Beaulieu, Zolali, & Favis, 2014; Zolali, Heshmati, & Favis, 2017) and thermal (Dell’Erba, Groeninckx, Maglio, Malinconico, & Migliozzi, 2001; Kubo & Kadla, 2004) properties of the blends. For binary immiscible polymer blends, there are four basic morphologies as illustrated in Figure 2.12; matrix/disperse, matrix/fiber, lamellar structure and co-continuous morphologies (Pötschke & Paul, 2003).
Material parameters such as viscosity ratio (Everaert et al., 2000; Favis & Chalifoux, 1987; Heino, Hietaoja, Vainio, & Seppälä, 1994), blend composition (Favis, 2000; Michael Nase et al., 2009; Sundararaj & Macosko, 1995; Tokita, 1977), elasticity (Levitt, Macosko, & Pearson, 1996), interfacial modification (Favis, 2000; Sundararaj & Macosko, 1995) and process conditions such as shear rate (Favis, 1990; M. Nase, Langer, & Grellmann, 2009; Xi, Jun, & Guo, 2006; Zeng,
Aoyama, & Takahashi, 2003), melt temperature (M. Nase et al., 2009; Potente, Bastian, Gehring, Stephan, & Pötschke, 2000; Xi et al., 2006) and mixing time (Bourry & Favis, 1998b; Xi et al., 2006) significantly affect the final morphology. However, the effect of the morphology of the seal on peel performance is not well understood and very limited literature addressed this effect.
Figure 2.12. Different morphologies for binary immiscible blends. a) Dispersed structure (TPU/PP 80/20); b) Fibrillar structure (PA6/SAN 30/70); c) Lamellar structure (PP/EPDM 80/20) and d) Co-continuous morphology (PE/PS) (Pötschke & Paul, 2003; Zumbrunnen & Inamdar, 2001). Since, the majority of the sealants of this research have been made of immiscible polymer blends with and without nanoclay, the following sections of this literature review are paid on the main parameters which control the morphology of binary polymer blends, the effect of organoclay on the morphology of binary blends and nanoclay localization in binary polymer blends.
2.6.1 Effective parameters on morphology of polymer blends
2.6.1.1 Effect of interfacial tension
According to the equation (2.1), the reversible work that is required to create a unit surface area is defined as the surface tension where, γ is the surface tension, G is Gibbs free energy, A is interfacial (surface) area, T is temperature, p is pressure and n is the total number of moles of matter (S Wu, 1982).
Generally, for homologous series under the infinite molecular weight, the surface tension tends to increase by increasing the molecular weight. At infinite molecular weight, surface tension is independent of the molecular weight (S Wu, 1982). The dependence of a polymer surface tension to the molecular weight (under the infinite molecular weight) is expressed by either one of the equations (2.2) or (2.3) (S Wu, 1982): σ1/4 = σ ∞ 1/4− 𝑘𝑘 1⁄ 𝑀𝑀𝑛𝑛 2.2 σ = σ∞− 𝑘𝑘2⁄𝑀𝑀𝑛𝑛2/3 2.3
σ∞ is the surface tension at the infinite molecular weight, k1 and k2 are semi-empirical parameters
and Mn is the number average molecular weight. For molecular weights less than the infinite
molecular weight, Eq. (2.3) is more accurate than Eq. 2 (Jalbert et al., 1993) for polymers. Wu also proposed:
𝑘𝑘2 = (σ∞− σ𝑒𝑒)(2𝑚𝑚)2/3 2.4
in which σ𝑒𝑒 is surface tension of the endgroups and m is formula weigh of a repeat unit (S Wu, 1982) According to Eq. (2.4), in low molecular weights, the surface tension depends on the sign of (σ∞− σ𝑒𝑒). If the surface tension of the end groups is less than that of polymer backbone, it is
predicted that the surface tension of polymer increases by increasing the molecular weight, same as homologous polymer. Jelbert and Kobelstein (Jalbert et al., 1993) investigated the correlation between the molecular weight and the surface tension of poly(dimethylsiloxane) (PDMS) with three different end groups of methyl, amine and hydroxyl. Their results showed that for amine terminated PDMS, the surface tension decreased by increasing the molecular weight. The surface tension of methyl terminated PDMS increased by increasing the molecular weight and surface tension of hydroxyl terminated PDMS was independent of the molecular weight (Figure 2.13). They attributed this effect to the difference between surface tension of polymer backbone and the end groups.