O
pen
A
rchive
T
OULOUSE
A
rchive
O
uverte (
OATAO
)
OATAO is an open access repository that collects the work of Toulouse researchers and
makes it freely available over the web where possible.
This is an author-deposited version published in :
http://oatao.univ-toulouse.fr/
Eprints ID : 12672
To link to this article : DOI :10.1109/GIIS.2013.6684364
URL :
http://dx.doi.org/10.1109/GIIS.2013.6684364
To cite this version : Houaidia, Chiraz and Van den Bossche, Adrien
and Idoudi, Hanen and Val, Thierry and Azzouz Saidane, Leila
Novel
Link Availability Aware Metrics for Routing in Wireless Mesh
Networks
. (2013) In: IEEE International Global Information
Infrastructure Symposium - GIIS 2013, 28 October 2013 - 31 October
2013 (Trento, Italy).
Any correspondance concerning this service should be sent to the repository
administrator:
[email protected]
Novel Link Availability Aware Metrics for Routing
in Wireless Mesh Networks
Chiraz Houaidia
∗§1, Adrien Van Den Bossche
§2, Hanen Idoudi
∗3, Thierry Val
§4, Leila Azouz Saidane
∗5∗National School of Computer Sciences(ENSI),
University of Manouba, Campus Universitaire de la Manouba, Tunisia 1[email protected], {3hanen.idoudi, 5leila.saidane}@ensi.rnu.tn
§CNRS-IRIT-IRT, University of Toulouse, UT2 {1chiraz.houaidia,4val,2bossche}@irit.fr
Abstract—This paper presents two novel metrics, Link Occu-pancy aware routing Metric (LOM) and Residual Link Capacity based routing metric with Interference Consideration (RLCIC), for accurately finding high-throughput paths in multihop wireless mesh networks. The first metric is load-sensitive and aims to balance the traffic load according to the availability of a link to support additional flows. The second metric reproduces better the capacity of a link since it is based on its residual bandwidth. It captures accurately the available path bandwidth information when considering both the intra-flow and the inter-flow interferences. Using several real experiments carried out into an heterogeneous IEEE 802.11n based network running with OLSR routing protocol, we have shown that our first proposal can accurately determine better paths in terms of throughput and delay, thereby significantly outperforming the other existing metrics. The consistency of the second metric RLCIC is proved formally based on notions of graph theory.
Index Terms—Wireless Mesh Network, QoS Routing, Routing Metrics, Interference, Testbed.
I. INTRODUCTION
Wireless Mesh Networks (WMNs) are a flexible, quickly deployable wireless networking solution that benefits from the lack of a rigid infrastructure. They are used to provide rural areas, where broadband infrastructure is not available, with a reliable Internet access based on multihop connections. WMNs are composed of typically stationary wireless routers (backbone) to interconnect isolated mesh LANs. The lack of mobility and power constraints made wireless mesh routing protocols more and more optimized to consider link-quality metrics such as transmission capacity or error probability instead of simplistic hop-count metric used generally with adhoc networks. This new paradigm is called quality-aware routing.
Providing efficient quality of service (QoS) support is essential for such networks, as they need to deliver real-time services like video, audio, and voice over IP besides the traditional data service. Then, identifying paths with maximum available bandwidth is one of the main issues concerning QoS in WMNs. The available path bandwidth is defined as the maximum additional rate a flow can push before saturating its path [1]. We focus mainly, on the one hand, on finding the
This work is carried out as a part of the project tetaneutral.net
widest path to transmit one flow without violating the existing flow’s bandwidth guarantee.
On the other hand, since it is not possible in large wireless networks to separate concurrent transmissions completely in frequency, some transmissions will necessarily occur at the same time in the same frequency band and the signals from many undesired or interfering transmitters are added to the desired transmitters signal at a receiver. This interference can be controlled in a centralized manner with an efficient scheduling algorithm. However, wireless communications may require, from MAC level, distributed solutions based on carrier sensing concept or, from routing level, interference aware routing metrics. We focus mainly on finding the widest path when accouting for intraflow and interflow interferences.
The purpose of this paper is to investigate the requirements for designing routing metrics in mesh networks to support some QoS requirements, such as high throughput and low packet delay. We proposed and implemented two novel metrics that we added to OLSRd program (OLSR daemon) [2], one of the most-known implementations of OLSR [3] which implements basically hop count and ETX [4] as metric. An interference aware version of the second routing metric is formally proved with notions of graph theory.
The remainder of this paper is organized as follows: Section II presents an overview of the most known routing metrics for WMNs. Section III presents our proposals with experimental results showing its performances when compared to hop-count metric and ETX metric. Section IV presents the design of our residual link capacity based routing metric with interference consideration. We conclude by Section V.
II. RELATEDWORK
In ad hoc networks, where mobility and power saving are the main problems, the most convenient metric is hop count. This metric, coupled with a routing strategy, allows a fast recovery of instable routes due to link breakage. On the other hand, as mesh routers are, most of the time, stationary, wireless mesh routing protocols are optimized to consider link quality metrics [6]. New metrics, such as ETX, ETT, WCETT, MIC, etc. [14], are proposed towards a quality-aware routing, in order to reflect more the link variations such as transmission capacity, loss probability, interferences, etc.
The Expected Transmission Count (ETX) metric [4] is a proposal to better suit wireless networks where link fluctua-tions and packet losses are inevitable. It represents the number of times a node expects to transmit and retransmit a packet for a successfull delivery.
With ETX metric, the link quality estimation is based on small probe size (some bytes) which doesn’t properly reflect the data loss probability. Moreover, ETX assumes all links run at one bit-rate and probes are sent in broadcast at the network basic physical rate. So, this metric assumes a robust physical layer which is not the case at all [6].
To cope with some of these problems, authors in [16] proposed Expected Transmission Time (ETT) metric. The ETT of a link is defined as the expected MAC layer duration for a successful transmission of a packet. By accounting for both the link capacity and quality of a link, this metric offers a better estimation and ensures both reliability and efficiency. However, this metric is still not considering interferences and availability of a link.
Weighted Cumulative Expected Transmission Time (WCETT) [14][16] is the first multi-channel metric for mesh networks. It is determined by the amount of time used by a frame to attend a destination and the maximum time period consumed on links sharing the same channel. The main motivation for WCETT was to specifically reduce intra-flow interference by minimizing the number of nodes on the same channel in the end-to-end path. However, WCETT is a non isotonic metric and requires complex routing protocol to calculate the minimum cost. The isotonicity property is introduced in [9]:
Following the WCETT metric, a new metric, the Metric of Interference and Channel Switching (MIC) [14] was proposed. It aims to capture both the intraflow and interflow interfer-ences. Composed of two major parts, it ensures that minimum weight paths can be found by both Bellman-Ford and Dijkstras algorithms and no forwarding loop can be formed in link-state routing. MIC is, however, non isotonic and may require decomposition into isotonic link weight assignments in a virtual network and hence efficient algorithms can be used to find minimum weight paths.
Among these metrics, some improvements of ETX, such as ETT metric, only consider the total capacity of a wireless link and do not account for possible degradation of the bandwidth due to interferences or parallel data transmissions. Some other proposals only treat the intraflow or the interflow interferences but not both at the same time. We have made, in a previous work [6], an experimental performance study of some of the proposed metrics and based on the results found we propose, in this work, new routing metrics specifically designed for wireless mesh networks. These metrics aim to accurately measure the available capacity of a link when taking into account both the current use of the link and possible interferences with neighboring links.
III. LINKAVAILABILITYAWAREROUTINGMETRICS
A. Link Occupancy Aware Routing Metric
The purpose of our first metric is to measure the occupancy level of a link and, based on this estimation, select links which are ”freer” and the most available to transmit data traffic. For that, we model our network as an oriented graph G= (E, V ) where E denotes the set of links and V denotes the set of vertices representing the network’s nodes. This model allows us to consider bidirectional traffic. We define Link Occupancy Ratio (LOR) as the load of a link i.e. the amount of data traffic occupying the link during a time window ω in both forward and reverse directions. If a link is not used by any flow, its LOR would be theoretically equal zero and its total capacity is available for data transmission. Such ”free” link would be a potential alternative for current flow transmission so that we avoid overloaded routes where risk of congestion and data loss is inevitable.
The LOR of the link l between two nodes n1 and n2 is expressed as follows : LORl = T x(n1,n2) B(n1,n2)× ω + T x(n2,n1) B(n2,n1)× ω (1) Where T x(n1,n2)and T x(n2,n1)are respectively the reverse
and forward amount of transmitted data occupying the link l during a time window ω. B(n1,n2) and B(n2,n1) are
respec-tively the transmission data rate of each source node. ω is the time window during which the data traffic flow through the link l is captured. For the rest of our experiments, ω is set to 10 seconds in order to have enough trafic and to have situations of overloaded links.
We define also the Data Loss Ratio (DLR) of a link l which represents the amount of lost data among those transmitted during ω. This component provides information about the possible congestion or interference phenomenon that may affect the data packet delivery. The DLR of a link l between two nodes n1 and n2 is given by the following equation :
DLRl = T x(n1,n2)− Rx(n2,n1)
T x(n1,n2)
(2) Where Rx(n2,n1) represents the amount of successfully
received data by the node n2 from the node n1.
Thus, the link quality of a link l is estimated by the Link Occupancy Metric (LOM) and is expressed as follows :
LOMl = αLORl + (1 − α)DLRl (3) The parameter α∈ [0,1] and is used to delimit the metric so that the LOM value is still a ratio (∈ [0,1]). For the rest of our experiments, α is set to 0.5 in order to have a fair relation between the link load and the data loss ratio through that link. If α is set to 1, this means that we only consider the link load to assess the occupancy of that link and we neglect the data loss fact. If it is set to zero, our metric, then, will be typically the role of ETX metric.
Using this metric, only links with reduced occupancy are se-lected to form a route between a source node and a destination node so that routing decision is based on link’s availability to support more traffic flows. Bottelneck or lossy links with high occupancy rates are supposed to be bad links. The occupancy level of a path is the sum of link occupancies of links forming the path.
As described, our metric, accounts for the bandwidth hetero-geneity in the network and exploits this aspect towards a high-throughput routing. In addition, unlike ETX which is based on small probes to estimate the loss ratio, our metric estimation is more accurate since it is based on real data traffic and real transmission conditions.
B. Residual Link Capacity Based Routing Metric
The Link Occupancy Metric of all links is initiated to zero until having a traffic across the link. Then, during the first 10 seconds and until an update of link occupancy information, the route choice is randomly done and the protocol may consider a route with bad performances or bad link quality. Then, the routing metric should be better initialized to allow the routing protocol to a good start.
On the other hand, given two links with two different link occupancies, the route decision may be made and changed based on a minimal difference of 10−6 which increases the frequency of route switching and makes the routing unstable. To illustrate this phenomenon, consider two links link1 and link2 with data rates of, respectively, 300Mb/sec and 160 Mb/sec. Link1 is already supporting a data traffic of 2Mbits. Having 2Mbits of additional data traffic to transmit, the routing protocol should select, between link1 and link2, the best link to convey this traffic flow. Based on this scenario, the routing decision would be fluctuating so that it changes at every iteration.
To overcome these limitations, we propose a novel routing metric based on the residual link capacity. This proposal is motivated by the inability of the Link Occupancy Metric to measure accurately the capacity of a link to support a specific amount of data. Indeed, even if it accounts for the transmission rate heterogeneity, the link occupancy information is still expressed in terms of ratio and thus doesn’t accurately reflect the real residual capacity in terms of bandwidth i.e. that such metric doesn’t distinguish between two links having the same link occupancy but not the same bandwidth. Thus, a residual link capacity based metric may be more adaptive since it is relative to the amount of data to transmit, more accurate compared to a percentage based information and more efficient since it allows a more stable routing.
The Residual Link Capacity based metric (RLC) is given by the equation below:
RLCl = Bl −T xlω (4)
Where Bl is the link bandwidth and Tx corresponds to the traffic occupying the link during the time window ω. Between two links, the routing protocol selects the link with the greater
RLC. The route’s RLC corresponds then to the minimum of RLCs of links composing the route.
RLCroute = min(RLCl)l∈route (5) Using this metric, each link is initialized to its bandwidth so that the routing protocol can choose from the start the route offering the greater bandwidth and thus supporting the greater traffic.
Since it is based on real exchange of data in the network, the RLC based metric gives a real estimation and thus allows a more efficient routing.
In order to evaluate the effectiveness of our metrics, this paper presents measurements taken from the BlueMeLab [5] testbed network described hereafter. We made some compar-ison with the hop-count metric as a simplistic routing metric and ETX as a link quality aware routing metric.
C. Performance Evaluation
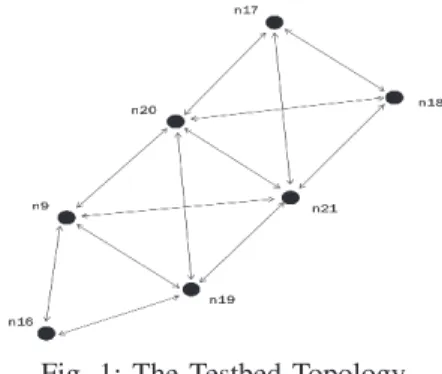
1) Configuration and Testbed Setup: we run experiments in an indoor testbed [5][6] formed by seven nodes: four shuttles, two personal computers and one nanostation router. Device configurations are presented in a previous work [6]. All nodes are 2x2 MIMO devices equipped with the ath9k driver [7] and are using OpenWRT [8] operating system. Our testbed called BlueMeLab [5] is deployed at the University Institute of Technology (IUT) Blagnac-Toulouse, France. The nodes are spread over two floors of the building. Rooms are separated by thick bricked walls.
Fig. 1: The Testbed Topology.
To measure ETX, olsrd, instead of creating new probe messages, uses HELLO and TC messages of OLSR which are sent periodically each 2s and 5s respectively. This method aims to avoid extra overhead. All the performance evaluation in this paper are the result of measurements taken on the wireless testbed presented hereby.
2) Experimental Results: this section presents experimental results that show that LOM and RLC often find higher-throughput paths than minimum hop-count and ETX. First se-ries of experiments compared the throughput realised by hop-count, ETX and LOM metrics. We ommit the performances of RLC in the following figures because results are somehow the same of that of LOM. So, lines corresponding to RLC metric are ommited just for a better visibility. To carry out
our performance tests, we first identified all possible routes in the network for each metric : Hop-count, ETX and LOM. We, then, compared the throughput of cumulative pair of nodes of paths found by OLSR using each metric between 42 total node pairs. The throughput is measured through TCP transmissions between each pair.
Results are plotted in Figure 2 and show that OLSR using LOM often finds faster routes than hop-count which doesn’t account for any link quality and ETX which assumes all links run at one bit rate and doesn’t account for the multi-rate aspect. In fact, in the right half region where throughputs are the highest, there is much more blue points showing high-throughput paths selected by LOM.
0 1 2 3 4 5 6 7 8 9 10 11 12 0 50 100 150 200 250 300
Cumulative Pair of Nodes
Throughput (Mbits/sec)
HC ETX LOM
Fig. 2: Cumulative Pair Throughput.
The extreme right half corresponds to one hop routes where nodes can communicate directly. At these cases, the minimum hop-count metric finds the one-hop route as the best route, and there is no opportunity for ETX or LOM or RLC to perform better. The left half region, however, corresponds to routes with 2 hops or more. In this region, the sensitivity of LOM and RLC to differenciate high throughput paths allows them often to find better paths than hop-count and ETX.
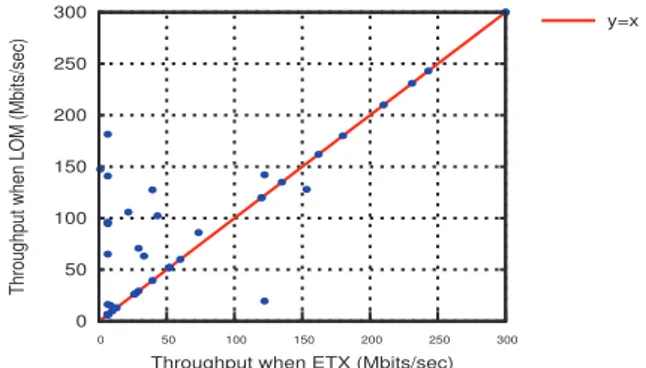
Figure 3 shows the same data as Figure 3, but organized in a per-pair basis so that we can compare between the performances of ETX metric and Link Occupancy Metric for individual pairs. Each pair of nodes is represented by one point: the y value is the throughput obtained by OLSR using LOM, and the x value is the throughput obtained by OLSR using ETX. The line y=x corresponds to cases where ETX and LOM choose both the same path or paths with the same throughput. Points above the line y=x are pairs where LOM outperformed ETX. Results of Figure 3 show largely better performance of LOM compared to those of ETX. This is illustrated by the dense region above the line y=x where points with x near zero and y relatively higher. That region shows that routing based on LOM finds often paths with higher throughputs. In fact, with ETX metric which is load-insensitive, links with good quality are always used to transmit data traffic even when they become overloaded or supporting many simultaneous data flows. With LOM, however, the routing decision is load-sensitive and can dynamically switch to links less occupied or offering a total unused bandwidth
higher than the residual capacity of first chosen link. Hence, this metric allows a load-balancing routing so that all links in the network would be used fairly.
0 50 100 150 200 250 300 0 50 100 150 200 250 300
Throughput when LOM (Mbits/sec)
Throughput when ETX (Mbits/sec)
y=x
Fig. 3: Per Pair Cumulative Throughput.
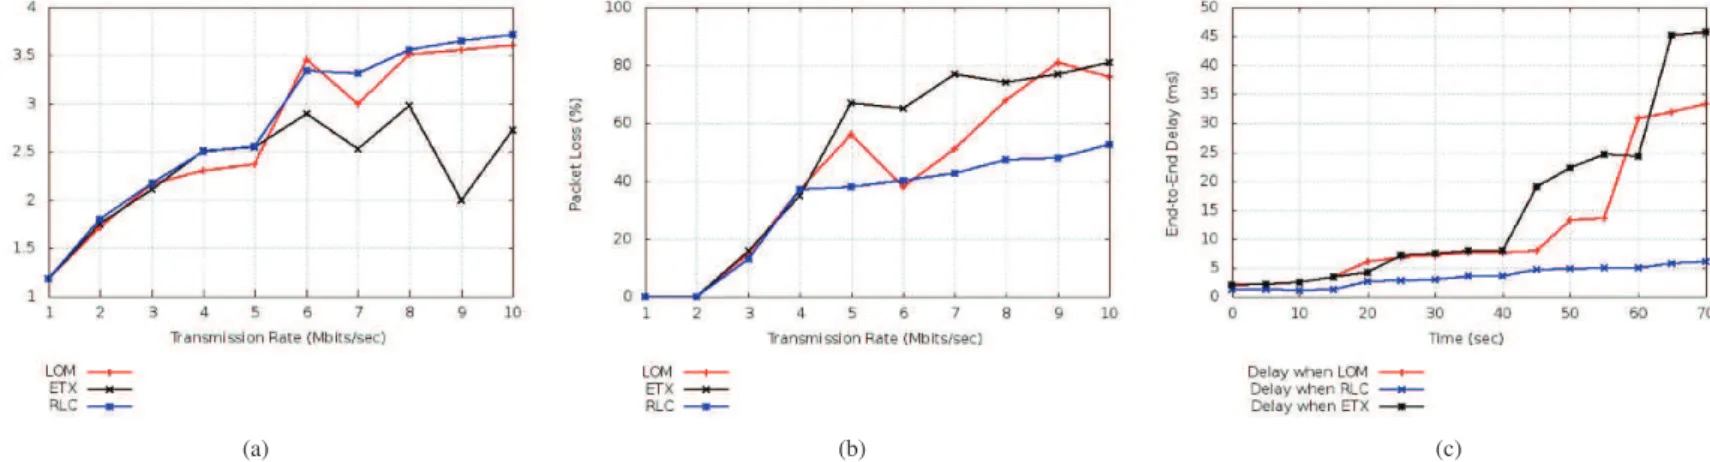
In the rest of this section, we compared the performances of OLSR using ETX, OLSR using LOM and OLSR using RLC in terms of throughput, delay and packet loss. For that, we choose one representative pair of nodes to carry out our performance tests. Nodes are numbered as shown in Figure 1. This pair includes the node n17 and the node n16 which are distant enough to have different routes with different characteristics (distance between nodes, number of hops, link quality, etc.). In this series of experiments, we generate an UDP traffic from node n17 to reach node n16 while varying the transmission rate and we pick up the average throughput of 10 series of tests. Figure 4a plots the average throughput for each metric experienced by node n17 when pinging node n16. For the three metrics, the throughput increases with transmission rate. For small amount of data, the three metrics are achieving the same throughput because they are using the same route. For greater data traffic, some links would be then more occupied and loaded compared to others. In that case, based on LOM and RLC, OLSR would change route and choose links with a better availability which explains the variations in the pattern of OLSR-LOM and OLSR-RLC.
Figure 4b shows the average packet loss of the same scenario described above. For light traffic, the pattern is approximately the same for the three metrics. By increasing the transmission rate, the packet loss also increases greatly. We note, however, for higher transmission rates, a slightly higher packet loss with ETX. Indeed, the more the link is overloaded by heavy traffic, the more is the risk of loss because of congestion or timeout in queues, particularly at bottelneck nodes such as node n19 which is the most used with ETX. This phenomena is avoided with LOM since it is a load-sensitive metric and can dynamically adapt the routing decision based on the bandwidth availability of other links in the network. However, using Link Occupancy Metric, the increase of packet loss is considerably higher at important transmission rates and is represented by several pics which shows in general the route switch. Residual Link Capacity based routing is more regular because it reproduces physical conditions and
(a) (b) (c)
Fig. 4: Performance comparison between OLSR-ETX, OLSR-LOM and OLSR-RLC, (a) Throughput (b) Packet Loss Rate (c) End-to-End delay.
ressources availability better than LOM based routing. Figure 4c shows the end-to-end delay to reach node n16 from the node n17. For all metrics, as the transmission rate increases, the packet loss rate also increases over the time. Compared to OLSR-RLC, this increase is particularly impor-tant with Link Occupancy based routing as we note several pics especially for higher transmission rates (from 5Mb/sec). These delays are caused essentially by buffering and queuing delays at intermediate nodes. Since both metrics are load-sensitive, packets are crossing different paths when the traffic is getting higher. However, using Link Occupancy Metric, the routing decision can change frequently, as explained in section III-B, according to the availability of freer links. These ”freer” links don’t always offer more bandwidth to support large amount of data which causes congestion and huge buffering delays. Using Residual Link Capacity, the route decision changes only if there’s links with larger residual bandwidth and then are more convenient to support larger data traffic which explains the regular increase of the delay pattern of that metric. This metric is improved to consider intraflow and interflow interferences. We describe here after the interference model adopted in this work and the bandwidth estimation of each link. Our new metric Residual Link Capacity Based Routing Metric with Interference Consideration (RLCIC) is designed based on this information.
IV. RESIDUALLINKCAPACITYBASEDROUTINGMETRIC WITHINTERFERENCECONSIDERATION
A. Preliminaries
In this section, we give an overview of the clique-based method for computing the available path bandwidth.
In wired networks, nodes are able to know the amount of available resources in the medium and how much bandwidth is being used. However, in wireless networks, where the medium is shared between multiple nodes, communication from one node may affect the bandwidth of neighboring nodes. Therefore, the bandwidth consumed by data flows and the
available resources to a node are not local concepts, but related to the neighboring nodes in carrier- sensing range [9]. Generally, we distinguish two types of interferences:
intra-flow interferencesand inter-flow interferences. Intraflow interference occurs when a data packet is being transmitted over multiple links along a path. In order to avoid conflict at the receiving node, some links may remain idle. Interflow interference occurs when different flows are being transmitted at the same time and then sharing the same available resource. In other words, the interflow interference affects the amount of residual channel resources on each link that will be allocated for a new flow [9][10].
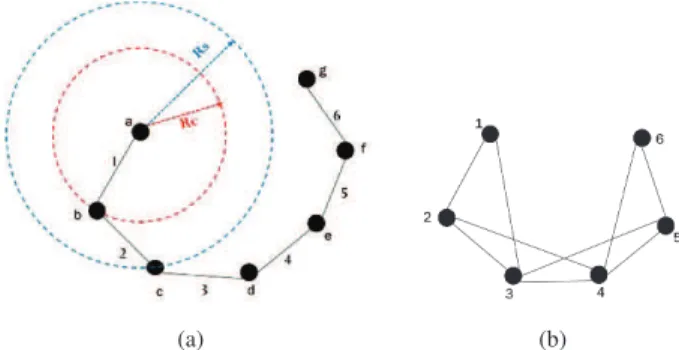
To model the interference relationship between links, one common method is the use of interference conflict graph (or conflict graph for short). This method is used in several existing works [1][9][11][12]. Given a wireless network, each link becomes a node in the conflict graph. If two links in the wireless network interfere with each other i.e. cannot be active simultaneously, we put an edge between the corresponding nodes in the conflict graph. The example depicted in figure 5 illustrates the interference modeling using conflict graph. The wireless network based on a six-link chain topology is given in Figure 5a and the corresponding conflict graph is given in Figure 5b. Assuming that all nodes have the same transmission or communication range Rc and the same interference or sensing range Rs as respresented, we conclude that link 1 and 2, for example, conflict with each other because node b cannot transmit and receive at the same time. Link 1 and 3 conflict also with each other because node cs transmission will introduce enough interference for the reception at node b.
An interference clique in the wireless network is a set of vertices that mutually conflict with each other. In the conflict graph, the corresponding nodes of these links form a complete subgraph.
A maximal interference clique is a complete subgraph that is not contained in any other complete subgraph. For example, {1, 2, 3} and {3, 4, 5} are maximal cliques while {1, 2} and
(a) (b)
Fig. 5: Illustration for interference model. (a) The original graph, (b) The conflict graph.
{1, 3} are not maximal cliques.
The size of a maximal clique depends on how many links interfere with each other, which depends on the interference model adopted in the network.
Our work is based on the 802.11 MAC protocol where every reception of a data packet is acknowledged by an ACK packet. Therefore, for a packet transmission to be successful, both the sender and the receiver should not be interfered by other nodes. In other words, the transmissions on links(u, v) and (s, d) are successful at the same time if and only if both s and d are outside the interference ranges of u and v.
This model is referred as the bidirectional transmis-sion model and the Transmitter-Receiver Conflict Avoidance
(TRCA) interference model and is adopted by many existing works [13]. Following [9], we define the transmission range of a node to be one hop, while the interference range to be r hops and to simplify our discussion, we set r= 2. We use the previous network to illustrate the TRCA interference model. The conflict graph in Figure 5b assumes r= 1 which is not the TRCA interference model we are using in this paper. Based on the network in Figure 5a, under TRCA model, when node a sends data to node b, node d is not allowed to transmit since it is in the interference range of b. This means that links 1 and 4 interfere with each other. Then, each maximal clique contains four consecutive links.
Relying on this clique-based formulation, we describe below the method to capture bandwidth sharing among links within the path. Given a wireless network, we denote {Q1; ...; Qk} as the maximal interference clique set of the network, Cq as the capacity of a clique q, B(l) as the total bandwidth of link l and B(p) as the estimation of the available bandwidth of path
p. Then, considering a path p=< l1, l2, ..., lh>, the available bandwidth of the path p is estimated as follows [10]:
B(p) = min q∈Qp Cq; Cq = 1 ! l∈q( 1 B(l)) (6) The rationale behind the formula is: transmissions on the links in a clique cannot be concurrent but occur in a serial manner. Thus,!(B(l)1 ) represents the time it takes for 1 Mbit data to traverse all the links in the clique q. Cq is thus the bandwidth available over the clique q. The available bandwidth
of the path is the bandwidth of the bottleneck clique. Proof. Consider two neighboring links i and j along a path. Links i and j have available bandwidth Bi and Bj , respectively. We denote the equivalent achievable bandwidth over links i and j by B(ij). Since the two links can not be active simultaneously, the time for L Mbits data to traverse the path formed by links i and j satisfies :
L B(ij)= L Bi + L Bj (7) It follows : B(ij) =Bi× Bj Bi+ Bj (8) Let’s illustrate the example in figure Figure 5a: Consider the path p=< a; b; c; d; e; f >. Let B(1), B(2), B(3), B(4) and
B(5)of the network in Figure 5a be 10, 50, 25, 20 and 5 Mbps, respectively.
There are two maximal cliques on this path and they are {1, 2, 3} and {3, 4, 5}.
Based on the TRCA interference model, since all maximal cliques in the conflict graph are containing at least four interferring links, the formula for estimating the available bandwidth of a path p becomes as follows:
B(p) = min1≤k≤(h−4)Ck; Ck= 1 1 B(k)+ 1 B(k+1)+ 1 B(k+2)+ 1 B(k+3) (9) Where B(k) represents the available bandwidth of the link (lk, lk+1). For further details about this clique-based estima-tion, interested readers can refer to the following works [10]. According to the example in Figure 5 and under TRCA interference model, the estimated path bandwidth of the path p=< a, b, c, d, e, f > is: B(p) = min1≤k≤2Ck; Where : C1= 1 1 10+ 1 50+ 1 25+ 1 20 = 4.76M bps And C2= 1 1 50+ 1 25+ 1 20+ 1 5 = 3.22M bps
Then, B(p) = min{4.76, 3.22} = 3.22M bps. We can easily verify that this result can be also found when applying the clique based estimation and when supposing the interferene range is for 2 hops.
B. Metric Design
In this section, we introduce our novel metric based on residual link capacity and accounting for both intraflow and in-terflow interferences. The purpose of this metric is to measure accurately the residual capacity of each link when consider-ing the possible conflict with eventually other transmissions
occuring at the same time. The routing decision, then, will be based on links offering the greatest capacity, in other words, on widest paths. To avoid interflow interferences, we used the Residual Link Capacity (RLC) metric defined previously. This metric measures accurately the available bandwidth over a link since it captures the amount of data of all flows crossing the specified link. We apply, then, the clique based bandwidth estimation in order to consider possible intraflow interferences. To model the interferences in the network, we used the TRCA interference model described previously. This formulation garantees a global and unique view inside the network i.e. that every node in the network will be aware of the widest neighboring links able to support additional traffic. Each node computes first the residual capacity of its links. Then, for each path from this node to a destination node, it computes the available bandwidth over this path using the clique based formula introduced previously.
Given a wireless network, we denote {Q1; ...; Qk} as the maximal interference clique set of the network, Cq as the capacity of a clique q, RLCl as the Residual Link Capacity of link l and AB(p) as the estimation of the available bandwidth of path p. For each link l, RLCl is estimated as follows:
RLCl = T Bl −T xlω (10) Where, T Bl corresponds to the total available bandwidth of link l and T xl corresponds to the amount of data occupying the link l during the time window ω.
Then, considering a path p=< l1, l2, ..., lh>, the available bandwidth of the path p is no longer the minimum of RLCs of links composing the path but it is estimated as follows [10]:
AB(p) = min1≤k≤hCk; Ck= 1 RLCk + 1 RLCk+1 + 1 RLCk+2 + 1 RLCk+3 (11) Hence, each node knows the residual capacity of neighbor-ing links and is able to measure the widest path to a destination node while considering all possible interfering transmissions.
V. CONCLUSIONANDFUTUREWORK
We presented, in this paper, two novel link quality aware routing metrics. The first proposal is a load-sensitive and additive metric that aims to fairly distribute the traffic load between nodes in the network while taking into account their occupancy and availability.
The second metric is a concave metric based on residual link capacity estimation. We mean by a concave metric when the total cost of a path is the minimum of the costs of individual links along the path. It represents accurately how much of additional traffic can the link support. Both are based on real traffic estimation and are updated periodically using the control messages of OLSR.
This paper provides a measurement-based performance eval-uation of the OLSR protocol using different metrics such as hop-count, ETX and the two proposed metrics LOM and RLC.
The first series of experiments show that LOM and RLC outperforms ETX since it reproduces better the real behavior of nodes when they are solicited by several data flows si-multaneously. According to the results obtained, the Residual Link Capacity based routing decision is more accurate since it considers better the bandwidth heterogeneity between links. Results obtained are related to the considered topology, further study of other topologies is needed to validate this conclusion. Although, our results remain coherent with other works [2][6]. On the other hand, we presented a novel metric based on residual link capacity estimation and considering both intraflow and interflow interferences. We first model the inter-ferences in a network based on conflict graph and we deduced a clique based estimation of the path bandwidth. This metric is described formally by notions of graph theory.
We focus, in further work, in proposing a novel routing protocol supporting the RLCIC metric and able, with specific diffusion algorithm, to garantee a unique global vision of the network shared by all nodes in the network.
Future contributions will be validated by simulation, proto-typing and then deployed on the real mesh network tetaneu-tral.net [15] in Toulouse, France which offers a more realistic environment, traffic and wireless contraints. It allows us also to check the scalability of our proposal when deployed in a large scale network.
REFERENCES
[1] T. Salonidis, M. Garetto, A. Saha, and E. Knightly. ”Identifying High
Throughput Paths in 802.11 Mesh Networks: A Model-Based Approach”. IEEE Intl Conference of Network Protocols (ICNP), Oct. 2007, pp. 21-30. [2] http://www.olsr.org. Last access: May, 2013.
[3] T. Clausen and P. Jacquet. ”Optimized Link State Routing Protocol
(OLSR)”. Internet Request For Comments RFC 3626, Internet Engineer-ing Task Force, Oct. 2003.
[4] D. S. J. D. Couto, D. Aguayo, J. Bicket, and R. Morris. ”A
high-throughput path metric for multi-hop wireless routing”. ACM MobiCom, California, Sept. 2003, pp. 134-146.
[5] http://lab.iut-blagnac.fr/bluemelab. Last access: May, 2013.
[6] C. Houaidia, A. Van Den Bossche, H. Idoudi, T. Val, L. Saidane.
”Experimental Performance Analysis of Routing Metrics in Wireless Mesh Networks”. IWCMC, Cagliari, Jul. 2013.
[7] http://linuxwireless.org/en/users/Drivers/ath9k. Last access: May, 2013. [8] https://openwrt.org/. Last access: May, 2013.
[9] R.Hou, K-S. Lui, F. Baker, and J. Li. ”Hop-by-Hop Routing in Wireless
Mesh Networks with Bandwidth Guarantees”. IEEE TRANSACTIONS ON MOBILE COMPUTING, vol. 11, no. 2, pp. 264-277, Feb. 2012. [10] H. Li, Y. Cheng, C. Zhou, and W. Zhuang. ”Minimizing
End-to-End Delay: A Novel Routing Metric for Multi-Radio Wireless Mesh Networks”. IEEE INFOCOM, pp. 46-53, Apr. 2009.
[11] Z. Jia, R. Gupta, J. Walrand, and P. Varaiya. ”Bandwidth Guaranteed
Routing for Ad-Hoc Networks with Interference Consideration”. IEEE Symp. Computers and Comm., pp. 3-9, 2005.
[12] M. Kodialam and T. Nandagopal. ”Characterizing the Capacity Region
in Multi-Radio Multi-Channel Wireless Mesh Networks”. ACM Mobi-Com, pp. 73-87, Aug. 2005.
[13] C.-Y. Chiu, Y.-L. Kuo, E. Wu, and G.-H. Chen. ”Bandwidth Constrained
Routing Problem in Wireless Ad Hoc Networks”. IEEE Transactions in Parallel and Distributed Systems, vol. 19, no. 1, pp. 4-14, Jan. 2008. [14] S. Ghannay, S.M. Gammar, F. Filali, F. Kamoun. ”Multi-radio
multi-channel routing metrics in IEEE 802.11s-based wireless mesh networks - And the winner is ...?”. Communications and Networking (ComNet), Hammamet, Nov. 2009, pp.1-8.
[15] http://tetaneutral.net. Last access: May, 2013.
[16] R. Draves, and B. Zill. ”Routing in multi-radio, multi-hop wireless mesh