HAL Id: tel-00459909
https://tel.archives-ouvertes.fr/tel-00459909
Submitted on 25 Feb 2010HAL is a multi-disciplinary open access archive for the deposit and dissemination of sci-entific research documents, whether they are pub-lished or not. The documents may come from teaching and research institutions in France or abroad, or from public or private research centers.
L’archive ouverte pluridisciplinaire HAL, est destinée au dépôt et à la diffusion de documents scientifiques de niveau recherche, publiés ou non, émanant des établissements d’enseignement et de recherche français ou étrangers, des laboratoires publics ou privés.
Propriétés spectroscopiques et structure électronique du
vanadium dans des matériaux complexes: Implications
géologiques et technologiques
Amélie Bordage
To cite this version:
Amélie Bordage. Propriétés spectroscopiques et structure électronique du vanadium dans des matéri-aux complexes: Implications géologiques et technologiques. Physique [physics]. Université Pierre et Marie Curie - Paris VI, 2009. Français. �tel-00459909�
THESE DE DOCTORAT DE
L’UNIVERSITE PIERRE ET MARIE CURIE
Spécialité :
Physique et chimie des matériaux
Présentée par :
Amélie Bordage
Pour obtenir le grade de :
DOCTEUR DE L’UNIVERSITE PIERRE ET MARIE CURIE
Propriétés spectroscopiques et structure
electronique du vanadium dans des matériaux
complexes: Implications géologiques et
technologiques.
Soutenue publiquement le 1
erdécembre 2009 devant le jury composé de:
M.
Jean-Pierre JOLIVET Président du jury
MM. John REHR
Rapporteur
Jérôme ROSE
Rapporteur
Mme Sakura PASCARELLI Examinatrice
MM. Johan DE VILLIERS
Examinateur
Michael TOPLIS
Examinateur
M.
Christian BROUDER
Directeur de thèse
M.
Etienne BALAN
Co-directeur de thèse
The spectroscopic properties and electronic structure
of the vanadium in complex materials:
Cherche encore Le pourquoi de la Terre Le pourquoi de la guerre Le pourquoi de la pluie Le pourquoi du parce que Le puisque du pourquoi Du comment du bonheur Du pourquoi de la vie Cherche encore
Jusqu’au bout de l’enfer Jusqu’au bout de tes nerfs Jusqu’au bout de tes nuits Jusqu’au bout de la mort Jusqu’au bout de l’amer Jusqu’au bout de la vie Et jusqu’à l’infini Cherche encore
Pourquoi c’est important de chercher Alec ? Pour trouver !
Remerciements
Avant de remercier tous ceux qui ont joué un rôle important dans cette thèse, je voudrais la dédicacer à celui sans lequel elle n’aurait jamais eu lieu : Monsieur Bazin, mon professeur de physique au collège. En début de quatrième, je lui ai dit que la physique était la matière la plus nulle du monde et que je la détestais. Il m’a alors dit "Tu verras, tu seras docteur en physique un jour. J’en suis sûr". Il a travaillé dur pendant deux ans afin me faire aimé cette matière. Et aujourd’hui, je suis docteur en physique...
Pour les mercis qui vont suivre, j’espère n’avoir oublié personne. Si c’est le cas, je m’engage à organiser un "beer-time" pour rattrapper cette erreur!
Je voudrais remercier en tout premier Delphine Cabaret. En licence, j’avais un module in-titulé "physique numérique ". Delphine y enseignait et m’a permis de survivre à des heures de torture de programmation Fortran. En M1, je cherchais un stage et elle m’a présenté son colocataire de bureau, Etienne Balan. Qui m’a ensuite proposé un stage en M2 puis une thèse, avec Christian Brouder comme directeur. Je vous remercie d’avoir cru en moi tous les trois, de m’avoir fait confiance tout au long de ma thèse. Encadrée par Etienne pour la géologie, Chrisitan pour la théorie et Delphine pour les calcouls, j’ai appris énormément au milieu de vous. Etienne, merci de m’avoir laissé libre de choisir l’orientation que je souhaitais donner à mon travail, même si ce n’était pas celle que tu préférais. Merci aussi de m’avoir fait découvrir pendant les manips à l’ESRF tout un pan de la musique que je ne connaissais pas et d’avoir enrichie ma connaissance de blagues nulles. Christian, je n’ai qu’une seule chose à te dire : Aaaaaargrrrrrggggghhhhh-hhhhdslfkjdsgùsmfgkjkzouuuuuuuuuu. Delphine, merci pour ton amitié, ton soutien et tout le temps que tu m’as consacré (même enceinte jusqu’au cou), pour tes conseils, pour ton aide dans la rédaction de ma thèse. Et tout le reste encore.
Je remercie les membres du jury pour l’attention qu’ils ont porté à ma thèse: Jean-Pierre Jolivet, John Rehr, Jérôme Rose, Sakura Pascarelli, Mike Toplis et Johan de Villiers. Merci Jéro ˆme d’avoir accepté de raccourcir tes nuits pour lire le manuscrit. Thank you John for your review and the danse at the XAFS 14 dinner. Merci Mike d’avoir tout lu, car je sais que certains chapitres t’ont fait peur au début! Merci Sakura pour tes conseils.
Ma thèse a été très riche en collaborations. Je tiens à remercier toutes les personnes avec qui j’ai eu la chance de travailler et qui ont permis à ce travail d’avancer. Je remercie très chaleuresement toute l’équipe de la ligne ID26 à l’ESRF (même si à trois heures du matin il fait un peu froid dans la hutch), pour m’avoir fait découvrir le synchrotron et pour leur aide pendant les expériences HERFD: Pieter Glatzel, Sigrid Eeckhout, Marcin Sikora, Tsu-Chien Weng, Janine Grattage, Kristina Kvashnina, Roberto Alonso-Mori et (the last but not the least) Christophe
4
Lapras. Thank you for all the funny times on the beamline and during the Users’meetings and conferences (HERFD is a spectroscopy also called "It-which-must-not-be-named", isn’t it?...). Thank you Janine for your help during my thesis writing and all your advices concerning the english grammar and spelling. And Pieter, a special thanks for you, because you patiently answered to all my "why" and "how" about the beamline and HERFD, and you were the only one I can speak soccer and F1 with during the experiments! Je suis allée deux mois en Afrique du Sud, à l’Université de Pretoria et je souhaiterais donc remercier tous ceux qui se sont occupés de moi là-bas: Johan (and all his family), Robert, Maggie, Sabine, Wiepke, Allison, Sean, Teresa, Lizelle, Sanet and Eva. I thank you all for your welcome and your kindness and all the time you took for me. Thanks for having taken care of me during these two months, for the coffee-times in the Stonemen Building and and for having made me discovered South Africa. Johan, a special thank you for giving me the oppurtunity to come . Robert, thank you for your support during my experiments. I will never forget to say the "h" at the beginning of the words and the "s" at the end. I also hope all the little fairies have left your pump... J’ai eu de plus l’occasion de travailler avec Yves Joly (Institut Néel), pour faire des calculs sur la magnétite. Je le remercie pour son aide, ses explications et toutes les discussions sur le vanadium dans la magnétite. Je remercie enfin Andrea Di Cicco et Adriano Filipponi, pour avoir organisé le congrès XAFS 14 à Camerino. C’est le meilleur congrès auquel je suis allée, aussi bien pour les conférences que pour l’ambiance!
Je voudrais maintenant revenir en France pour remercier l’IMPMC, et en particulier Bernard Capelle, son directeur, pour son écoute, sa disponibilité, son imprimante couleurs et pour m’avoir permis d’assister à un grand nombre de congrès. Je remercie aussi toute l’équipe Théorie Quan-tique des Matériaux, la dreamteam des calcouls. Je remercie en particulier Matteo Calandra pour son aide sur les calcouls ab initio et l’utilisation de Xspectra, ainsi que Michele Lazzeri pour son aide sur les calcouls et LateX. Je remercie fortement (au propre comme au figuré) Philippe Sainctavit pour son aide sur l’absorption des rayons X, que ce soit la préparation des expériences, les nuits à l’ESRF ou la théorie, Marie-Anne Arrio pour m’avoir initiée aux calculs multiplets et Claire Carvallo, qui est venue faire des nuits avec moi à l’ESRF.
Mes remerciements vont aussi à Gaëlle Dufour, Danielle Raddas, Ouafa Faouzi et Danielle Thomas pour leur aide et leur efficacité dans la préparation de toutes mes mission et la vie pratique du labo; Michelle Jacquet et Mélanie Escudé de l’INSP, pour leur aide dans la pré-paration d’échantillons; Alain-Jeanne Michaud, pour mon affiche de thèse. J’ai eu la chance d’être monitrice pendant ma thèse. Alors merci Jocelyne, Seb et Alex pour votre aide pendant les TPs, les cafés et croissants avant les TPs du matin. Merci Ismaïl pour ton aide dans la préparation des TDs. Je suis ravie aussi que mes préparations de TDs et TPs soient venues grossir ton tas de photocopies de mes cours et TDs que tu collectionnes précieusement depuis la licence! Merci Maître Claire d’avoir été ma tutrice pour le monitorat et de m’avoir acceptée comme padawan. Je remercie très chaleuresement Annick Whüler, pour son aide pendant mon DEA et qui m’a soutenue pour obtenir une bourse de thèse. Enfin, merci à Stéphanie de m’avoir parlé du poste d’ATER que j’ai aujourd’hui au Laboratoire en Géomatériaux et Environnement. Cela m’a permis de découvrir un nouveau labo et d’autres aspects de la recherche.
Et maintenant que tous les remerciements "sérieux" sont faits, je voudrais passer à ceux plus rigolos.
Merci Jam. Sans toi, ma thèse n’aurait pas été la même. Je pourrais détailler tout ce pour quoi je te remercie, mais en fait, je trouve qu’un clin d’oeil en dit beaucoup plus... Et merci à toi aussi Simon, mon cothésard préféré, pour ton aide et ton soutien en toutes circonstances, tes
5 blagues vaseuses auxquelles je suis la seule à rigoler et tes demandes en mariage.
Je voudrais remercier plus particulièrement certains membres de l’IMPMC : Philippe, pour avoir épargné des maux de tête à l’IMPMC en trouvant un surnom à chaque Amélie; Marie-Anne, pour ton soutien et toutes les discussions sur les dessins animés; Michele pour Fiorentino, le crapaud-en-peluche-futur-prince-charmant, et les discussions footballisitques (oui Michele, un jour, la Fiorentina gagnera); Matteo (Calandra) pour les discussions sportives, qui peuvent se résumer par "Forza Ferrari!" ; Feriel, pour ton soutien et toutes nos discussions; Nicolas et Thierry pour leurs blagues et leur bonne humeur à la cantine et à la cafèt; Claire et Federica, pour leur amitié et toutes les discussions sur les beaux gosses; Niels, Olivier D, Mathieu, Tobias, Marc, Gérald, Eglantine, Guillaume, Tobias, Fabien, Olivier V, Marie, Boris B, Haruka, Boris V, Chloé, Coralie, Marion, Merlin et tous les adeptes des tea-times et beer-times; les producteurs de café du monde entier, grâce à qui j’ai pu fournir l’IMPMC en café pendant trois ans (parce que un chercheur sans caféine, c’est comme... un manouche sans guitare, un château sans la Loire, un martien sans soucoupe,un pâté sans la croûte (merci Thomas Dutronc pour ces belles paroles) ); AC DC, pour leurs chansons, énorme soutien pendant les traitements de données un peu longs et répétitifs; et enfin Clive Owen, pour tous ses excellents films sortis avant et pendant ma thèse, et en particulier "King Arthur" (n’est-ce-pas, Jam?).
Merci Fanny, ma "co-docteur", pour ton amitié. et ton soutien. Je te remercie en particulier pour ton soutien pendant ma rédaction et surtout aprés, puisque tu as fait plus de cauchemars que moi avant ma soutenance!
Merci à Stéphanie et Nico de m’avoir présenté la "Suricate Family" (Karim, Jess, Clélia, Champy, Caro), qui m’a accueillie à bras ouvert dans mon nouveau laboratoire (ils le regrettent peut-être maintenant...). Grâce notamment à Stéphanie, j’ai pu rencontré deux personnes au moins aussi bavardes que moi (Stéph et Jess), et une espèce que je croyais en voie de disparition: un vrai supporter du PSG (si si, ça existe). Merci Nico de m’avoir expliqué ta ligne et vivement nos manips ensemble! Merci à Carambar (sponsor officiel de LGE) pour tous les fous rires qu’il m’a déjà permis de partager avec Rossana et Valérie, et qui promettent d’être encore nombreux! Un merci spécial à Maya d’avoir été ma cavalière à la soirée de XAFS 14 et d’avoir transformé mon lion en lion-baba-cool, ainsi qu’ à Gaspard pour ses beaux dessins et sa "cool-attitude" avec sa baby-sitter préférée. Un merci en avance pour Octave, pour qu’il soit comme son grand-frère avec sa future baby-sitter (aussi préférée).
Enfin, je souhaiterais remercier vraiment beaucoup très ènormément tous ceux qui n’ont pas forcément de lien direct avec ma thèse mais qui en entendent parler depuis trois ans, et qui m’ont soutenue pendant tout ce temps: mes parents, mes soeurs Mathilde et Elise, Loic-le-chevelu, mes grand-parents/oncles/tantes/cousins et mes amis (Elsa, Sab la Chacale, Oliv, Jul’, Maciej, Tom, Camille, Jam, Delphine et Cétéra). Sans oublier tous ceux des Scouts et Guides de France qui eux aussi m’ont soutenue, en particulier la dernière année : David, Charles, Aude, Jonathan, Clément (l’équipe des "calories-party", tous fans de coin-coins), ainsi que tout le groupe Notre Dame des Ailes. Parmi eux, il faut que je mentionne Eric, qui a découvert avec étonnement (et incrédulité) qu’on pouvait travailler pendant trois ans sur (je cite) "la physique des cailloux"...
PS: Merci aussi à tous ceux qui sont repartis avec des restes du pot! Grâce à vous, on a évité d’en manger matin, midi et soir pendant une semaine...
Résumé
Cette thèse a pour but d’étudier les propriétés spectroscopiques et la structure électronique du vanadium dans différents minéraux d’intérêt géologique et/ou technologique. Une approche expérimentale basée sur la spectroscopie HERFD-XAS au seuil K du vanadium a été combinée à une approche théorique. Cette dernière couple calculs ab initio et calculs multiélectroniques des spectres XANES, permettant une interprétation plus fine des spectres expérimentaux. Des développements théoriques basés sur les tenseurs sphériques et la méthode des cosets ont été effectués puis appliqués au cas de la section efficace d’absorption des rayons X, afin d’extraire les propriétés spectroscopiques du cristal à partir de celles d’un site individuel.
La signature spectrale de V3+ dans le grossulaire (Ca
3Al2(SiO4)3) a été déterminée grâce à la dépendance angulaire du préseuil de son spectre XANES. Ce minéral peut donc être utilisé de manière fiable comme composé de référence dans l’étude du degré d’oxydation du vanadium dans des verres, de minéraux et de composés synthétiques. Le vanadium peut être incorporé comme dopant dans l’anatase (TiO2) sous forme de vanadium tétravalent. Son environnement local dans l’anatase a été sondé, montrant que le vanadium n’est pas incorporé en substitution du titane. Enfin, le degré d’oxydation du vanadium dans les titanomagnétites (Fe3−xTixO4 :V) du Bushveld (Afrique du Sud) a été déterminé pour des échantillons naturels et synthétiques. La coexistence de deux degrés d’oxydation (+III et +IV) a été montrée mais les implications de leur variations relatives sur la formation des couches géantes de magnétite dans le Bushveld restent encore mal comprises.
Mots-clés
Abstract
The aim of this thesis is the investigation of the spectroscopic properties and the electronic structure of vanadium in minerals with a geological and/or technological interest. V K-edge HERFD-XAS experiments were combined with a theoretical determination of the measured spectra. Two approaches were complementary used to calculate the spectra: an ab initio ap-proach and a multielectronic one. Theoretical developments based on a spherical tensor analysis and the coset method were achieved and applied to the X-ray absorption cross-section, in order to extract the spectroscopic properties of the crystal from those of a single site.
The spectral signature of V3+in grossular (Ca
3Al2(SiO4)3) was determined using the angular dependence of the XANES pre-edge features. This mineral is therefore a reliable reference compound for further study of the vanadium oxidation state in glasses, minerals and synthetic compounds. Vanadium is also used as a dopant in anatase (TiO2) in which it is incorporated under the +IV oxidation state. The investigation of its local environment showed that vanadium is not incorporated in the Ti-substitutional site but may be incorporated in the interstitial one. Finally, the oxidation state of vanadium in natural and synthetic samples of titanomagnetite (Fe3−xTixO4 :V) from the Bushveld Complex (South Africa) was determined and the +III and +IV oxidation states were shown to coexist. Despite this detailed investigation, the geological implication of their relative variations on the crystallization of the giant magnetite layers is still not well understood.
Key words
Contents
Remarks 15
Introduction 3
I Methods 11
1 Minerals and experiments 13
1.1 Presentation of the studied minerals . . . 13
1.1.1 Magnetite Fe3O4 . . . 14 1.1.2 Tsavorite Ca3Al2(SiO4)3:V3+ . . . 16 1.1.3 Anatase TiO2 . . . 18 1.2 Chemical analyses . . . 19 1.2.1 X-ray diffraction . . . 20 1.2.2 Electron microprobe . . . 22
1.2.3 Scanning Electron Microscopy . . . 22
1.3 X-ray Absorption Spectroscopy . . . 22
1.3.1 Principle . . . 23
1.3.2 High Energy Resolution Fluorescence Detected X-ray Absorption Spec-troscopy . . . 25
1.3.3 HERFD-XAS vs. conventional XAS . . . 27
1.3.4 Angular dependence of the XAS measurements . . . 29
2 Theoretical methods 31 2.1 Monoelectronic approach . . . 31
2.1.1 Density Functional Theory . . . 31
2.1.2 Absorption cross-section, the PAW method and the recursive method of Haydock, Heine and Kelly . . . 32
2.1.3 Practical details about the pseudopotentials and the used codes . . . 34
2.1.4 Calculation steps . . . 35
2.1.5 Calculations methods in the direct space . . . 37
2.2 Multielectronic approach . . . 39
2.2.1 Principle . . . 40
2.2.2 Calculation steps . . . 42
2.2.3 Use of the subduction theory . . . 46
2.3 Symmetry considerations: The coset method . . . 49
II Applications 85
3 Tsavorite Ca3Al2(SiO4)3:V3+ 87
3.1 The angular dependence of the pre-edge . . . 87
3.1.1 Summary of the publication . . . 87
3.1.2 Publication . . . 88
3.2 Additional materials to the publication . . . 116
3.2.1 Complementary results to the HERFD-XAS experiments . . . 116
3.2.2 A detailed study of the 3d orbitals splitting . . . 116
3.3 Multielectronic calculations . . . 123
3.3.1 The eletric quadrupole cross-section . . . 123
3.3.2 Transition operators . . . 127
3.3.3 Results . . . 129
3.4 Conclusion . . . 133
4 The incorporation of vanadium in anatase (TiO2:V4+) 135 4.1 V K -edge HERFD-XAS experiments on synthesized TiO2:V4+ . . . 136
4.1.1 HERFD-XAS measurements . . . 136
4.1.2 The RIXS plane . . . 136
4.1.3 The influence of the concentration . . . 137
4.1.4 Interpretation of the experimental data . . . 138
4.2 DFT calculations at the Ti K -edge of anatase and at the V K -edge of V-doped anatase . . . 140
4.2.1 Computational details . . . 141
4.2.2 The theoretical Ti K -edge spectrum of anatase . . . 146
4.2.3 The theoretical V K -edge spectrum of V-doped anatase with V incorpo-rated in the Ti-substitutional site . . . 146
4.2.4 Interpretation of the theoretical data: Assignment of the transition in a monoelectronic framework . . . 149
4.3 Conclusion . . . 150
5 The oxidation state of vanadium in titanomagnetites Fe3−xTixO4 from the Bushveld Complex 153 5.1 The initial idea . . . 153
5.2 The natural titanomagnetite samples from BK2 borehole . . . 154
5.2.1 Samples characterization . . . 155
5.2.2 Determination of the oxygen fugacity . . . 156
5.2.3 V K -edge HERFD-XAS measurements . . . 161
5.2.4 Summary of the natural samples results . . . 167
5.3 The synthesized magnetite samples . . . 168
5.3.1 The protocol for the synthesis of vanadiferous magnetite . . . 168
5.3.2 Sample analyses by XRD, SEM and microprobe . . . 169
5.3.3 V K -edge HERFD-XAS measurements . . . 172
5.3.4 Comparison between the natural titanomagnetite and synthetic magnetite spectra . . . 174
5.4 Discussion and prospects . . . 174
5.4.2 The choice of reference compounds . . . 177
5.4.3 The local environment around vanadium in magnetite . . . 178
5.4.4 Theoretical prospects . . . 179
5.4.5 Experimental prospects . . . 182
5.5 Conclusion . . . 184
Conclusion 185 Appendixes 191 A The characters tables of some groups and the notation of their representations191 A.1 The O group . . . 191
A.2 The D3 group . . . 192
A.3 The C3 group . . . 192
B The synthesis of V-doped anatase 193 C A previous study on the oxidation state of vanadium in titanomagnetites by XAS experiments 213 D Chemical data on the titanomagnetite samples from the Bushveld Complex 219 D.1 Microprobe analyses . . . 219 D.2 Gaussian parameters used for the pre-edge extraction and determination of the
corresponding V4+ content in the case of the natural BK2 titanomagnetite samples221
Résumé de la thèse en français 223
Remarks
In the manuscript, the name tsavorite is used for a V-bearing grossular (Ca3Al2(SiO4)3:V3+). This name was fixed by usage at the beginning of my thesis and I thus used it. The International Mineralogical Association discredited it and "tsavorite" must not be used anymore. However, the name is used in this thesis for simplicity and clarity.
The bibliography is sorted in the alphabetical order of authors. The references given in the publications are not included in the bibliography.
A part of the theoretical work presented here (DFT calculations) was granted access to the HPS resources of IDRIS (Institut du Développement et de Recherche en Informatique Scien-tifique) under the allocations 2007, 2008 and 2009 - 2015 made by GENCI (Grand Equipement National de Calcul Intensif).
A summary of the manuscript is written in French and incorporated in the the manuscript. This summary is needed by the Pierre and Marie Curie University administration since the manuscript is written in English. Some words in the summary remain in English as they are widely use in French. They are written in italic.
Introduction
The subject of this thesis is the study of the spectroscopic properties and the electronic structure of vanadium in complex materials. This work was focused on three V-bearing minerals which present a geological or technological interest. Minerals are inorganic natural compounds occuring as crystalline solids. In mineralogy, elements present in small concentration in the mineral are said to be minor or trace elements, and impurity in materials science. The presence of a transition element in a host-mineral modifies several of its properties, notably the color: corundum α-Al2O3 is neutral but ruby α-Al2O3:Cr3+ is red, α-Al2O3:Fe3+ yellow, α-Al2O3:V3+ purple and sapphire α-Al2O3:Fe2+, Ti4+ blue. The mechanisms of the trace element incorpo-ration and the impact on the mineral properties are thus widely studied in gemology, Earth sciences or materials science.
Vanadium is a transition metal from the first row and is present in several minerals as an impurity or a major constituent. It was discovered in 1831 by Nils Gabriel Sefström and named after Vanadis1, the goddess of beauty and fertility in the scandinavian mythology, because of the wide range of colored chemical compounds produced with vanadium [188]. Vanadium is indeed responsible for the colour of several minerals, e.g. green for tsavorite Ca3Al2(SiO4)3:V3+, blue for cavansite CaVOSi4O10·4H2O, orange for lasalite Na2Mg2[V10O28] · 20H2O or red for vanadinite Pb5(VO4)3Cl (Fig. 1).
In addition to its role as a coloring impurity in natural minerals, vanadium has also many technological applications. It is used as a catalyst , e.g. in manufacturing sulfuric acid [73] or maleic anhydride [1], and as a coloring impurity in synthetic crystals and pigments. For instance, vanadium is used to obtain a range of yellow colours for ceramic pigments based on ZrO2 [61]. The blue or green color of V-doped zircons (ZrSiO4:V) depends on the synthesis conditions which can modify the incorporation of vanadium in zircon and the resulting color [6]. Vanadium is also used to make high-performance steel for application in axles, bicycle frames, crankshafts, gears, surgical instruments, among other applications. The first industrial use of vanadium in steel was found in the gears and the chassis of the Ford Model T: using vanadium high-strength steel allowed the reduction of the weight of the chassis by a third for the same strength [17] (Fig. 2). However, vanadium does not form ore mineral by itself but needs to be extracted from minerals or chemically isolated. The first chemical preparation of pure vanadium metal was done in 1927 [144].
The main natural source of vanadium is V-bearing titanomagnetite Fe3−xTixO4:V. The largest ore in the world is the monomineralic layers of massive titanomagnetite from the Bushveld Complex, in South Africa [215, 176, 54]. These magnetite layers range from a few centimeters to several meters in thickness, and some extend for more than 100 km along the strike of the bed [54]. Outcrops of these layers are visible in the Bushveld Complex and the layers can be
1
4 Introduction
Tsavorite Cavansite
Lasalite Vanadinite
Figure 1: Vanadium is responsible for a wide range of colors in chemical compounds and minerals. Some examples are presented here: the green tsavorite, the blue cavansite, the yellow lasalite and the red vanadinite.
Figure 2: The first industrial use of steels with vanadium was to make the chassis of the Ford T.
well-observed in open-cast mines (Fig. 3). The vanadium-bearing nature of the titaniferous iron ores was first recognized in 1923 [2] but the commercial production of the vanadium extraction from magnetite in the Bushveld Complex only began in 1957 [19].
The Bushveld Complex, discovered in 1897 [150], is the largest known layered intrusion in the world, with a total area of about 66000 km2 [222]. It is approximately 2058.9 ± 0.8 Ma old [26] and is situated within the Transvaal basin, in South Africa. A layered intrusion is a large sill-like body of igneous rock which exhibits vertical layering or differences in composition and texture, and an igneous rock is formed by a magma which slowly cools and becomes solid.
Introduction 5
Figure 3: (Left) The outcrop of a titanomagnetite layer, at Mapochs Mine. (Right) A titanomagentite layer at the Vametco mine, situated in the Eastern limb of the Bushveld Complex.
In other words, the Bushveld Complex was a giant magmatic chamber which slowly cooled and became solid below the Earth’s crust. The Bushveld Complex consists of five limbs connected together at depth [53, 57]: the Far Western, the Western, the Southeastern (or Bethal) , the Eastern and the Northern (or Potgietesrus) limbs (Fig. D.3) [56]. The layered rocks are divided into Lower, Critical, Main and Upper zones, depending on their stratigraphic height [187]. Two major groups of oxide minerals are present in the layered rocks of the Bushveld Complex. The first one consists of chromitites (igneous cumulate rock composed mostly of chromite FeCr2O4) in the Critical Zone. The second consists of vanadium-bearing titanomagnetite deposits in the upper part of the Complex [38]. The magnetite-rich rocks of the Western Lobe are collectively referred as the Bierkraal Magnetite Gabbro2.
Figure 4: General geology of the Bushveld Complex, showing outcrops of the northern, eastern, western and far western limbs, and the position of the unexposed southeastern limb (it is completely covered by younger sedimentary rocks). The map is reproduced from Ref. [56].
2
Gabbro refers to a large group of dark, corse-grained igneous mafic rocks, i.e. mafic rocks being rocks with a low silicon contents and a high content in magnesium and iron.
6 Introduction Despite numerous studies on the formation of the Bushveld Complex, the crystallization of the titanomagnetite layers is still poorly understood. Any proposed model for the genesis of ti-tanomagnetite layers is indeed constrained by their petrological, mineralogical and geochemical characteristics as well as those of their host silicate rocks. It must explain not only the mecha-nisms that are responsible for the precipitation of large quantitites of titanomagnetite and the development of ore-rich layers, but also the mechanisms by which primary precipitates are con-verted into essentially monomineralic ores. Several models have thus been proposed, but no one has found a general agreement yet. The first models invoked mechanisms involving separation and gravitational accumulation of titanomagnetite crystals at the bottom of the magmatic cham-ber or postulated the existence of discrete Fe-Ti oxide liquids that was intruded from below and spread laterally along certain lithological contact [13, 63, 205, 141, 215]. Reynolds presented in 1985 a review and synthesis of the proposed models [175], concluding that most models recognize that precipitation of copious quantities of titanomagnetite required for the development of ore-rich layers is triggered by episodic increase in oxygen fugacity, fO2 [113, 172, 173, 152, 130, 129], but that the process whereby this occurs is not well understood. The increase in oxygen fugacity must have been indeed more or less simultaneous over the entire width of the magma chamber to allow for the uniform thickness and lateral continuity of individual ore-rich layers. Similarly, a magma-mixing model [114, 103] can not effectively account for the common presence of numer-ous titanomagnetite rich-layers within small vertical intervals and variations in silicate mineral content within individual layers [175]. A change in pressure caused by a fracturing through to the surface would explain a quite homogeneous increase of the oxygen fugacity [50, 210]. Tegner et al. have published recently a review on the previous models and proposed that the magnetite layers were formed by fractional crystallization, i.e. the removal and segregation from a melt of mineral precipitates, of a huge stratified magma sheet [202]. The fractional crystallization was previously proposed [176] but invoked a mixing of numerous injections of magma [56]. Analo-gies were often made between chromite and magnetite layers to explain the formation of the titanomagnetite layers [37, 39, 49, 71].
To propose the models on the layer crystallization and explain the process whereby the oxygen fugacity would increase in the whole magmatic chamber, chromium in chromite and ti-tanomagnetite was widely investigated [28, 36, 52, 51, 50, 136, 148, 147]. Vanadium in V-bearing titaniferous magnetite was also studied but received less attention than chromium [54, 55, 175]. A detailed study of vanadium in V-rich titanomagnetite is required. In particular, the oxidation state of vanadium may provide information on the processes that led to the crystallization of these huge V-rich titanomagnetite layers.
Vanadium may indeed occur under several oxidation states: +II, +III, +IV and +V. V3+, V4+ and V5+ are known to exist in a wide range of geological environment, whereas V2+ is observed only in highly reduced systems such as those that existed in the early solar nebula [192, 199]. The determination of the oxygen fugacity for magmas derived by the melting of planetary mantles is critical to the understanding of the genesis and differentiation of magmas and to the nature and evolution of planetary interiors [46, 11]. The several oxidation states of vanadium make it a valuable geochemical indicator providing information on the oxygen fugacity prevailing during the formation of Earth and planetary rocks. Vanadium was indeed shown to be redox-sensitive during melting or crystallization [21, 191] and the relative proportions of the different oxidation states depends on the oxygen fugacity of the melt [41, 42]. The abundance
Introduction 7 of V4+ is small in melts, but the proportion of V3+ and thus the V4+/V3+ ratio decreases substantially with an increasing oxygen fugacity [44]. For instance, in conditions of oxygen fugacity relevant to terrestrial basaltic systems, V4+ is predicted to be the main valence in a ferrobasaltic magma, whereas at more oxidizing conditions, V5+ becomes the dominant valence (Fig. 5) [206].
Figure 5: Calculated variations of the relative proportions of Vn+as a function of the oxygen fugacity for a ferrobasaltic melt. The conditions of oxygen fugacity relevant to terretrial basaltic systems correspond to ∆NNO = -3 to ∆NNO = +1, where ∆NNO represents the oxidizing conditions with respect to the Nickel-Nickel Oxide (NNO) buffer. The figure is reproduced from Ref. [206].
Considering these relations between the vanadium oxidation states and the oxygen fugacity, vanadium valence oxybarometers has been developed [107, 158]. They are based on the variation of the partition coefficient between a mineral and the parent liquid magma, which represents the affinity of an element during a crystallization or a melting to incorporate the solid or liquid phase [40, 43, 143]. The vanadium valence oxybarometers can record at least eight orders of magnitude in oxygen fugacity, allowing for applicability to both oxidized and reduced magmas from planetary bodies. The applicability at low oxygen fugacity conditions is especially im-portant because traditional Fe2+/Fe3+ barometers are ineffectual if no Fe3+ is present in these environments [125] and because unaltered Fe-Ti oxides used in the traditional geobarometers are rarely preserved. Some vanadium valence oxybarometers are concentrated on basaltic glasses [197, 127], spinels [157, 177, 178], olivines [198, 190] and pyroxenes [125, 126]. The vanadium oxidation state is therefore a potential window into the processes leading to the formation of the V-rich titanomagnetite layers in the Bushveld Complex and could bring information on the oxygen fugacity during the layer crystallization.
Nevertheless, at the present time, the oxidation state of vanadium in titanomagnetite from layered intrusions is still unknown and has to be determined. The first study on the vanadium oxidation state in the titanomagnetite was done in 2006 by Balan et al. using X-ray Absorption Spectroscopy (XAS). XAS is indeed a powerful tool to determine the oxidation state of an atom in a compound, since it is a chemically sensitive technique and that the structures observed in an X-ray Absorption spectrum depend on the crystallographic and electronic structures of the investigated element. These structures are the result of the interaction between an X-ray
8 Introduction beam and the electrons of the investigated atoms. In particular, the features situated at an energy just below the edge, said to be "the pre-edge", provide information on the oxidation state and local environment of the absorbing atom [35]. To infer the oxidation state from the pre-edge features, the most widely used method is to compare the spectrum of the investigated element to those of reference compounds, in which the oxidation state and coordination number is well known. This "fingerprint" method was used in minerals and glasses to investigate several elements, such as titanium [79, 75, 78, 217], iron [35, 83, 116, 161, 218, 219, 221], chromium [72], nickel [77], manganese [59, 76, 110] or magnesium [168, 207]. Particular attention has been given to vanadium, since its several oxidation states makes it a potential geochemical probe. The first detailed analysis of the vanadium pre-edge in minerals as a function of the oxidation state and coordination number was done by Wong et al. [224] and numerous studies followed, e.g. Ref [18, 10, 60, 93, 127, 149, 156, 166, 171, 197].
To correctly interpret the pre-edge features of an investigated element, its spectral signa-ture for a given oxidation state and coordination number needs to be well-known. Indeed, the pre-edge energy and intensity depend on both of them. Detailed knowledge of the pre-edge can be obtained experimentally and theoretically. XAS experiments on single-crystals are prefered in order to get a fine interpretation of the pre-edge features. Indeed, measurements on powder samples give access only to the average spectrum and therefore provide information averaged over all the angles. To get more accurate information on the electronic structure and on the local environment of an absorbing atom, the single-crystal has to be cut and oriented, so its orienta-tion with respect to the polarizaorienta-tion and direcorienta-tion of the incident beam can be varied. Indeed, in most cases, crystals present a natural anisotropy, the advantage of which can be taken. This effect is called X-ray Natural Linear Dichroism. The angular dependence of the XAS spectrum can also be observed for the pre-edge of cubic crystals [24] and was well observed in the case of pyrite FeS2 [32] and Cr3+-bearing spinel [122].
However, XAS measurements on a single-crystal are not simple to perform. The theoretical determination of the XAS spectrum can come to the rescue and provide additional quantitative and qualitative information. For instance, the structural relaxation around an impurity incor-porated in a host-structure can be theoretically determined by the energy minimization of the structure. To calculate the spectrum itself, two theoretical approaches can be used, depend-ing whether the final states are localized or delocalized. In the case of localized final states, for instance for transitions from occupied 1s orbitals to the 3d empty ones, the Ligand Field Multiplet Theory is used to simulate the pre-edge and was successfully applied to several cases [9, 89, 122, 94, 95, 219]. This approach has the main advantage to take into account the mul-tielectronic interactions and to give access to quantitative parameters, for instance the crystal field parameter or the p-d hybridization. In the case of delocalized final states, a monoelec-tronic approach based on the Density Functional Theory is used. This monoelecmonoelec-tronic method is widely used and is applied in several codes, Quantum Espresso [12, 92, 99], PARATEC [163], FDMNES [118], FEFF [169, 170] (and many others), the choice of which depends on the user. The DFT calculations have also shown satisfactory results for the calculations of K pre-edges [34, 85, 99, 120, 122, 223], which corresponds to localized final states. The monoelectronic ap-proach has the advantage to be parameter-free and to allow the calculation of the complete XAS spectrum, and not only the pre-edge as with the LFM theory. Spin-polarized calculations can also be performed, hence providing additional information on the involved transitions. To calculate the pre-edge region of a XAS spectrum, only one approach (monoelectronic or
mul-Introduction 9 tielectronic) is often exclusively chosen but recent calculations on the Cr K pre-edge in spinel MgAl2O4 showed that they provide complementary information when used together [121, 122]. This coupling of the two theoretical approaches permits the maximum of information to be ob-tained from the pre-edge.
In my thesis work, the crystallographic and electronic structure of vanadium as an impu-rity in some minerals has been investigated. The main question was indeed the speciation, i.e. the oxidation state and coordination number, of vanadium in the titanomagnetites from the Bushveld Complex. The vanadium oxidation state and the ratio between the different oxidation states present in magnetite, if oberved at all, may provide information on the crystallization of the giant magnetite layers in the Bushveld Complex which is still poorly understood. The deter-mination of the vanadium oxidation state is a potential benchmark since vanadium was proved to be a reliable geochemical probe, its oxidation state being related to the oxygen fugacity at the crystallization time. This study has mainly used X-ray Absorption Spectroscopy, which is a powerful experimental method to investigate the oxidation state and local environment of an atom in a structure. The spectra analyses were done by a fingerprint method, which consists of the comparison between the investigated spectrum and those of reference compounds for which the oxidation state and coordination number is well defined. A precise knowledge of the latter is therefore required and can be obtained by a detailed experimental and theoretical study of the reference compound. The study of tsavorite, a mineral incorporating V3+ in an octahedral site, was thus undertaken. A coupling of several theoretical methods providing complementary infor-mation was used to calculate the experimental XAS spectra in the pre-edge region and hence give a fine interpretation of the measured features and a detailed knowledge of its spectral signature. In parallel, an experimental and theoretical study was then done to determine the speciation of vanadium in V-doped anatase, which is a material of technological interest used as a photocat-alyst. This study enabled to study the incorporation of vanadium as an impurity in a larger view.
The manuscript is divided in two parts. The first part consists of two chapters dedicated respectively to the experimental and theoretical methods I used. The second part presents the results obtained in the study of three minerals: tsavorite, V-doped anatase and V-bearing (titano)magnetite, each mineral corresponding to a chapter.
• Chapter 1 presents the main information of the studied minerals (magnetite Fe3O4, tsavorite Ca3Al2(SiO4)3 and anatase TiO2) and gives their main crystallographic data. The experimental tools are also presented, with a particular emphasis on High-Energy Resolution Fluorescence Detected X-ray Absorption Spectroscopy (HERFD-XAS), which is the main experimental technique used to study the electronic structure of vanadium. • Chapter 2 presents the theoretical methods used to model the crystallographic
environ-ment and electronic structure of vanadium in different minerals. In a first part, I present the monoelectronic approach. The reader is reminded about the principles of Density Functional Theory (DFT) calculations and the details of the calculations performed in the reciprocal space are described. This approach was used to study tsavorite and V-doped anatase. The principles of calculations performed in the real space are also briefly ex-posed, since they were used to model the V K -edge in magnetite. In a second part, I present the multielectronic approach, based on the Ligand Field Multiplet (LFM) theory
10 Introduction and used to simulate the K pre-edge of vanadium in tsavorite. In a third part, theoretical developments based on a spherical tensor analysis are presented as an article published in Journal of Physics: Condensed Matter [25]. Finally, a study on Cr3+in spinel MgAl
2O4 is presented as an article published in Physical Review B [122] to illustrate the use of these three theoretical methods (the monoelectronic approach, the multielectronic one and the formalism of spherical tensors).
• Chapter 3 deals with a detailed study of the electronic structure of vanadium in tsavorite, which is used as a reference compound in the study of titanomagnetite. In tsavorite, vanadium occurs under the +III oxidation state in a slighty distorted octahedral site. Its spectral signature is determined experimentally and theoretically by an analysis of the angular dependence of the pre-edge features. The results obtained with HERFD-XAS experiments and DFT calculations are presented as an article submitted to American Mineralogist. Then additional materials to the article are detailed and finally the results obtained with LFM calculations are given.
• Chapter 4 is dedicated to the incorporation of vanadium in anatase TiO2. Vanadium is incorporated under the +IV oxidation state in anatase but its incorporation site has to be determined. A HERFD-XAS analysis is thus presented with DFT calculations that were performed at the Ti K -edge of anatase and at the VK -edge of V-doped anatase (with vanadium substituted for titanium).
• Chapter 5 is dedicated to the study of the vanadium oxidation state in the titanomag-netites from the Bushveld Complex, with an investigation of natural titanomagnetite and synthetic magnetite samples. Syntheses of V-bearing magnetite were performed during my thesis and the experimental protocol is described. The oxidation state of vanadium is analyzed with V K -edge HERFD-XAS experiments and the oxygen fugacity with micro-probe analyses. Then these two kinds of results are then compared to get information on the crystallization of the titanomagnetite layer of the Bushveld Complex.
Part I
Methods
Chapter 1
Minerals and experiments
During my thesis, I was interested in determining the oxidation state of vanadium in ti-tanomagnetites from the Bushveld Complex (South Africa) and I thus studied a series of eleven natural samples taken at different depths in a borehole. As titanomagnetite is a complex sys-tem, I synthesized V-bearing magnetite samples to obtain information from a close but simpler system. The study of these titanomagnetite samples also led me to study reference compounds in which the oxidation state of vanadium is well-known. This chapter is thus dedicated to the description of the V-bearing minerals studied: magnetite, tsavorite and anatase. Their struc-ture and main crystallographic data are presented in the first section. The second section is dedicated to the experimental tools I used to chemically analyze natural and synthetic mag-netite samples: the principles of X-ray diffraction, electron microprobe analyses and scanning electron microscopy are briefly reminded. Finally, the third section is dedicated to the main technique I used: the X-ray absorption Spectroscopy (XAS). I performed XAS measurements at the V K -edge of the reference minerals and of the natural titanomagnetite samples, in order to characterize the crystallographic and electronic structures of vanadium. The XAS princi-ple is explained, with the particular measurement modes I used, and the experimental setup is described.
1.1
Presentation of the studied minerals
I studied three minerals during my thesis:
• magnetite Fe3O4:V (and titanomagnetite Fe3−xTixO4:V), • tsavorite Ca3Al2(SiO4)3:V3+,
• anatase TiO2:V4+.
Vanadiferous titanomagnetite presents economical and geological interests, as it is the main vanadium source. Tsavorite was used as a V3+ reference compound in the determination of the oxidation state of vanadium in natural and synthetic (titano)magnetite samples. Therefore, the electronic structure of V3+ in this mineral was studied in detail. In addition to its interest as a reference compound, tsavorite is a good candidate for the study of the angular dependence of the XAS spectrum in cubic minerals. This angular dependence of XAS was also studied for a non-cubic mineral, anatase, which shows a different behaviour than tsavorite. The study of doped anatase was first motivated by a collaboration with chemists, who study the V-doped anatase synthesis for slications in photocatalysis. I present here their structure and main crystallographic data which are needed for the experimental and theoretical studies.
14 Minerals and experiments
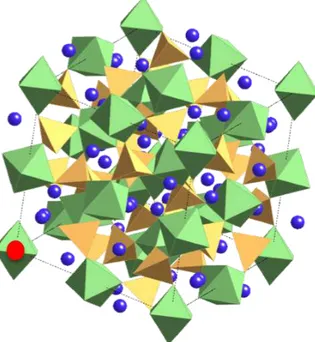
Figure 1.1: Positions of the cations and anions in two neighboring octants in the spinel cubic cell.
1.1.1 Magnetite Fe3O4 The AB2O4 spinel structure
The AB2O4 spinel structure includes several oxides. The O2− anions form a face-centered cubic system and their spatial arrangement defines tetrahedral and octahedral cationic sites, denoted respectively A and B. The conventional cell used to describe the spinel structure is cubic. It has a multiplicity four and it contains 32 oxygen atoms, for 32 A and 64 B sites. Only 8 A and 16 B sites are occupied by cations. The cubic cell therefore contains eight AB2O4 formula units (56 atoms).
The conventional cubic cell (parameter a) is divided into eight subcubes, called octants, with a a/2 edge length. Fig. 1.1 shows the positions of the cations and anions in two neighboring octants. The oxygen atoms form the corners of a tetrahedron which fits in a cube with a edge length a/4. Sites A are situated at the center of every two octants and on half the corners of all the octants. Sites B occupy one octant out of two and sit on the four corners of the a/4 cube which are not occupied by oxygen atoms. The A-O bonds are aligned with the [111] direction whereas the B-O ones are along the [001] one. Along the [001] direction, planes of only A sites alternate with planes of B sites, with a distance of a/8 between two planes. Fig. 1.2 represents the spatial arrangement of octahedral and tetrahedral sites in the cubic cell. The octahedra share edges and form chains along the [110] direction and each octahedron shares corners with six tetrahedra.
Usually, the A sites are too small with respect to the ionic radii of the incorporated cations. The oxygen atoms are therefore shifted along the [111] direction of the tetrahedra towards the cubes with occupied B sites. This displacement is quantified by the u parameter (u = 3/8 in the case of no displacement) [213, 108].
The reference mineral in the spinel family is MgAl2O4, which is given the name "spinel". The other spinels are classified with respect to spinel MgAl2O4, as a function of the site occupied by the divalent cation. If the divalent cation is incorporated in the tetrahedral A site, the structure of the spinel is said to be "normal". On the contrary, if it sits in an octahedral B site, the spinel is said to be "inverse". The incorporation of the cations in a site depends on its size and its crystal-field stabilization energy. For instance, the following minerals have the normal spinel structure: hercynite FeAl2O4, chromite FeCr2O4, magnesiochromite MgCr2O4, galaxite
Minerals and experiments 15
y z x
x y
z
Figure 1.2: Spatial organisation of the tetrahedra and octahedra in the spinel structure.
MnAl2O4. On the contrary , magnetite Fe3O4, jacobsite MgFe2O4 and ulvospinel TiFe2O4 have the inverse spinel structure.
The crystallographic structure of spinel
The space group of spinel is F d¯3m (no.227). Table 1.1 gives the main crystallographic information for the spinel structure. Fig. 1.3 presents all the information on equivalent positions and the group symmetry operations. The structure is described in the International Tables of Crystallography [7] with two possible choices for the origin. For choice 1, the A site is taken as the origin. For choice 2, the origin sits in the B site. The second description is deduced from the first one by a (-1/8, -1/8, -1/8) translation. The local point group of the octahedral site is ¯
3m (D3d in the Schönflies notation). It corresponds to a slightly distorted octahedron with an inversion center: the six Al-O distances are identical but the angles slightly deviate from 90◦.
Site Local point group Wyckoff position Origin choice 1 Origin choice 2
x y z x y z
A ¯43m 8a 0 0 0 1/8 1/8 1/8
B ¯3m 16d 1/8 1/8 1/8 1/2 1/2 1/2
O 3m 32e 0.375 0.375 0.375 0.25 0.25 0.25
Table 1.1: Atomic reduced coordinates, Wyckoff positions and local symmetry for each site in the spinel, for the two origin choices.
Magnetite Fe3O4 and titanomagnetite Fe3−xTixO4
Magnetite Fe3O4 is an inverse spinel: half Fe3+ cations sit in tetrahedral sites, the sec-ond half and the Fe2+ cations in the octahedral ones. The magnetite is therefore written (Fe3+)[Fe2+Fe3+]O
4. The unit-cell parameter of magnetite is a = 8.377 Å [81]. Magnetite has a ferrimagnetic structure: the ions are antiferromagnetically aligned between the A and B sites, and ferromagnetically in the B sites. Magnetite presents a first-order phase transition at TV = 120 K, called the Verwey transition [212]. Verwey proposed that below this temperature,
16 Minerals and experiments
Figure 1.3: Symmetry operations and equivalent positions of the F d¯3m group (Origin choice 2). The first line gives the lattice translations. The first unit (with the multiplicity 192) gives the group symmetry operations. The three units, with multiplicity 32, 16 and 8, indicates the equivalent positions in the cell of the A, B and O atoms respectively. Extracted from the International Tables of Crystallography [7].
a charge ordering takes place among the Fe2+ and Fe3+ cations on the B sites. In its ordering scheme, the [110] and [1¯10] rows of B sites on the (001) planes are occupied alternatively by Fe2+ and Fe3+ [213]. During the transition, the conductivity is reduced by a factor 2 and the residual magnetisation also decreases. The crystallographic structure also changes: below TV, the space group becomes Cc (monoclinic cell) [112, 226].
Titanomagnetite is an intermediate member of the magnetite-ulvospinel solid-solution. The Ti4+ ions substitute for iron ions in the octahedral sites. Consequently, to maintain the charges equilibrium, two Fe3+ cations are replaced by one Ti4+ cation and one Fe2+ cation. The detailed formula of titanomagnetite can thus be written as Fe3+
2−2xFe2+1+xTi4+x O4, where x is the Ti4+ substitution rate.
1.1.2 Tsavorite Ca3Al2(SiO4)3:V3+ The X3Y2Z3O12 garnet structure
In the garnet X3Y2Z3O12structure, the O2− anions form a body-centered cubic system. The cationic sites are dodecahedra, octahedra and tetrahedra, corresponding respectively to sites X, Y and Z. The most common garnets are the silicate ones, with Z=Si4+. Divalent cations sit in the X sites and trivalent ones in the Y sites. The unit cell contains eight formula units (160 atoms). Garnets are nesosilicates and their structure can be described as a tridimensional network of
Minerals and experiments 17 SiO4 tetrahedra connected by corner to YO6 octahedra (Fig. 1.4). Cavities are distorted XO8 dodecahedra. Each tetrahedron shares its corners with four different YO6 octahedra. Each octahedron is linked to six SiO4 tetrahedra by corner and to six XO8dodecahedra by edges. Each dodecahedron shares its edges with four other dodecahedra, four octahedra and two tetraheda, leaving only two free edges.
Figure 1.4: The garnet structure. Left: the structure in the cubic cell (the blue points represent the center of the dodecahedra). Right: A portion of the structure, showing the connection between the tetrahedra and the octahedra. The oxygen atoms are labelled after [155].
The silicate garnets are separated into two families, depending on the presence of Ca2+ cations in the X sites. The calcic garnets (Ca3Y2Si3O12) form the ugrandite family (Uvarovite GRossular ANDradite): grossular Ca3Al2Si3O12, uvarovite Ca3Cr2Si3O12, andradite Ca3Fe2Si3O12, goldmanite Ca3V2Si3O12, etc. The other garnets (X3Y2Si3O12, with X6=Ca) form the pyral-spite family (PYRope ALmandine SPessartine): pyrope Mg3Al2Si3O12, almandine Fe3Al2Si3O12, knorringite Mg3Cr2Si3O12, spessartine Mn3Al2Si3O12, etc.
The crystallographic structure of garnet
The space group of garnet is Ia¯3d (no.230). Table 1.2 gives the main crystallographic in-formation for the garnet structure. Fig. 1.5 presents all the inin-formation on equivalent positions and the group symmetry operations. The local point group of the octahedral site is ¯3 (C3i in the Schönflies notation), which corresponds to a slightly distorted octahedron with an inversion center. The six Al-O distances are identical but the angles slightly deviate from 90◦.
Site Local point group Wyckoff position x y z
X 222 24c 1/8 0 1/4
Y ¯3 16a 0 0 0
Z ¯4 24d 3/8 0 1/4
O 1 96h x y z
Table 1.2: Atomic reduced coordinates, Wyckoff positions and local symmetry for each site in the garnet structure.
18 Minerals and experiments
Figure 1.5: Symmetry operations and equivalent positions of the Ia¯3m group. Extracted from the International Tables of Crystallography [7].
Tsavorite Ca3Al2Si3O12:V3+ is a grossular with vanadium present as a substituted minor element in the Al site. The cell parameter of grossular is a = 11.847 Å. The Al-O distance is 1.926 Å, the Al-Ca and Al-Si ones are 3.31 Å and the Al-Al one 5.130 Å. The oxygen reduced coordinates (x,y,z) are (0.03823, 0.04528, 0.65137) [91]. Fig. 1.6 presents the cubic cell of tsavorite, i.e. the grossular one with a V3+ion substituted for an Al3+ion in an octahedral site. In the grossular cubic cell, the aluminum atoms sit in sixteen equivalent sites, but differently oriented with respect to the cubic frame. They are divided into two groups of eight atoms equivalent by a (1
2, 12, 12) translation. The eight sites of each group are equivalent by space group symmetry operations. Vanadium can substitute for aluminum in any of these eight sites. This point is important for the theoretical study of tsavorite (Chap. 3).
1.1.3 Anatase TiO2
Anatase is one of the three polymorphs of titanium dioxide (TiO2), the two other being rutile and brookite. Anatase and rutile are both tetragonal forms of TiO2, whereas brookite crystallizes in the orthorombic system. Rutile, which is the more abundant phase, is stable above 700◦ and anatase is the stable form at low temperature. Both anatase and rutile are of great interest in catalysis, material sciences [142] and geological sciences [79]. Rutile is prefered over anatase in pigmentary applications as it has a higher refractive index and is less photoactive [22]. Anatase is more efficient than rutile for catalysis applications, such as photocatalysis or dye-sensitized solar cells [137] as it has a high photoreactivity [186]. Both of them have the advantages of being inexpensive, non-toxic, resistant to photo-corrosion and to have an high oxidative power [211].
In anatase, the titanium atoms are at the center of an oxygen octahedron. Each oxygen atom is coordinated to three titanium atoms. Each octahedron is connected to eight octahedra, four by edges and four by corners. Between the occupied octahedra exist vacant tetrahedral and
Minerals and experiments 19
Figure 1.6: The cubic cell of tsavorite. The substituted atom of vanadium is represented by the red point.
octahedral sites. The unit cell is a body-centered tetragonal lattice and contains four formula units per unit cell. The cell parameters are a = 3.78 Å and c = 9.51 Å [111]. The main structural differences between rutile and anatase are the cell parameters (a = 4.59 Å and c = 2.96 Å in rutile) [111] and the secondary coordination: in rutile, the titanium octahedra are joined by sharing only two edges (four edges in anatase).
The space group of anatase is I41/amd (no.141). Table 1.3 gives the main crystallographic information for the anatase structure. Fig. 1.8 presents all the information on equivalent posi-tions and the group symmetry operaposi-tions. The local point group of the octahedral site is ¯4m2 (D2din the Schönflies notation), which corresponds to a distorted octahedron without an inver-sion center. There are two Al-O distances at 1.937 Å and four at 1.965 Å. The angles deviate from 90◦ by ±12.6◦. In anatase, Ti is located at (0,0,0) and O at (0,0,z), with z = 0.20806 [111].
Site Local point group Wyckoff position x y z
Ti ¯4m2 4a 0 0 0
O 2mm 8e 0 0 z
Table 1.3: Atomic reduced coordinates, Wyckoff positions and local symmetry for the Ti and O sites in the anatase structure, with the origin at ¯4m2 (origin choice 1).
1.2
Chemical analyses
The magnetite samples investigated during this thesis were chemically analyzed by several techniques. The synthetic magnetite samples were first analyzed by X-ray diffraction (XRD). Both synthetic and natural samples were characterized by electron microprobe (EMP) analyses and scanning electron microscopy (SEM). The principles of each technique is explained in brief
20 Minerals and experiments
z
y
x
Figure 1.7: Anatase structure
Figure 1.8: Symmetry operations and equivalent positions of the I41/amd group (Origin choice 1).
as they are standard techniques used in this research as complementary tools to X-ray absorption spectroscopy.
1.2.1 X-ray diffraction
XRD is a powerful tool to identify mineral phases present in a sample and to determine a crystallographic structure. It gives access to structural parameters (cell parameters, atomic positions, ...) and provides information also on the sample microstructure (size and shape of the coherent domains). To study crystallized samples, X-rays are particularly suitable as their wavelength is similar the interatomic distances in a crystal. Experiments can be performed on single crystals or powders.
Minerals and experiments 21
!
Sample
Detector
X-ray
source
Figure 1.9: Picture of the θ-θ diffractometer. The sample is kept fixed while the X-rays source and the detector rotate by an angle θ.
The choice of the X-ray source used in XRD experiments depends on the elements present in the sample. It must be done so that no fluorescence radiation creates a high background in the XRD pattern which would obscure weak peaks. This fluorescence baseline is present if the energy of the incident beam is higher but close to the absorption edge energy of an element present in a significant concentration in the sample. In the case of iron oxides, a Co source (E = 7709 eV) is used. As the detector (Fig. 1.9) records the corresponding fluorescence, i.e. the Co Kα1 (6930 eV) and Kα2 (6915 eV) fluorescence lines, the fluorescence of iron (Kα1 = 6403 eV, Kα1 = 6390 eV) is filtered out.
The information in a XRD pattern comes from the angles where the diffraction peaks are observed, from their intensity and from their width. The position of the diffraction peaks is determined by Bragg’s law, which gives the relation between the peak postition (sinθ) to the incident beam wave-length (λ) and the interreticular distances for the (hkℓ) plane family (dhkℓ):
2dh,k,ℓsinθ = nλ (1.1)
This position is determined only by the cell parameters. For a peak related to a (hkℓ) planes family, the diffracted intensity is given by the structure factor, Fhkℓ, which depends on the atomic reduced coordinates in the cell (fi is the diffusion factor of the ith atom):
Fhkℓ = X
fi exp(2iπ(xih + Yik + ziℓ)), (1.2) and by the Debye-Waller factor. Finally, the peak width depends on three parameters: the intrinsic diffractometer instrumental broadening, the presence of elastic constraints in crystals and the size of the coherent domains.
Only the synthesized samples were analyzed by XRD. The measurements were performed at the institute on a θ-θ diffractometer (XpertPro MD, by Panalytical). The diffractometer is shown in Fig. 1.9.
22 Minerals and experiments
1.2.2 Electron microprobe
The electron microprobe (EMP) provides the chemical composition of the sample under investigation. It is a non-destructive method which permits all the elements of the periodic classification from beryllium to be detected with a sensitivity of ∼100ppm. The major and minor elements of the sample can thus be determined. The results are obtained in wt% oxides. The EMP measures the fluorescence yield of the elements present in the sample due to their excitation under an electron beam. As the fluorescence line intensities are proportional to the mass concentration of the corresponding element, the relative proportion of the latter be determined.
The EMP analyses were performed at the CAMPARIS facility of the University Pierre and Marie Curie (Paris, France), with a CAMECA SX50 device. It was operated at 15kV and 40nA, with a counting time varying between 10 and 30 s, depending on the element.
1.2.3 Scanning Electron Microscopy
The scanning electron microscopy (SEM) analysis provides topographical and chemical infor-mation on the sample (grain size, surface roughness, porosity, particle size distribution, material homogeneity, ...). A finely focused electron beam scans across the surface of the samples. The electrons interact with the sample atoms and thus generate several signals, which are collected by different detectors to form 3D images of the sample. The backscattered (or primary) electrons are beam electrons that bounce off nuclei of atoms in the sample; they are used to determine the spatial distribution of elements. The secondary electron imaging provide information on the topography of surface features a few nm across. The interactions between the sample and the beam electrons can also result in a X-ray emission. These fluorescence lines, as for microprobe, provide quantitative information about the elements present in the sample. The determination of the chemical composition with a SEM is called energy-dispersive spectroscopy (EDS).
The SEM analyses of the natural and synthesized magnetite samples were done at the "Labo-ratoire Interfaces et Systèmes Electrochimiques" of the University Pierre and Marie Curie (Paris, France) using a LEICA S440. Analyses were also performed at the Industrial Minerals and Met-als Research Institute, of the Department of MateriMet-als Science and Metallurgical Engineering, at the University of Pretoria (South Africa). The microscope was a Jeol JSM 6300. Both mi-croscopes have a tungsten filament electron gun. The images were taken using a Centaurus backscattered electron detector, with an accelerating voltage of 15kV.
1.3
X-ray Absorption Spectroscopy
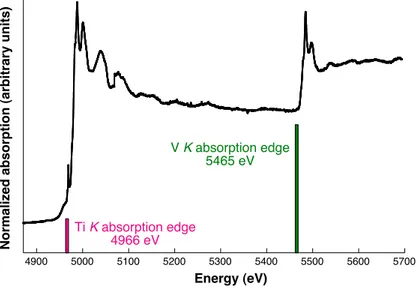
X-ray absorption spectroscopy (XAS) is a powerful tool to study the electronic and crystal-lographic structures around an atom in a structure, whether an impurity in a host-mineral or a major component element of the mineral. The first advantage of XAS is that this technique is chemically selective: each element has its own edge energy, and the energy shift between two edges is significant enough so that two successive edges do not superimpose (Fig. 1.10). All the chemical species are accessible by XAS. The second advantage of XAS is its orbital selectivity: as the binding energies of the core levels are different, one can choose the level where the electron is excited and consequently which empty states are probed. In the electric dipole approximation, the transitions must obey this selection rule: ∆ℓ = ±1. In this approximation, K edge thus corresponds to transitions from 1s to p states, L1 edge from 2s to p, L2,3 edges from 2p levels to d ones, M1 edge from 3s to p, M2,3 edge from 3p to d, M4,5 edge from 3d to f... The electric
Minerals and experiments 23 quadrupole approximation is defined by ∆ℓ = ±2 or 0 (except if the ground state is an s one). Therefore, in this approximation, K edge also corresponds to transitions from 1s to d states. These chemical and orbital selectivities permit access to the electronic structure of the absorbing atom (oxidation state, type of the chemical bindings, ...). XAS is also a structural probe that does not need long-range order. Hence both crystals and amorphous materials can be studied equally well using this technique, and the local and medium-range orders around the absorbing atom can be determined.
1000 2000 3000 4000 5000 6000 7000 8000 9000 1 104 Energie (eV) Si Al Ca V CrMn FeCo Ni Cu Zn Mg Ti a)
Figure 1.10: Representation of the K -edge position of various elements, illustrating the chemical se-lectivity of XAS.
1.3.1 Principle
During the XAS process, a core electron is excited by absorbing a photon with an energy ~ω. The excited electron is called photoelectron. The variation of the X-ray absorption coefficient is measured as a function of the incident radiation energy (E). The Bouguer law describes the absorption of the X-rays by matter:
I = I0· exp(−µ(E)x) (1.3)
where I0 is the incident beam intensity, I the one of the transmitted beam, µ the absorption coefficient of the probed element and x the sample thickness.
During my thesis, I performed measurements on dilute samples at the V K -edge. In that case, the fluorescence detection mode is used and a fluorescence yield, proportional to If
I0 (If is the fluorescence intensity), is determined. If the samples had been concentrated (i.e. if the concentration of vanadium had exceeded a few percents in oxide weight), the absorption co-efficient would have been calculated with the previous equation (1.3) and transmission would have been used as a detection mode. These different detection modes are presented in Fig. 1.11.
Fig. 1.12 presents a XAS spectrum recorded at the V K -edge of tsavorite. The structures that compose a XAS spectrum are due to the interactions of the photoelectron with the neighboring atoms of the absorbing atom. The spectrum can be divided in three regions, depending on the incident X-rays energy.
• In the region before the edge, the incident photoelectron energy E is too weak to excite core electrons. A continuous background is recorded, due to the presence in the sample of other elements with a lower edge-energy than the one of the probed element (Fig. 1.12a). This background of the absorption coefficient constitutes the spectrum baseline.


![Figure 1.5: Symmetry operations and equivalent positions of the Ia¯3m group. Extracted from the International Tables of Crystallography [7].](https://thumb-eu.123doks.com/thumbv2/123doknet/2319122.28579/39.892.148.745.89.461/figure-symmetry-operations-equivalent-positions-extracted-international-crystallography.webp)