HAL Id: hal-00351757
https://hal.archives-ouvertes.fr/hal-00351757
Submitted on 11 Jan 2009
HAL is a multi-disciplinary open access
archive for the deposit and dissemination of
sci-entific research documents, whether they are
pub-lished or not. The documents may come from
teaching and research institutions in France or
abroad, or from public or private research centers.
L’archive ouverte pluridisciplinaire HAL, est
destinée au dépôt et à la diffusion de documents
scientifiques de niveau recherche, publiés ou non,
émanant des établissements d’enseignement et de
recherche français ou étrangers, des laboratoires
publics ou privés.
Distributed under a Creative Commons Attribution| 4.0 International License
Correlation between the internal length, the fracture
process zone and size effect in model materials
Khalil Haidar, Gilles Pijaudier-Cabot, Jean-François Dubé, Ahmed Loukili
To cite this version:
Khalil Haidar, Gilles Pijaudier-Cabot, Jean-François Dubé, Ahmed Loukili. Correlation between the
internal length, the fracture process zone and size effect in model materials. Materials and Structures,
Springer Verlag, 2005, 38 (2), pp.201-210. �10.1007/BF02479345�. �hal-00351757�
Correlation between the internal length, the fracture
process zone and size effect in model materials
K. Haidar
1,G. Pijaudier-Cabot
1,J.F. Dube
2and A. Loukili
1(1) R&DO- Institut de Recherche en Genie Civil et Mecanique (GeM), UMR CNRS 6183, Ecole Centrale de Nantes, France (2) LMGC, UMR5508, Universite Montpellier, France.
ABSTRACT
In this paper, we examine the correlation between the width of the fracture process zone, the parameters entering in the description of size effect (related to the dimension of the specimen especially), and the internal length in non local constitutive relations for a model mortar material with a controlled macro-porosity. Experimental investigations on this material in compression, bending, acoustic emission measurements and their analysis are detailed. The experiments show a good agreement between the evolution of Ba2ant' s size effect parameter d0 and the evolution of the width of the FPZ. The internal length obtained with the help of inverse finite element analysis is also proportional to these quantities. This correlation provides a reasonable approximation of the internal length, from an experimental test on specimens of a single size directly, equipped with acoustic emission localization devices.
RESUME
Dans cet article, nous examinons les com?lations entre la largeur de la zone de microfissuration (FPZ), les parametres entrant dans la description de l'effet d'echelle et la longueur interne du modele d'endommagement non local pour un mortier
a
macro-parasite controtee. Des resultats experimentaux sur ce materiau en compression, enjlexion ainsi que des mesures d'emission acoustiques et leur analyse sont presentes. Les resultats d'essais montrent une bonne correlation entre !'evolution du parametre do. parametre de la loi d'effit d'echelle de Bcdant, et la largeur de la FPZ. La longueur interne obtenue numeriquement par analyse inverse est aussi proportionnelle a ces parametres. Une bonne approximation de la longueur internea
partir d'essais sur une seule taille d'eprouvette equipee d'un systeme d'emission acoustique est aussi obtenue.1.
INTRODUCTION
In quasi-brittle materials, fracture exhibits a fmite size fracture process zone (FPZ). Macro-cracking is the result of progressive material damage in which micro-cracks appear first in a rather diffuse way, and then coalescence occurs in order to form the macro-crack. The size of the resulting fracture process zone is not dependent on the structural size, provided it does not interfere with the boundaries of the considered body. It is controlled by local heterogeneities, and by the state of stress as well. A consequence of the existence of such a FPZ is structural size effect [I]. Since the ratio of the volume of the FPZ to the total volume of the structure changes for geometrically similar specimens, a size effect on the structural strength is observed experimentally. It is milder than
the structural size effect observed in linear elastic fracture mechanics (LEFM) but often more pronounced than the statistical size effect, e.g. described by Weibull's theory. In fact, it is a transitional size effect between strength of material theories and LEFM. From the modeling point of view, the description of the FPZ has to involve the introduction of an internal length in the governing constitutive equations. It can be in the form of a characteristic length which is related to the length of the process zone, Irwin's length or the size of the cohesive zone in Hillerborg's model [2], or in the form of an internal length in non local constitutive relations as defmed among many others [3]. This internal length can be related to the width of the fracture process zone [4-6]. Those constitutive theories do predict size effect on the structural strength. In fact a proper description of the response of geometrically similar
specimens can serve as a good method of calibration of the model parameters, including the internal Length of the material [7, 8].
One of the open issues in non local modeling is direct measurement of this internal length or, in other words, experimental techniques which aim at observing the fracture process zone. Measurements of displacement fields [9, IO]is a possibility but still it is an indirect one since cracking is deduced from large strain gradients. In some polymers for instance, cracking can be directly observed with optical techniques that can hardly be devised if the specimen is not translucid. X-ray techniques have also been considered with success [11]. For cementitious materials, this method is quite demanding in term of energy ofX-rays if one wants to achieve the resolution that is required in order to detect small micro-cracks (with an opening that is of the order of microns). Other research efforts have been reported to estimate the extent of the FPZ in concrete using the ultrasonic pulse velocity technique [12, 13]. Acoustic emission (AE) is also an experimental tool well suited for monitoring fracture processes. The elastic wave generated by cracking events can be measured and processed using seismic analysis techniques. The strength of AE techniques is the ability to monitor microscopic damage occurring inside the material. Several works have focused on relating acoustic emission characteristics to the properties of the fracture process zone [14), and AE source localization analysis to the damage distribution [lS]. Mihashi et al. [16] applied three-dimensional acoustic emission techniques to
study the FPZ. The results revealed that micro-cracking occurs randomly around the macro-crack and that the FPZ expands after peak load due to the presence of aggregates. Otsuka et al. [ 17] sbow that the location of cracks, obtained by the AE method, has a close relation to the extent of the fracture process zones observed with X-rays.
The aim of this contribution is to examine the experimental correlation between the width of the fracture process zone observed with AE analysis, the parameters entering in the description of size effect, and the internal length in non local constitutive relations. In order to examine such a correlation, an experimental program on mortar and model materials with controlled (macro) porosity is presented in the next section. Results are discussed in section 3. The correlations between size effect parameters, the width of the FPZ and the internal length of the material obtained from inverse analysis of size effect tests are discussed in section 4.
2. EXPERIMENTS
ON
MORTAR AND
MODEL MATERIALS
The experimental program has been designed in order to measure the mechanical characteristics of mortar specimens with a controlled microstructure (18]. This control was achieved by adding inclusions of weak mechanical characteristics (polystyrene beads) in a mortar matrix. Depending on the amount of inclusions added in the cementitious matrix, variations of the elastic properties, of the tensile and compressive strengths and of the fracture energy are expected. Data on this simple model material are
also expected to be correlated with homogenization theories.
All test specimens were made with a mix which consists of ordinary Portland cement CPA-CEMI 52.5, polystyrene beads, normal density fine sand with a maximum size of 2 mm, a superplasticizing agent (Glenium 51) and water. Expanded polystyrene spheres of 3-7 mm mean diameter were used as aggregate in the mix design. The spheres have a mass density of20 kg/m3, a Young's modulus of7 MPa and a compressive strength of 80 kPa. Expanded polystyrene consists essentially of air 98%. It is hydrophobic [19). Mix preparation is particularly important when using such very lightweight aggregates. Expanded polystyrene tends to float on the top of the moulds during vibration, increasing the risk of poor mix distribution and segregation. Based on Y arnura and Y arnuchi [20) and Perry et al. [21 ], controlled mix conditions were achieved by mixing the dry sand and cement before adding the water and then the superplasticizer. After sufficient mixing time (2-3 minutes), the polystyrene beads were added and thoroughly mixed into the mortar. In order to minimize segregation, vibration was avoided, and all test specimens were compacted by hand tamping. Fig. l shows the distribution of polystyrene beads achieved for the mix with the lowest density (1.4).
Four different mixes of densities 2.0, 1.8, 1.6 and 1.4, having polystyrene content g of 13, 22, 31 and 39% respectively, were achieved for the present test program (Table 1 ), in addition to the reference material (mortar without inclusions). All mixes have a cement/sand ratio of 0.46 and a water/cement ratio of 0.4. The polystyrene content g % (in volume) which must be incorporated to obtain the desired density is calculated from the formula:
g
d
m-
d
b
(
3)d
m-
d
p
where db is the density of the desired mixture, d., is the density of the reference mortar, and dp is the density of the polystyrene beads.
Cylindrical concrete specimens of diameter 11 cm and
Table 1 - Mortar mixture proportions
Mix ECHO ECHI ECH2 ECH3 ECH4
Density 2.3 2.0 1.8 1.6 1.4 Cement (kg!m3) 640 558 502 446 389 Sand (kg/m3 ) 1395 1215 1096 969 846 polystyrene (kglm3) 0.0 2.16 4.31 5.16 6.65 Superplastizer (kglm3) 6.4 5.58 5.02 4.46 3.89 Water(Vm3) 250 219 197 175 153 Slump (cm) 12.2 9.45 7.5 5.15 2.15
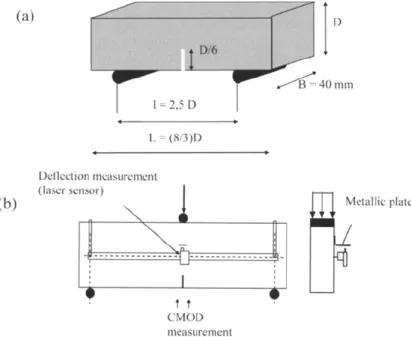
length 22 cm were used for compressive tests. For the bending
tests, four different sizes of geometrically notched concrete
specimens were used. The depths were D = 40, 80, 160 and
320 mm while the thickness was kept constant for all the
specimens b = 40
mm.
The length to depth ratio was LID = 8:3and the span to depth ratio was 1/D = 2.5 for all specimens.
One notch of depth D/6 and thickness 1.5 mm (same for all dimensions) was placed in each bending specimen by putting steel plates in the moulds before casting (Fig. 2). For the
acoustic emission measurements, only specimens of depth D ==
160 mm were tested. Three identical specimens were cast
simultaneously from each successive batch, for each type of
test. Curing conditions were 28 days at 100% RH and 20° C.
2.1 Elastic properties and compressive strength
The compression tests were performed using 300 kN
capacity hydraulic testing machine at a loading rate of
0.5 MPa/s until failure. The compressive strength f.
,
tensilestrength/, and the Young's modulus Ec change significantly
with the polystyrene content (Table 2). Mixtures ECHl
-ECH2 - ECH3 and ECH4 showed nominal elastic modulus
(a) (b) L (8/3)0 Dcllccuon mcasur..:mcnl (laser sensor) t t CMOD measurement
Table 2 -Mechanical properties of test mix
Mix ECHO ECH1 ECH2 ECH3 ECH4
fc (MPa) 59.8 36.8 27.6 23.7 16.1
ft
(MPa) 4.27 3.93 3.05 2.35 1.82 Ec(GPa) 33.4 25.9 23 17.2 14values, measured at one third of the failure stress of 25900 - 23000 - 17200 and 14000 MPa respectively.
Compared to the Young's modulus of the reference
material ECHO, the decrease is 22-31-49 and 58%
respectively. Concerning the compressive strength, the
decrease is about 40, 54, 61 and 72% compared to the
compressive strength of the reference material.
For the Young's modulus at least, these data can be compared with results from homogenization theories. A possible candidate, among many others, is the well known
formula [22, 23)
E
c=
(l
-
gy
Eo
(2)where Ec is the Young's modulus of the material with
polystyrene content g and E0 is the Young's modulus of the
reference material. Fig. 3 compares the measured values of elastic modulus with the above equation. A very good agreement is obtained.
2.2 Size effect tests
The size effect tests followed the guidelines established by RILEM [24] using a closed - loop testing machine, (a 160 kN
capacity INSTRON machine). The tests were notch opening
controlled with a constant CMOD rate of 0.1 J.l.m/s forD = 40-80 mm; 0.20 (lmiS for D = 160 mm and 0.25 (lmls for D ==
320 mm. For each size and each mix, the dispersion over the
three specimens tested is quite small and in the
following we are going to show average curves only.
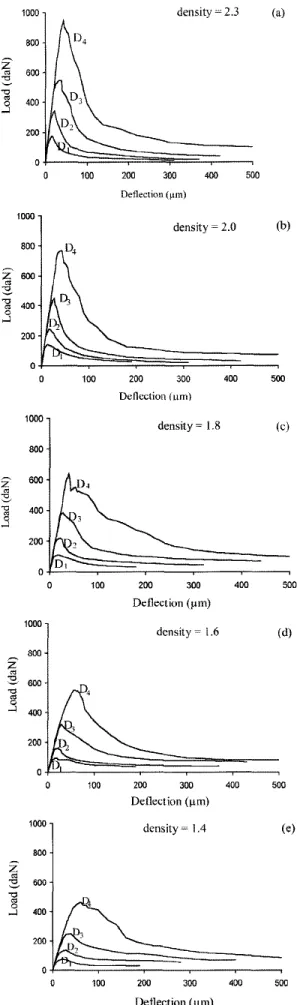
Fig. 4 shows the response of medium size specimen
(D
=
40 mm) for each material density. Note that thedeflection at peak is almost independent from the
density of the material. The material density influences still the mechanical behavior of beams; the
lower the density, the lower the stiffuess and the peak
load. Fig. 5 shows the average load - deflection plots for the four sizes of beam and for the five different
densities.
These data are going to be interpreted with the
help of Ba2ant's size effect law. This theory is here
restricted to the dependence of the nominal stress at
failure ON on the characteristic dimension D of 2D
geometrically similar specimens. For stress - based
failure theories such as the plastic limit analysis or elastic allowable strength design, there is no size
effect, ON is constant. For classical linear clastic
fracture mechanics, ON
a
D"112• Due to the influenceof a relatively large micro-cracked zone that blunts
Fig. 2 -(a) Description of mortar samples; (b) Description of instrumentation for the bending tests.
the crack front in concrete, size effect is intermediate
40 -;;s-Q.. 30
s
V> ::I~
20 E () 't; 10 ~ t:ij A experimental - homogenisation 0~----~----~---r----~----~ 0.0 0.1 0.2 0.3 0.4 0.5Polystyrene content g
Fig. 3-Variation of elastic modulus with polystyrene content.
200 JOx40x I 07 mm 1 he-am 160 120 z
"'
~ 80 ~ ~ _, 40 0 0 50 100 150 200 Ddl<ctwn (~111)Fig. 4 -Influence of density on structural behavior, average l
oad-deflection curves for different material density on 40 x 40 x 107 nun3
beams.
mechanics and it represents a transition from the former to the
latter design criteria as the size increased. This transition is
described by the approximate formula:
aN =
~
with
fJ
=
DId
01
+
fJ
(3) where j; is the tensile strength of the material, d0 is a
characteristic size that corresponds to a change of
mechanisms between plasticity phenomena and fracture mechanics, and B is a material parameter which is a
function of the geometry of the specimen and applied load.
crN is calculated according to the classical formula for a beam of unit thickness:
/'T' _ 3
FL
V N-
2
0
.
83
D 2(4) where F is the maximal load and L is the length between
supports. The peak forces are obtained from load - deflection curves in Fig. 5, for each size and for each density. The
nominal strengths (calculated from Equation (4)) are given in
Table 3.
The values of
BJ;
andd
0 in Equation (3) are obtainedfrom a linear regression:
1000 800
z
"' 600 "C ' -] 400 200 1000 800z
"'
~ 600 "C <: 400 0 ...J 200 0 0 1000 600:z
600 "' :::::, "0 "'.s
400 200 0 0 1000 800z
"' ~ 600 "C ~ -l 400 200 0 0 1000 800 z ~ 600 "C 13 -l 400 200 0 0 100 100 100 100 100 density ~ 2.3 (a) 200 300 400 500 Deflection (~m) density= 2.0 (b) 200 300 400 500 Deflection Cum) density= 1.8 (c) 200 300 400 500 Detlection (IJm) density~ 1.6 (d) 200 300 400 500 Deflection (~-tm) density m 1.4 (e) 200 300 400 500 Deflection (~-tm)Fig. 5 -Curves representing for each size the average
Table 3 -Maximum strength and fracture parameters the backgrolUld noise, the signal detection threshold was set at a value of about 30 dB
(value adjusted before every test).
obtained from size effect analysis for each density
cr (MPa) MIX Dl=40mm D2=80mm 03==160 mm D4=320mm ECHO 3.99 3.64 3.21 2.82 ECHI 3.26 2.82 2.39 . 2.32 ECH2 2.51 2.18 2.21 1.9 ECH3 2.22 1.86 1.92 1.65 ECH4 1.76 1.61 1.48 1.39
Y=AX+C
(5) in whichX~
D
,
Y
~
(-;-J
8/,
~
Jc.
d
,
~
~
(6)The fracture energy Gfi defined as the energy release rate required for crack growth in an infinitely large specimen, is
calculated from the formula:
(7)
where
a
0 =0o
ID,a
0 is the notch length, D is the beamdepth, and g(
a
0 ) is a non-dimensional energy release rate of the specimen according to the linear elastic fracturemechanics, which can be found for basic specimen geometries in handbooks [25).
From the data in Table 3, it is found that the fracture energy G1shifts from the value 88.5 N/m for the reference material to
52.30 N/m for the material density 1.4, a decrease of 41% (Table 3). In Fig. 6, results are presented in a Jog( er
I
BJ; )
v.s. log( Dl do) diagram only for the two extreme densities 1.4and 2.3 for more clarity. The strength of material criterion and the LEFM criterion are also shown. The larger the beam, the
lower the relative strength. It can be noticed that the failure of the beams with polystyrene (density = 1.4) tends to adhere
more to strength of material than to fracture mechanics, since
the corresponding data shift right on the size effect plot It means that the material becomes more ductile as the density decreases (increasing porosity).
3. ACCOUSTIC
.EMISSION ANALYSIS
'
The AE system comprised of an eight-channel MISTRAS system, a general-purpose interface bus (PCI-DISP4) and a PC for data storage analysis. Tirree piezoelectric transducers (resonant frequency of 150 k.Hz) were used. Transducers were
placed around the expected location of the process zone to
minimize errors in the AE event localization program. They
were placed on one side of the specimen, in a triangular array (Fig. 7) and coupled to the specimen with silicon. The detected signals were amplified with a 40 dB gain differential amplifier
in a frequency band from 20 to 1200 kHz. In order to overcome
<IQ (mm) 258 318 435 463 484 Gr (N/m) 88.50 72.40 66.50 59.70 52.30
The accuracy of the localization of acoustic events was tested before applying any load.
An
event was generated at severallocations on the surface of the specimens,
where the transducers were placed, and the
results from the localization software were compared with the true location of this event. The accuracy of the technique ranged
from ± 4 mm for the reference mortar to ± I 0 mm for the lighter material tested (density 1.8). Similar simulations where performed on the opposite side of the location of the transducers, using an
HSU Nielsen simulator. The aim is to know the effect of the beam thickness on the localization of AE events. Again an acceptable accuracy was observed with values ranging
from ± 5 mm for the reference mortar to ± 8 mm for the
lighter material tested. Overall the incertitude of AE measurements is in the range of the inclusion size. The
decrease of accuracy as the amount of inclusions increases
in the material can be explained by dispersion effects which become more and more pronounced as the number of particles increases and their relative distance decreases. AE
analysis was performed on specimens of size (40xl60x428 mm3) and for three different material
densities (2.3, 2.0 and 1.8) with which localization errors
-0.06 iC -0.12 ~ ~ -0.18 -0.24 I density= 2.3 + density = 1.40 -0.30
+----....---.---
...
----.---1.2 .o.s -0.4 00 04 log (D/d0)Fig. 6-BliZant's size effect law for material densities of2.3 and 1.4.
6.5cm
40cm 42.8 Cltl
A[ 1rnnsduccr
.. I
'''"' I t''"'
...
.
~t: tH: • a4dil I t:t,.lt.D•III,.
.
..
, . 1 I.
..
... I "..
••
•
(a) [Crff: ....
'
':..
0 0 0 • (b) "'u •Fig. 8- Cumulative location orAE events: (a) material density 2.3; (b) material density 1.8.
are less or equal to± 10 mm.
The cumulated locations of acoustic events throughout a
test are shown in Fig. 8: the plotted points indicate the detected AE sources over a window of observation centered at the notch of width 130 mm and covering the beam depth. For the specimen with density 2.3, AE events are located into a
smaller region than for the specimen with the lower density. In the same figure, we have plotted the observed crack path that appeared after the test on the lateral surface of the specimen.
The major aim of the AE analysis is to obtain an
experimental characterization of the FPZ. More specifically, it is the width of the FPZ which is the quantity of interest since it
is related to the internal length
in
continuum models (4] and to the parameter do obtained from Baiant's size effect analysis[ 4]. A useful approach, well suited to measure the crack band width, is to divide the specimen into an array of rectangular
elements and to count the AE events located within each
element. The fineness of the grid should give a sufficient number of events per element and it should not be too small compared to the accuracy of the AE localization method. A
grid of size I x 1 cm is used here. The cumulative number of events, i.e. the sum over the entire record during the
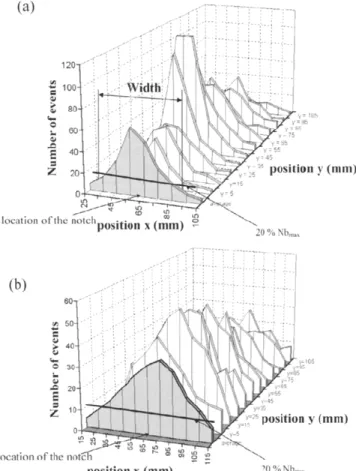
experiment, is plotted as a function of its horizontal position x for various vertical positions y over the depth of the specimen,
(a) 120 ~
..
100 ' 80...
0 .. 00..
or> E 4()"
z
:10 position y (mm)Fig. 9 -Evolution of cumulative events per grid: (a) material density 2.3; (b) material density 1.8 .
and for densities 2.3 and 1.8 (Fig. 9). x
=
65 mm correspondsto the location of the notch. The average curve in both cases is
also presented in grey color.
We have plotted in the same graph the horizontal straight
line which intersects the vertical axis at the value = 20 % of
Nbmax (Nbmax is the maximum number of events on the
average curve). Then. we defme the crack band width
arbitrarily as the length of the segment of this horizontal
straight line which intersects the average distribution of AE
events (Fig. 9). This value is about 50, 67 and 85 mm for the
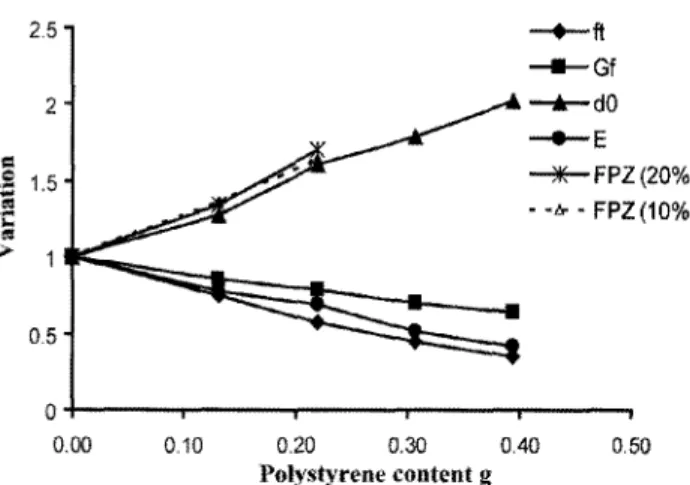
material density 2.3, 2.0 and 1.8 respectively. Fig. 10 shows the evolution of the width of the FPZ defmed according to this criterion with the mass density of the specimens. We have also studied the case where the horizontal straight line intersects the
vertical axis at the value = I 0 % of Nbmax, and we have
observed Umt the evolution of the width of the FPZ, as a
function of the polystyrene content g, is the same as shown in
Fig. I 0. On the same graph, the evolution of do, of the fracture
energy Gf of the tensile strength ft and of the Young's
modulus E are also plotted. Note that there is a very good agreement between the evolution of do and the evolution of the
width of the FPZ. For the reference material do = 258 mm and
the width of the FPZ is 50 mm. The ratio dr/FPZ = 5.16
depends of course on the cut off criterion employed in order to
2.5 2
=
=
1.5 ;::"'
'I:"'
>-0.5 0 0.00 0.10 0.20 0.30 Polystyrene content g -+-ft - G f -+-dO -+-E ~FPZ(20%) - - & -FPZ(10%) 0.40 0.50Fig. 10 - Evolution of mechanical properties with polystyrene content.
4. CORRELATION WITH THE INTERNAL
LENGTH
We are going now to compare the experimental quantities determined in the previous section, namely the width of the FPZ and the parameter d0, with the internal
length in a continuum model. This internal length is obtained with the help of inverse finite element analysis, following the procedure described by Le Bellego et al. [8]. Let us first recall briefly the constitutive equations that will be implemented in the computations.
Non local damage model and calibration from size effect experiments
The non local version of the isotropic damage model due to Mazars [27] has been used for the present study. Note that any other model could have been used equivalently, provided it contains an internal length. The results would differ only by the ratio of the width of the FPZ to the internal length. In the reversible (elastic) domain, the stress-strain relation reads:
a=(I-d)De:c (8)
where & is the strain tensor, and
De
is the elastic stiffness of the material in the absence of damage. d is the damage scalar variable which varies between 0 and 1. In the non local version of this model, the growth of damage is controlled by the average&
of an equivalent strain ; defined as:(9)
where &; are the principal strains and ( ) + is the Macauley bracket. The average (non local) equivalent strain is
&(x)=-1- Jlf/(x-s)S"(s)ds with V,:(x)= Jlf/(x-s)ds (10)
V,:(x)0 n
where Q is the volume of the structure, Vr(x) is the representative volume at point x, and lf/(x-s) is the weight function:
(11)
le
is the internal length of the non local continuum. The loading function is j{&,K)=&-K, where K is the hardening-softening variable. The contour J(&,K)=o
defmes the domain of reversible behaviour and the growth of damage is defmed with classical Kuhn-Tucker conditions. The damage evolution laws are as proposed by Mazars (1984). In particular, the tensile damage growth is:dt=l KO(l-At) At
K exp(Bt(K-KO)) (12)
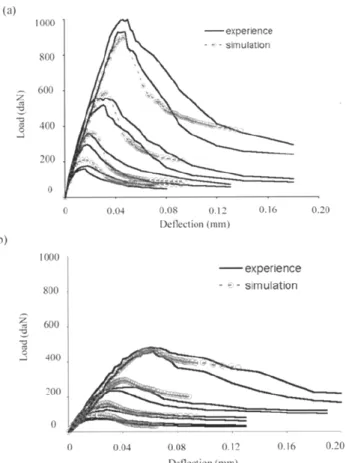
Constants At, Bt are model parameters. The calibration procedure aims at obtaining the model parameters that are involved in the tensile response of concrete only. It is based on a simultaneous fit of the numerical and experimental load deflection curves for the four sizes of specimens. The procedure uses a Levengerg-Marquardt algorithm [8]. Fig. 11 shows the fits obtained for the reference material and for the lowest material density (1.4). The internal lengths and the others model parameters obtained as a result of these fits are reported in Table 4. The internal length increases by 43 % and the damage threshold is approximately unchanged for the material density 1.4, compared to that of the reference material.
5. CORRELATION WITH
EXPERIMENTAL DATA
The distribution of damage for specimen (40xl60x428 mm\ obtained with the finite element computation at the final load step is presented in Fig. 12a. Same as for the acoustic emission tests we have plotted the damage profiles, over the same window of observation as for the AE analysis, at the final load step, and as a function of its horizontal position x for various vertical position y over the specimen (Fig. 12b ). The average curve is presented in grey colour. We define the width of the numerical FPZ following the same technique as for AE analyses. Nbmax is replaced with the maximum value of damage and the cut off criterion is 20% of maximal damage. The widths of the numerical FPZ are 75 mm for the reference material, 120 mm for material density 1.8, and 139 mm for the lowest material density. They are 40 percent greater than the experimental ones. There are several reasons for this discrepancy: first the measurement from the computations ought to overestimate the FPZ width. With mesh refinements, the width of the FPZ decreases as the interpolation of displacement provides a better approximation of the solution (and sharp displacement gradients can be better captured). The second reason is due to the accuracy of the AE localization technique (about 5 mm for material density 2.3 and 15 mm for the lowest material
(a) 1000 ~00 ~ (>(k) " ~ "'!) ~(I()
a
-2(1() () (h) 1000 1!00 /!
WO ~ 4()() :'00 0 0.11-1 () (lol-l 0.08 - experence srnulauon 011 0.16 Ddlcction (mm) - experience - • -s1mulat1on OOM 012 016 O.:fle~1ionl mm) 0.20Fig. 11 • Model calibration for mortar beams with material density
2.3 (a) and 1.4 (b).
Table 4 -Set of model parameters resulting from opt.imised fits
Density le (mm) 1«> At Bt
2.3 34.4 4.61
w·
>
0.79 98361.8 51.5 4.66
w·
>
0.65 92201.4 64.2 4.79
w
·,
0.52 7893density). The third reason is that the experimental method
cannot detect all the acoustic events. If they are located far
away from the sensor locations, they can hardly be detected
with a sufficient accuracy by the localization program and may be shielded by others, closer to the sensors. Finally, AE detects events that are due to micro-crack opening, but also
some events due to the friction between lips of micro-cracks. These events occurs inside the FPZ (when micro-cracks have developed) and may again shield others, more remote events
that are really due to micro-crack opening in the material.
A more positive observation is that the ratio between the computed and measured widths of the FPZ is constant
whatever the mass density of the material as shown in
Fig. 13. This indicates that there is a systematic bias between the experimental and numerical methods of determination of the width of the FPZ. In the same figure,
we have plotted also the evolution of Bazant's size effect
parameter do and of the internal length with the mass density of the specimens. Similar variations of these four
parameters are observed for all the material densities c.onsidered in this study.
Qualitatively, there is a good agreement with the result
(a) tb) 0.8
..
:J) oe,.
E,.
o• Q position y (mm)•
*
:1 location ot the m~ch • • ( )~ ~ po~lllon 1 mm-Fig. 12 -Distribution of damage for material density 2.3 (a), and
damage profiles (b). 2.5 20 c
.s:
-1.5 ~ .,._dO 'i: ~ -+-FPZ (experimental)
>
1.0 FPZ (numerical) _.,_le 0.5 0.0 0.1 0.2 0.3 0.4 0.5Polystyr
en
e
content
g
Fig. 13 • !:volution of do. FPZ (experimental), FPZ (numerical) and internal length with polystyrene content.
obtained by Bafant and Pijaudier-Cabot [3], where the
width of the zone of localized damage is proportional to the internal length of the materiaL Quantitatively, our results
show that the coefficient of proportionality between the internal length and the width of the FPZ are different The ratio is 1.42 if we consider the experimental value of the
FPZ defmed with a cut off at 20% of the maximum number
of events and 2.0 if we take a cut off at 10%. This ratio is 2.14 if we consider the computed value of the FPZ with a
cut off at 20% of maximum damage and 2.6 for a cut off at 10%. According to Bafant and Pijaudier-Cabot (3], this
coefficient should be about 1.89, but it has been obtained
from a one dimensional analysis of a tensile specimen
(instead of a 2D bending problem). Such results ought to be analysed in the light of expected relative errors: according
to Le Belh~go et al. [8], the relative error in the determination of the internal length from inverse analysis of size effect tests is about 15%. The relative error in the experimental determination of the width of the FPZ is at least of the order of 20% in view of the accuracy of the localization of AE events. It follows that a 35% relative error on the determination of the ratio between the internal length and the experimentally measured width of the FPZ can be expected. Considering that the AE technique filters, the experimental measurement ought to be a lower bound of the "true" width of the FPZ. Considering also that FE computations provide an upper bounds, our results are rather consistent.
The correlations between the internal length in the non local constitutive relations, the width of the FPZ observed with acoustic emission analysis, and the parameter d0 of the Bazant's size effect law have been studied in this contribution. Experimental investigations have been carried out on a model mortar material with controlled macro-porosity. The macro-porosity was controlled by adding polystyrene beads in a mortar matrix. Size effect experiments show that the material becomes more ductile as the initial macro-porosity increases. There is a decrease of the fracture energy and an increase of the parameter d0 •
Acoustic emission tests show that the width of the FPZ increases with the porosity. The internal length obtained with the help of inverse finite element analysis increases too. The relative evolutions of these parameters with the mass density of the material are exactly the same.
From these data, it is also possible to conclude on several techniques for the experimental determination of the internal length in the non local damage model:
• The first one is the inverse finite element analysis of size effect tests, as reported by Le Bellego et al. [8]. • The second one still uses size effect tests, but only the
correlation between the parameters in the size effect law and the internal length. Experiments show that the ratio of d0 to the internal length is the same, whatever
the material density. The accuracy of such a determination of the internal length relies on the capabilities of the size effect law, and of the constitutive relations to capture the observed variations of nominal stresses as closely as possible.
• Finally the third one can be based on the experimental determination of the width of the FPZ, and the ratio of this quantity to the internal length. Contrary to the first two techniques, this one does not require size effect tests but AE analysis devices.
Obviously, the last two methods rely on the knowledge of the ratios between the internal length, d0, and the width of the FPZ
(which in turn depend on the criteria employed for defining it from AE event maps). We have shown in this paper that these ratios do not depend on the amount of soft inclusions in the material (polystyrene beads). A similar result can be expected when aggregates are considered instead of soft inclusions, but the value of these ratios ought to be determined experimentally. They could be considered to be rather constant for instance for regular, of for high strength concrete, with probably different values. One should keep in mind, however, that the values of the internal lengths obtained from such ratios
may be less accurate than those deriving from inverse analysis of size effect tests.
ACKNOWLEDGEMENTS
Financial support from the "Action Concertee Incitative-Jeunes Chercheurs" of the French ministry of research is gratefully acknowledged.
REFERENCES
[1] Ba2ant, Z.P. and Planas, J., 'Fracture and size effect in concrete and other quasibrittle materials', CRC Press (I 998).
[2] Hillerborg, A., Modeer, M., and Petersson, P.E., 'Analysis of crack formation and crack growth in concrete by means of fracture mechanics and finite elements', Cem. Concr. Res. 6
(1976) 773-781.
[3] Ba2ant, Z.P. and Pijaudier-Cabot, G., 'Measurement of the characteristic length of non local continuum', J Engrg. Mech.
ASCE 115 (1989) 755-767
[4] Mazars, J. and Pijaudier-Cabot, G., 'From damage to fracture mechanics and conversely: a combined approach' Int. J
Solids. Struct. 33 (1996) 3327-3342.
[5] Sluys L.J., 'Wave propagation, localization and dispersion in softening solids' PhD thesis, Delft University of Technology, Delft, The Netherlands (1992).
[6] Peerlings, R.H., de Borst, R., Brekelmans, W.A.M. and de Vree, J.H.P., 'Gradient enhanced damage for quasi-brittle materials', Int. J Num. Meth. Engrg. 39 (1996) 3391-3403.
[7] Carmeliet, J., 'Optimal estimation of gradient damage parameters from localization phenomena in quasi-brittle materials',Jnt. J Mech. Cohesive Frict. Mats. 4 (1999) 1-16.
[8] Le Bellego, C., Dube, J.F., Pijaudier-Cabot, G. and Gerard, B., 'Calibration of non local damage from size effect tests',
EuropeanJ ofMech. 22 (2003) 33-46.
[9] Hild, F., Berthaud, Y. and Roux, S., 'Measurement of displacement field using a correlation method in white light' OASIS 1999 - 1er Congres europeen de !'Organisation pour
I' Application des Sciences de I 'Ingenieur au Sport, Palaiseau, France (1999).
[10] Geers, M.G.D., de Borst, R., Brekelmans, W.A.M. and Peerlings, R.H.J., 'On the use of local strain fields for the determination of the intrinsic length scale' Journal de
Physique IV8 (1998) 167-174.
[ 11] Otsuka, K., 'Detection of fracture process zone in concrete by means of x-ray with contrast medium' Fracture mechanics of concrete structures, Proc. FRAMCOS 1, Z .. P. Bazant editor, Elsevier applied science (1992) 485-490.
[12] Berthaud, Y., 'Damage measurements in concrete via an ultrasonic technique. Part I Experiments', Cem. Concr. Res. 21 (1991) 73-82.
[13] Selleck, S.F., Landis, E.N., Peterson, M.L., Shah, S.P. and Achenbach, J.D., 'Ultrasonic investigation of concrete with distributed damage', ACI Materials Journal95 (1998), 27-36. [14] Maji, A.K. and Shah, S.P., 'Process zone and acoustic emission
in concrete', Experimental mechanics 28 (1988) 27-33. [15] Berthelot, J.M. and Robert, J.L., 'Modelling concrete damage by
acoustic emission', Journal of Acoustic Emission 7 (1987) 43-60. [16] Mihashi, H., Nomura, N. and Niiseki, S., 'Influence of
Aggregate size on fracture process zone of concrete detected with three dimensional acoustic emission technique', Cem.
Concr. Res. 21 (1991) 737-744.
[17] Otsuka, K., Date, H. and Kurita, T., 'Fracture process zone in concrete tension specimens by X-ray and AE techniques'.
Fracture Mechanics of Concrete Structures; Proceedings of FRAMCOS-3 (1998) 3-16.
[18) Haidar, K., 'Damage modelling of concrete structures -Numerical approaches and microstructure effects on the rupture properties', Ph.D thesis, Ecole Centrale de Nantes and Universite de Nantes, France (2002) [in French].
[19) Sussman, V., 'Lightweight plastic-aggregate concrete', Journal American. Concr. Inst. 72 (1975) 321-323.
[20) Yarnura, K. and Yamauchi, M., 'Use of polystyrene pieces for aggregate of concrete', Proc. Annual Conf. of Chugoku-Shikoku branch of JSCE (1982) 346-347 [in Japanese]. [21] Perry, S.H., Biscoff, P.H. and Yamura, K., 'Mix details
behaviour of polystyrene aggregate concrete', Magazine of Concrete Research 43 (1991) 71-76.
[22] Kendall, J., Howard, A.J. and Birchall, J.D., 'The relation between porosity, microstructure and strength, and the
[23)
[24)
[25]
[261 [27)
approach to advanced cement-based materials', Phi!. Trans. R. Soc., London, A 310 (1983) 139-153.
Zimmerman, W., 'Elastic moduli of solid containing spherical inclusions', Mechanics of Materials 12 (1991) 17-24.
RILEM Draft Recommendations, 'Size effect method for determining fracture energy and process zone size of concrete', Mater. Struct. 23 (1990) 461-465.
Tada, H., Paris, P.C. and Irwin, G.R., 'The stress analysis of cracks handbook', 2"d Edition (Paris production, St. Louis, 1985). Pijaudier-Cabot, G. and Bal.ant, Z.P., 'Non local damage theory' ,.f. ofEngrg. Mech. ASCE 113 (1987) 1512-1533. Mazars, J., 'Application de la mecanique de l'endommagement au comportement non lineaire et