STRATOSPHERIC PROCESSES
AND THEIR ROLE IN CLIMATE
SPARC
A project of the WMO/ICSU/IOC World Climate Research Programme
Assessment of Stratospheric
Aerosol Properties
(ASAP)
Prepared under the auspices of the SPARC Scientific Steering Group Edited by L. Thomason and Th. Peter
WCRP-124 WMO/TD- No. 1295 SPARC Report No. 4
iii
Assessment of Stratospheric Aerosol Properties
(ASAP)
Table of Contents
Table of Contents
iii
Foreword vii
Disclaimer ix
Executive Summary
xi
Key Findings xi
Recommendations xii
Important Findings Per Chapter xiii
Chapter 1: Stratospheric Aerosol Processes xiii
Chapter 2: Precursor Gas Measurements xiv
Chapter 3: Instruments xv
Chapter 4: Stratospheric Aerosol Record and Climatology xvi
Chapter 5: Stratospheric Aerosol Trends xvi
Chapter 6: Modeling of Stratospheric Aerosols xviii
ASAP Data Archive
xxi
List of Reviewers
xxiii
Chapter 1
-Stratospheric Aerosol Processes
1
1.1 The Importance of Stratospheric Aerosol 3
1.2 The Life Cycle of Stratospheric Aerosol 4
1.3 Sources of Sulfur Gases and Aerosol to the Stratosphere 5 1.4 Stratospheric Aerosol Microphysics and the Particle Size Distribution 6
1.4.1 Global Aerosol 6
1.4.2 Polar Aerosol 12
1.4.3 Non-Aqueous Stratospheric Particles 13
1.5 Volcanic Perturbations to Stratospheric Aerosol 14
1.6 Aerosol in the Tropopause Region 16
1.6.1 Aerosol precursors and nucleation processes 16
1.6.2 Aerosol distribution and composition 18
1.7 Polar Stratospheric Clouds and Sub-visible Cirrus Clouds 20
1.7.1 Polar stratospheric clouds 21
1.7.2 Subvisible Cirrus Clouds 22
Chapter 2
- Precursor Gas Measurements
29
2.1 Introduction 31
2.2 Dynamics and Atmospheric Transport 31
2.3 Sulfur Chemistry 34
2.4 Observations 36
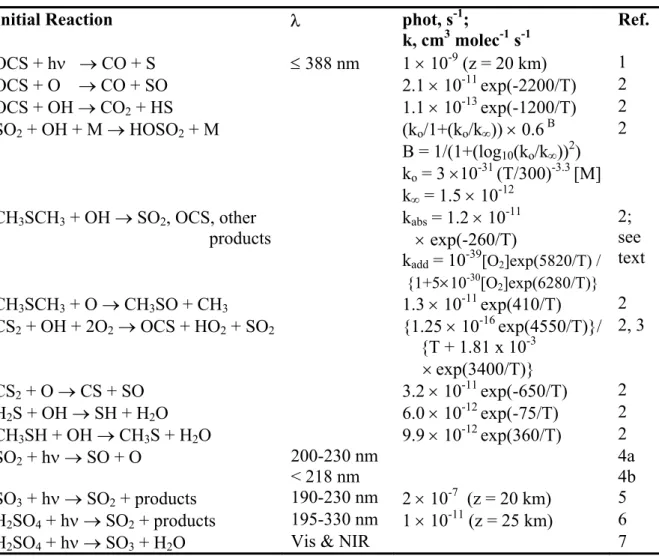
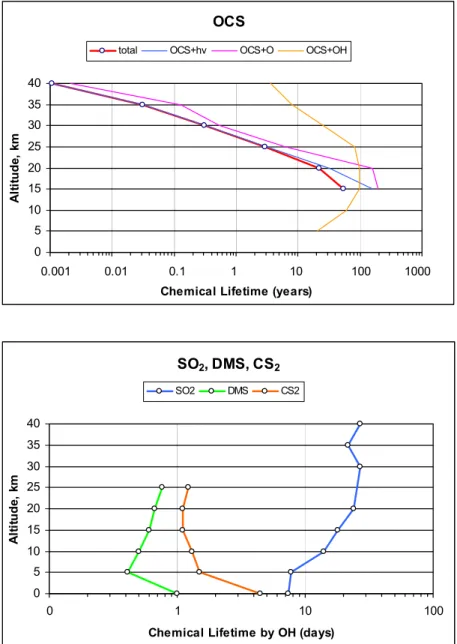
2.4.1 Carbonyl sulfide (OCS) 36
2.4.2 Sulfur Dioxide (SO2) 52
2.4.3 Dimethyl sulfide (CH3SCH3) 60
2.4.4 Other precursor gases 64
2.5 Fluxes 65
2.5.1 Carbonyl Sulfide Fluxes 66
2.5.2 Sulfur Dioxide Fluxes 67
2.5.3 Dimethyl Sulfide Fluxes 69
2.5.4 Hydrogen Sulfide Fluxes 70
2.5.5 Methyl Mercaptan Fluxes 70
2.5.6 Carbon Disulfide Fluxes 71
2.5.7 Meteors, cosmic radiation, and rocket exhaust 71
2.5.8 Isotopic studies 74
2.6 Summary and open questions 75
2.7 Acknowledgements 76
Chapter 3
- Instruments
77
3.1 Introduction 79
3.2 Global Long-Term Measurements 79
3.2.1 SAM II, SAGE I, and SAGE II: The Occultation Technique 80
3.2.2 HALOE 84
3.2.3 POAM II and POAM III 86
3.3 Global Short-Term Measurements 89
3.3.1 CLAES 89
3.3.2 ORA 91
3.4 Localized Long-Term Measurements 92
3.4.1 Balloon Borne Optical Particle Counter 92
3.4.2 Lidar Systems 94
3.5 Localized Short-Term Measurements 100
3.5.1 The Aircraft-Borne LaRC Aerosol Lidar 100
3.5.2 The Airborne DLR OLEX Lidar 102
3.5.3 Airborne Particle Counters 102
3.5.4 Balloon-borne Backscattersonde 105
Chapter 4
- Stratospheric Aerosol Record and Climatology
107
4.1 Introduction 109
4.2 Primary Measured Aerosol Properties 109
4.2.1 Global Long-term Measurements of Extinction and Optical Depth 110
4.2.2 Global Short-term Measurements 120
4.2.3 Localized Long-term Measurements 123
v
4.3.1 Retrieved Products from Global Long-term Measurements 135 4.3.2 Retrieved Products from Localized Long-term Measurements 152 4.4 Relevant Cross-Comparisons Of Averages Or For Coincidences 155
4.4.1 SAGE/HALOE/OPC Comparisons 155
4.4.2 SAGE/POAM Comparisons 168
4.4.3 SAGE/ORA Comparison 169
4.4.4 Comparisons of SAGE Extinctions with Lidar Backscatter 170
4.5 Conclusions 175
Chapter 5
- Stratospheric Aerosol Trends
177
5.1 Introduction 179
5.2 Fundamental measurements 184
5.2.1 In situ measurements 184
5.2.2 Remote lidar measurements 184
5.2.3 Remote satellite measurements 186
5.3 Measurements 187
5.4 Investigation of trends in the long term aerosol measurement records 194 5.4.1 Comparison of stratospheric aerosol during non volcanic periods 195 5.4.2 Removing the volcanic signal from the long term measurement
re-cords
197
5.5 Discussion 207
5.5.1 Aerosol surface area: Differences between satellite and in situ meas-urements
210 5.5.2 Estimates of global stratospheric aerosol burden during background
conditions 213
5.6 Summary and Conclusions 215
Chapter 6
- Modeling of Stratospheric Aerosols
219
6.1 Summary 221
6.2 Scope and Rationale 222
6.3 Model Descriptions 223
6.4 Model Illustrations of Aerosol Microphysics 226
6.5 Model Simulations of Nonvolcanic Conditions 232
6.5.1 Description of Calculations 232
6.5.2 Comparisons to Precursor Gas Measurements 234
6.5.3 Calculated Aerosol Budgets and Burdens 236
6.5.4 Comparisons to Satellite Extinction Measurements 239 6.5.5 Comparisons to Derived Satellite Products 245
6.6 Sensitivity Studies and Analyses 250
6.6.1 Sensitivity to model formulation 250
6.6.2 Primary aerosol sensitivity 253
6.6.3 Tropopause SO2 sensitivity 254
6.6.4 OCS sensitivity 256
6.7 Model Simulations of Volcanic Conditions 256
6.7.1 Description of Calculations 256
6.7.2 Comparisons with Lidar Backscatter Measurements 257
6.7.3 Comparisons with SAGE II Observations 259
6.7.5 Aerosol Decay Rates 261
6.8 Discussion 266
6.8.1 Uncertainties 266
6.8.2 Future Trends of Stratospheric Sulfate Aerosols 268
6.8.3 Conclusions 269
References 273
Appendices
I WCRP Reports 305
II Acronyms and Abbreviations 315 III Authors, Co-authors, and Contributors 319
vii
Foreword
Assessments of stratospheric ozone have been conducted for nearly two decades and have evolved from describing ozone morphology to estimating ozone trends, and then to attribu-tion of those trends. Stratospheric aerosol has only been integrated in assessments in the con-text of their effects on ozone chemistry and has not been critically evaluated itself. As a re-sult, the Assessment of Stratospheric Aerosol Properties (ASAP) has been carried out by the WCRP project on Stratospheric Process and their Role in Climate (SPARC). The objective of this report is to present a systematic analysis of the state of knowledge of stratospheric aerosols including their precursors. It includes an examination of precursor concentrations and trends, measurements of stratospheric aerosol properties, trends in those properties, and modeling of aerosol formation, transport, and distribution in both background and volcanic conditions. The scope of this report is extensive; however, some aspects of stratospheric aerosol science have been deliberately excluded. For instance, we have not attempted to in-clude an examination of polar stratospheric clouds (PSCs) or other clouds (such as cirrus clouds) occurring at or above the tropopause except in as much as they influence aerosol ob-servations. Polar stratospheric clouds are the subject of a separate SPARC activity. We have produced a gap-free aerosol data base for use beyond this report. This required some new analysis that has not previously appeared in the technical literature. Similarly, the trend analysis required the development of a new analysis technique that is the subject of an article published in the Journal of Geophysical Research. New work is clearly identified in the pre-sent report.
ASAP began with a general kick-off meeting in November 2001 at CNES in Paris, France. There were also three chapter lead meetings in Nice, France (April 2003), in Frankfurt, Ger-many (July 2003) and in Lexington, Massachusetts, USA (January 2004). The final report is the result of concerted effort by scientists world-wide who continue to work toward under-standing the measurements and processes controlling stratospheric aerosol. Their work was supported by their host institutions and funding agencies that include the WCRP and the SPARC Office (in Paris and Toronto), as well as Atmospheric and Environmental Research, Inc., NASA, the Universities of Frankfurt and Wyoming, and ETH Zurich. An initial over-view of ASAP appeared in the SPARC Newsletter No. 23 in July 2004.
We would like to thank and acknowledge our debt to the authors, contributors and reviewers who have helped in the preparation of this assessment. It seems clear that stratospheric aero-sol science remains a fruitful area of research and that a sustained effort to draw together this community is necessary. We greatly appreciate the support and patience of the SPARC Sci-ence Steering Group as well as the SPARC Chairpersons during this effort Marie-Lise Chanin, Marvin Geller, Alan O’Neil, and A.R. Ravishankara. We are similarly indebted to the Toronto and Paris SPARC Offices including Norm McFarlane, Diane Pendlebury, Victo-ria De Luca, and Catherine Michaut. Thank you all!
Larry W. Thomason Thomas Peter
NASA Langley Research Center
USA ETH Zurich Switzerland
ix
Disclaimer
What ASAP is about:
This report is composed of six chapters:
Chapter 1: Stratospheric Aerosol Processes Chapter 2: Precursors Gas Measurements Chapter 3: Instruments
Chapter 4: Stratospheric Aerosol Record and Climatology Chapter 5: Stratospheric Aerosol Trends
Chapter 6: Modeling of Stratospheric Aerosols
These chapters describe the stratospheric aerosol’s morphology during background (i.e., vol-canically quiescent) and volvol-canically perturbed periods. The precursor gases and microphysi-cal, chemimicrophysi-cal, and radiative processes that control the structure of the aerosol layer are dis-cussed in detail. Changes in aerosol over the period of the modern observational record, as determined by remote and in situ instruments, are assessed for trends under background con-ditions.
What ASAP is not about:
Although connections are made in Chapters 1 and 6 to clouds in the tropopause region (such as cirrus or cumulonimbus clouds) or in the wintertime polar regions (polar stratospheric clouds, PSCs) this report does not treat the microphysical, chemical or radiative properties of these clouds. Work is currently underway to complete a separate report on PSCs under the auspices of SPARC.
Executive Summary
xi
Executive Summary
Key Findings
• The vast bulk of existing aerosol data does not comprise a complete measurement set
and, as a result, many parameters required for scientific or intercomparison pur-poses are derived indirectly from the base measurements. This is true for space-based
measurements where only bulk extinction is measured but also true in degree for most ground-based and in situ systems. Unlike gas species, aerosol cannot be characterized by a single quantity but has a size distribution and variable composition. The fact that each system measures a different set of parameters greatly complicates almost every stage of measurement comparisons, accentuating the need for aerosol models.
• Disagreements between the various data sets and models indicate that significant
questions remain regarding the ability to characterize stratospheric aerosol during volcanically quiescent periods, particularly in the lower stratosphere. Space-based
and in situ measurements of aerosol parameters tend to be consistent following significant volcanic events like El Chichón and Pinatubo. However, during periods of very low aero-sol loading, this consistency breaks down and significant differences exist between sys-tems for key parameters including aerosol surface area density and extinction. Compari-sons of models and satellite observations of aerosol extinction are generally fairly good at visible wavelengths above 20-25 km altitude region under non-volcanic conditions, but are less satisfactory for infrared wavelengths. Although integrated aerosol quantities such as surface area density and effective radius can be calculated without approximation from a known size distribution, the satellite and in situ observational bases for size distributions are controlled by a priori assumptions regarding the distribution itself or by having coarse size resolution, respectively. During volcanically quiescent periods, models and observa-tions disagree significantly mainly due to the fraction of the surface area density produced by models residing in particles too small to be measured, especially near nucleation re-gions. While there are some model short-comings relative to observations, particularly in the lower stratosphere, it seems likely that space-based data sets underestimate, perhaps significantly, aerosol surface area density in the lower stratosphere.
• The analysis of non-volcanic stratospheric aerosol, although hampered by very
lim-ited periods without volcanic influence since systematic measurements began, indi-cates no long term trend. Since the beginning of systematic stratospheric aerosol
meas-urements in the early 1970s there have been three periods with little or no volcanic per-turbation, although only the period from 1999 onwards can be confidently identified as free of volcanic aerosols. The other periods (late 1970s and late 1980s) are difficult to evaluate, given their brevity and the complex variability observed. In particular the pe-riod in the late 1980s seems likely to have not reached a stable non-volcanic level. Trends derived from six long term data sets for the late 1970s to the current period are not significantly different from zero.
• The dominant stratospheric aerosol precursor gases are OCS and SO2 and, through
SO2, human-related activities may influence the observed background stratospheric
aerosol. There is general agreement between measured and modeled OCS in the tropical
Executive Summary
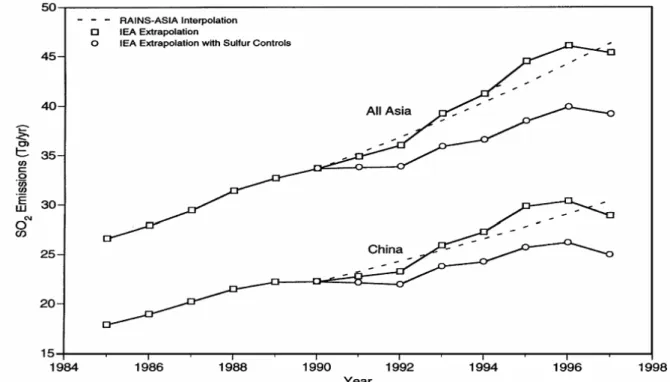
tropospheric SO2 in the stratospheric aerosol budget – while significant – remains a mat-ter of some guesswork. In addition, it is not well understood whether decreasing global human-derived SO2 emissions, or increasing emissions in low latitude developing coun-tries, such as China, dominate the human component of SO2 transport across the tropical tropopause.
Recommendations
• The importance of stratospheric aerosol in climate and atmospheric chemistry
strongly supports a commitment to continuing both space-based and in situ observa-tions of aerosols into the foreseeable future. Both types of measurements are necessary
because neither approach seems likely to independently produce a robust depiction of global, stratospheric aerosol properties.
• Observations of SO2 in the upper troposphere and lower stratosphere and of H2SO4
and SO2 in the middle and upper stratosphere would be extremely valuable to
im-prove our modeling and predictive capabilities of stratospheric aerosol. Currently,
there is a general scarcity of measurements of key sulfur-bearing gases during their trans-port from the upper troposphere into the upper stratosphere.
• A more complete understanding of the detailed structure of the underlying aerosol
size distribution is required to facilitate improvement in the closure between meas-urement data sets and confidence in derived properties like surface area density.
This is becoming increasingly important as measurement systems change and robust con-version between data sets is required to maintain data sets amenable to trend analysis. It is also important to improve aerosol size distribution and composition knowledge in the vicinity of the tropical tropopause where such information is crucial input to microphysi-cal models of stratospheric aerosol. In addition, aerosols in the upper troposphere are not composed purely of H2SO4/H2O but include organics (up to 50 % by mass), mineral dust, soot, and other compounds. Organics are also found in stratospheric aerosols in small quantities. Since the role of non-sulfate aerosols in serving as sites for chemical reactions and as condensation nuclei with concomitant effects on the stratospheric aerosol is not well known, measurements focused on these aerosols are desirable.
• The upper troposphere and lower stratosphere, particularly in the tropics, is a
cru-cial region for understanding stratospheric aerosol and warrants detailed scientific investigation. Sensitivity studies in this report show that the lower stratospheric aerosol
layer is strongly dependent on input from the tropical upper troposphere.
• Future modeling studies should strive to include important but as yet missing or
poorly treated elements, such as upper tropospheric and meteoritic particles, and various relevant chemical and dynamical processes. The stratospheric aerosol could
be quite sensitive to aerosol input through the tropical tropopause, as suggested in the present report. Also, meteoritic material descending into the stratosphere from the meso-sphere may be important to the morphology of stratospheric aerosols, particularly in polar air and perhaps globally. Chemically the photolysis of sulfuric acid affecting the upper edge of the aerosol layer especially in the polar regions should be included in the models.
Executive Summary
xiii
In addition, a more robust 3-D representation of transport and cloud processes is required to reproduce aerosol observations in the troposphere-stratosphere transition region, as well as to face the challenge of reproducing the seasonal variability of aerosols.
Important Findings per Chapter
Chapter 1: Stratospheric Aerosol Processes
• The past two decades with enhanced observational capabilities have led to a
gener-ally high level of understanding of microscale and synoptic scale aerosol processes, which determine the lifecycle of the stratospheric aerosol. Most microphysical
proc-esses, such as nucleation, coagulation, condensational growth and evaporation, and sedi-mentation, are thought to be well understood. Of these processes, nucleation still is least understood, and this limits our description of non-volcanic aerosol formation through bi-nary homogeneous nucleation of sulfuric acid and water in rising air masses close to the tropical tropopause. However, these uncertainties are unlikely to be of importance for global stratospheric aerosol. On the synoptic scale, transport and transformation of aero-sol within the Brewer-Dobson circulation, and removal of aeroaero-sol in air traversing the ex-tra-tropical tropopause are thought to be well understood. A fundamental weakness is the poor understanding of mesoscale processes, such as deep convection, which transport pre-cursor gas and aerosol into the stratosphere through the tropical tropopause.
• Aerosol in the tropical regions is rapidly transported zonally with mean
strato-spheric winds, while transport is restricted meridionally by the transport barrier of the tropical pipe in the 15-30º latitude range. This reduced transport is most effective
at altitudes between about 21 and 30 km; poleward transport at lower altitudes is more rapid. After a volcanic eruption the transport barrier of the “leaky tropical pipe” leads to build-up of a tropical reservoir of aerosol mass, an observation which has lead to a gen-eral improvement of our understanding of stratospheric dynamics.
• Aerosol in air masses transported into the mid and high latitudes continues to evolve
through microphysical processes. These processes include evaporation at the upper
edge of the aerosol layer and nucleation/re-condensation during descent, as well as con-densation and coagulation. Air which descends diabatically to the lowermost strato-sphere can be removed from the stratostrato-sphere through quasi-isentropic transport of the air in tropopause folds. This is the dominant removal mechanism for stratospheric aerosol. Additional removal occurs over the poles when the sulfuric acid particles serve as sites for polar stratospheric cloud (PSC) particle formation.
• Sedimentation is an important aspect of the aerosol lifecycle. Throughout the lifetime of the aerosol, gravitational settling adds substantially to the altitude distribution and re-moval of the particles despite their small size. Due to the long lifetime of the particles, their sedimentation velocities (~ 100 m/month for particles with 0.1 µm radius and strongly growing for larger ones) cannot be neglected.
• The contribution of primary tropospheric particles and material of extraterrestrial
me-Executive Summary
teoritic material is present in a significant fraction of stratospheric particles. Observations at and just above the tropopause also show the presence of a peak in the aerosol mass dis-tribution that may indicate the presence of tropospheric particles in the lower strato-sphere. The effect of insoluble extraterrestrial and tropospheric particles on hydrate and ice formation needs to be determined.
Chapter 2: Precursor Gas Measurements
• SO2 and OCS are the dominant source gases of background stratospheric sulfate
aerosol based on lifetime, abundance, and flux. Overall, the contribution of OCS is
well known, however, the contribution of SO2 remains uncertain. By emission rate into the troposphere, the key gases in the sulfur budget are, in order, SO2, OCS, CS2, DMS, H2S, CH3SH. However, due to differences in their lifetime, their rank by flux into the tropical tropopause layer (TTL) is OCS, SO2, CS2 and DMS.
• The TTL is the main entry region of the tropospheric source gases into the
strato-sphere. The estimate for the sulfur mass flux reaching the TTL is 1.5 × 10¹¹ kg/s. In
contrast, tropopause folds and quasi-adiabatic transport between the upper troposphere and the subtropical stratosphere associated with monsoon circulations, synoptic systems and planetary wave breaking do not affect the stratospheric composition above 100 hPa. • The flux of sulfur through the TTL is not well known due to uncertainty in the
transport from the surface to the TTL. In addition, the changing pattern of
anthropo-genic SO2 emissions (decreasing in the US and Europe, increasing in many parts of Asia) makes the trend in TTL sulfur uncertain. Aircraft emissions do not play a significant role. Emissions from major volcanic eruptions can effect the SO2 concentrations for up to a few months.
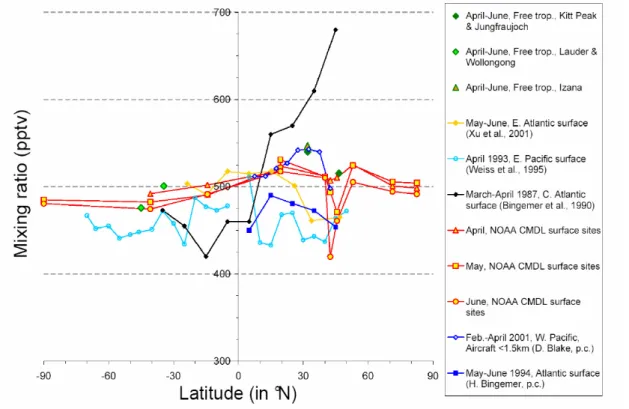
• There is now a consistent picture of the seasonal and latitudinal variability of OCS
in surface air and its relation to major terrestrial and marine sources and sinks.
Measurements over land show minimum OCS mixing ratios during the summer due to the uptake by land vegetation. The data suggest a strong, land-based, seasonally-varying up-take of OCS, the effect of which propagates to high altitudes and away from mid-latitudes with some time delay. The measured seasonal variabilities are between 3 and 30%, de-pending on the location, with higher variability in the northern hemisphere.
• The pre-industrial OCS concentrations were about 330-370 pptv in the 17th century,
roughly 30-40% lower than today’s values. The atmospheric OCS total column and
surface air mixing ratios have been decreasing by 0.5-1 % / yr over recent decades. • Meteoritic material contributes a significant fraction to the total stratospheric
aero-sol mass. Recent investigations suggest that the flux of meteoritic material amounts to
between 44 and 260 tons/day with an uncertainty as large as a factor of six. These mass fluxes compare to about 820 tons/day for the overall net mass flux from the troposphere to the stratosphere of all material that is eventually transformed into aerosols during vol-canically quiescent times.
Executive Summary
xv
• Meteors, cosmic radiation, and rocket exhaust make a small contribution to the
sul-fur budget in the lower stratosphere. In terms of the element sulsul-fur, the extraterrestrial
input represents 0.2 to 2.9% of the terrestrial input to the lower stratosphere. This sulfur flux is insignificant in the lower stratosphere; however, it may dominate in the upper stratosphere, above the stratospheric aerosol layer where most of the sulfur of terrestrial origin resides.
• The consistency between the mass burden of stratospheric sulfate aerosol, its
life-time, transport and oxidation of precursors into the aerosol reservoir, and removal of aerosol needs to be better established. At present, the best estimate is that only 9 %
of the OCS transported into the stratosphere is photolyzed, and that the remaining source of sulfur, of similar magnitude, required to explain the aerosol layer stems from SO2 transported by deep convection into the stratosphere. These numbers remain uncertain, in particular the mesoscale transport path of SO2 across the tropopause.
Chapter 3: Instruments
• Various techniques have been established for investigations of the stratospheric
aerosol layer. These include solar occultation, limb emission, lidar, in situ optical
parti-cle counters, each having its own strengths and weaknesses, so that only a mix of these techniques will ensure the future monitoring and detection of global stratospheric change. • Information on stratospheric aerosols is derived from a number of remote and in
situ instruments, some with global coverage (satellite instruments) and some which make only localized observations (lidars, particle counters). Long term data records from the SAGE satellite series, four long term lidar records, and balloon-borne in situ measurements at Laramie provide for the characterization of the stratospheric aerosol layer over decadal time scales. The instruments may be categorized as
− global long term measurements (e.g. SAGE, HALOE, POAM); − global short term measurements (e.g. CLAES, ORA);
− local long term measurements (e.g. lidars, balloon-borne particle counters); − local short term measurements (e.g. airborne lidars and particle counters). • Various primary aerosol properties are now available with very low uncertainties.
These primary aerosol properties are
− aerosol extinction from the solar occultation satellite instruments; − backscatter coefficients from the lidar systems;
− cumulative size distributions from the particle counters.
• Aerosol information obtained from the various instruments may differ significantly
due to the differences in the applied measurement techniques, in particular when secondary (derived) aerosol properties are concerned. For example, surface area
den-sities derived from remote and in situ measurements may differ considerably, though both pieces of information need not be contradictory. Furthermore, occultation measurements give averaged information over a relatively large region while in situ instruments yield highly localized information.
Executive Summary
Chapter 4: Stratospheric Aerosol Record and Climatology
• Time series of aerosol extinction coefficients have been archived from various
in-struments, in particular cloud-free SAM, SAGE, HALOE and POAM data (when available) for 1971-2002. Both tropospheric and polar stratospheric clouds have been
removed. These data sets are available online.
• Comparisons between SAGE/HALOE/OPC, SAGE/POAM, SAGE/ORA,
SAGE/lidar generally show good agreement. To carry out such comparisons, modeling
has been necessary since the primary products differ for the various instruments, so that direct comparisons are not generally possible. For example, comparison of SAGE extinc-tion coefficients at visible and near infrared wavelengths and HALOE extincextinc-tions in the infrared requires assumptions on size distributions and particle composition. Compari-sons between SAGE and the number densities obtained with the optical particle counters require an evaluation of the extinctions based on assumptions of the aerosol properties, especially index of refraction.
• Derived products from SAGE, HALOE, OPC and Lidar, such as the effective
ra-dius, surface area density, volume density, and size distributions agree quite well during periods of heavy aerosol loading, but significant differences arise during “background” aerosol periods. In general these comparisons rely on a small number of
coincident measurements. Discrepancies between surface area densities made by the various measuring techniques are a consequence of various assumptions made in the comparisons, such as filling of particle size gaps or indices of refraction, but may also re-sult from differences in the volume of air sampled.
• A SAGE data set without gaps due to optically dense conditions or due to instrument
failure or absence has been generated, which will be most beneficial for future mod-eling work. Gaps within the SAGE data exist during the period between SAGE and
SAGE II and shortly after the Pinatubo eruption (due to “saturation” effects). These have been filled by using data from other instruments, including SAM II and lidar systems, and a nearly continuous global dataset has been generated.
• The presentation of the SAGE II extinctions in an equivalent latitude/potential
tem-perature coordinate system reduces the dynamically induced short term atmos-pheric variability. This provides a more physically based way of presenting the data,
re-sulting in a smoother aerosol distribution.
Chapter 5: Stratospheric Aerosol Trends
• Based on two different analyses of six long term data sets we conclude that
back-ground (non-volcanic) stratospheric aerosol has not significantly changed over the past thirty years. The analyses are based on: four lidar records of integrated backscatter
(São José dos Campos, Brazil, 23°S; Mauna Loa, Hawaii, USA, 20°N; Hampton, Virginia, USA,
Executive Summary
xvii
>0.25 µm (Laramie, Wyoming, USA, 41°N), and on SAGE II altitude latitude dependent optical depths at 1020 nm.
• The stratospheric aerosol measurements which can be reliably used to assess trends
in the non-volcanic component of stratospheric aerosol began in the early 1970s.
Earlier assessments of trends in non-volcanic stratospheric aerosol included Junge's initial stratospheric aerosol measurements, 1959 - 1960. Based on the stability of measurements following the decay of Pinatubo volcanic aerosol, we conclude that there is not significant confidence in the size range or number concentration of Junge's initial in situ measure-ments to reliably compare them with the in situ record begun in 1971 and continued to the present.
• The period following the decay of aerosol from the eruption of Pinatubo provides
our best opportunity to observe a stratosphere unperturbed by volcanic activity since long-term stratospheric aerosol measurements began. There have been fewer
small volcanic eruptions following Pinatubo than during the two previous volcanically quiescent periods. The pre-Pinatubo period was elevated compared to the present and pre-El Chichón periods. Stratospheric aerosol loading is not expected to fall significantly below current levels, although longer-term variations cannot be ruled out.
• Volcanic aerosol from Pinatubo disappeared from the long-term measurement
re-cords between 4.5 and 7.5 years following the eruption, dependent on latitude and measurement platform. The earliest returns to background aerosol levels were observed
by lidar at Mauna Loa (19°N), while volcanic aerosol may still be present in late 1998 in SAGE II extinction measurements between 18 and 23 km.
• A comparison of measurements during the three volcanically quiescent periods in
the long term records is controlled by measurements prior to the eruption of El Chichón and after the eruption of Pinatubo, and indicates no long term trend. Only
the one in situ and four lidar records capture the three volcanically quiescent periods, pre El Chichón, pre Pinatubo, and post Pinatubo. Investigations of these records suggest that the first two periods may not have reached background, particularly prior to Pinatubo. Problems with a simple linear regression of the data arise because of the high degree of autocorrelation, and problems with time series regression occur because of irregular time intervals and nonlinearities. The subset of measurements which suggest changes in back-ground aerosol without accounting for autocorrelation, do not suggest any trend when autocorrelation is included. Although estimates of growth/decay rates change little when incorporating autocorrelations, standard errors typically about triple. Four of the six data sets analyzed (2 in situ aerosol sizes and 4 lidar records) suggest no long term trend in background aerosol. Mauna Loa and Laramie 0.25 µm measurements indicate a trend on the order of -1.0 % yr-1, but with uncertainties which include zero.
• An empirical model to remove the volcanic signal from the local thirty-year in situ
and remote stratospheric aerosol records, and the global twenty-year satellite record also indicates no trend in background aerosol. The model was applied to the 4 lidar
data sets, 2 in situ data sets (two aerosol sizes) and 33 SAGE II data sets (optical depths at 1.02 µm at three altitude and eleven latitude intervals). These analyses (excepting SAGE II) allowed for first order autocorrelation and used a one-dimensional spatial rep-resentation to account for the temporally disparate sampling intervals. For 31 of the 33
Executive Summary
SAGE II data sets, 3 of 4 lidar records, and the in situ measurements at 0.15 µm, the analyses suggest no long term trend in stratospheric aerosol. For one lidar site (Hampton) and the 0.25 µm in situ measurements the results suggest a negative trend, on the order of -2 % yr-1. Both these estimates suffer from difficulties introduced by the eruption of Mt. St. Helens, and a comparison of the model with the data suggests problems in represent-ing properly the measurements prior to El Chichón. In contrast to these two estimates of a negative trend, two SAGE II data sets (30-35 km, 30° and 40°N) suggest a positive trend of the same magnitude, 2 % yr-1.
• The statistical analyses were completed on altitude/latitude integrals of the
meas-urements, precluding establishing, or ruling out, long term changes in microphysical properties of background stratospheric aerosol. The focus on integral properties, an
inherent limitation of this investigation, is dictated by the fact that all but the in situ in-struments make measurements on ensembles of particles and thus inherently integrate over the size distribution. Thus the in situ record was also integrated to provide a rela-tively homogenous data set for comparison with the other long term records. Some in-formation concerning the long term tendency of aerosol size distributions is available by comparing altitude integrals of the two sizes measured , r > 0.15 and 0.25 µm. Some dif-ferences were observed, but were not statistically significant.
Chapter 6: Modeling of Stratospheric Aerosols
• Models provide a way to synthesize our knowledge of stratospheric aerosol processes
and quantitatively test our understanding against observations. However, model
un-certainties, especially transport rates, limit our confidence.
• Sedimentation is a crucial process determining the vertical distribution of aerosol
mass and sulfur in the stratosphere. Sedimentation is a strong function of altitude as
well as particle size, and reduces sulfur in the upper model stratospheres by over 75 %. • Nucleation of new particles is important near the tropopause, particularly in the
tropics, and at polar latitudes in the middle stratosphere in winter. Particle size is
determined by nucleation, and subsequently by coagulation, condensation and evapora-tion, as well as transport and mixing.
• OCS, SO2, and particles transported across the tropopause are the primary
precur-sors to stratospheric aerosol. Analysis of sulfur budgets in the models shows that
trans-port of SO2 and particles, for which SO2 is the precursor, across the tropical tropopause are potentially large contributors to the stratospheric aerosol burden. Large uncertainties remain in our ability to quantify the relative contributions, but the models show OCS to be the main contributor above 25 km and SO2 and particles to play a larger role below. • OCS mixing ratios in the tropics are well represented by the models. However, the
models do not all match observations of OCS in mid and high latitudes, reflecting the variability of transport between models. Since this gas represents the main sulfur source in the mid-stratosphere, confidence in the rate of OCS oxidation and aerosol formation in the tropics is gained.
Executive Summary
xix
• SO2 mixing ratios in the tropics show large variability between models. Model dif-ferences are probably due to the short lifetime of SO2 in the tropics along with differences in the OH concentrations and transport differences.
• More SO2 measurements would be valuable. Better knowledge of SO2 concentrations in the upper troposphere would be required to obtain a correct description of the transport of sulfur into the stratosphere. Knowing SO2 in the lower-mid stratosphere helps verify the OCS chemical destruction rate and the SO2 to H2SO4 conversion rate, along with transport rates. Above 35 km, observations show an increase in SO2 which can only be reproduced by models that include a photolytic conversion of gaseous H2SO4 into SO2. • Comparisons between models and satellite observations of aerosol extinction are
generally fairly good at visible wavelengths but are less satisfactory for infrared wavelengths. Aerosol extinction measurements from SAGE II at 525 and 1020 nm are
matched by models above 20-25 km altitude under non-volcanic conditions. Tropical ob-servations show a sharp vertical gradient in extinction at 17-20 km which varies with sea-son and is not reproduced by the models. Models are also less successful at reproducing extinction observations from the HALOE instrument at 3.46 and 5.26 µm.
• Models predict aerosol size distributions which can be approximated by a lognormal
function except near regions of nucleation or evaporation. Integrated aerosol
quanti-ties such as surface area density and effective radius can in principle be calculated with-out approximation from model size distributions, whereas satellite observations and in situ measurements by optical particle counters used to derive these quantities are either controlled by a priori assumptions regarding the size distribution or have coarse resolu-tion at the small size bins. Comparisons of these quantities during volcanically quiescent periods are problematic because much of the aerosol density may reside in particles too small to be observed, especially near nucleation regions.
• Simulations of the Mt. Pinatubo period are generally good but dependent on the
as-sumed initial vertical distribution of volcanic sulfur. For instance, model results show
very good agreement with column integrated lidar backscatter at both tropical and mid latitude sites, including the magnitude and timing of the aerosol maximum and the rate of decay. Comparisons with SAGE II extinctions show that models may under- or over pre-dict extinction at different altitudes, depending on the applied model, and the assumed vertical distribution of volcanic sulfur at the beginning of the event.
• The modeled rate of recovery from the Pinatubo eruption depends on the quantity
considered (extinction, number density, surface area density) and the latitude and altitude of interest. Recovery time constants (e-folding times) show decay rates
length-ening with time past the eruption, in agreement with observations. Different models ex-hibit different recovery time constants, but with a scatter not larger than that of the obser-vations.
Executive Summary
xxi
ASAP Data Archive
Data sets that comprise the basis for the data analysis are archived at the SPARC Data Center (http://www.sparc.sunysb.edu/) including altitude/latitude gridded fields of aerosol extinction and derived quantities for the SAGE time series. Data sets used in the trend analysis are ei-ther available at this location, or links provided to the Network for the Detection of Strato-spheric Change (http://www.ndsc.ws/) and other data sources. In addition, links to other sources of aerosol data that appear within this report are included. The SAGE data sets are also available remapped to equivalent latitude and potential temperature.
A final product that is made available is a ‘gap-filled’ data set for the period 1979 through 2004 based on the SAGE record. Gaps exist between the June 1991 eruption of Mount Pi-natubo and the end of 1993 due to instrument saturation and between November 1981 and October 1984, when global space-based aerosol extinction measurements were not available. To fill the missing values, we have used aerosol backscatter profile measurements from sites at Camaguey (Cuba), Mauna Loa, Hawaii (USA), and Hampton, Virginia (USA) and back-scatter sonde measurements from Lauder, New Zealand. This period encompasses the El Chichón eruption and the onset of the Antarctic ozone hole and is, therefore, of particular in-terest. Beginning in April 1982 and through the beginning of SAGE II observations in 1984, we have used a composite of data consisting of SAM II, the NASA Langley 48-inch lidar system, and lidar data from the NASA Langley Airborne Lidar System. Data from this latter data set has only been partially recovered for the 1982 to 1984 period. If more lidar data from past aircraft missions or a revised Solar Mesospheric Explorer (1981-1986) aerosol product become available, additional work on the El Chichón period would be profitable.
List of Reviewers
xxiii
List of Reviewers
The editors express their gratitude to the following colleagues who reviewed one or two of the report chapters or served as overall reviewers for the entire report:
Tim Bates
NOAA/Pacific Marine Environmental Lab Seattle, WA, USA
Chuck Brock
NOAA Aeronomy Laboratory Boulder, CO, USA
David Considine
NASA Langley Research Center Hampton, VA, USA
Derek Cunnold
Georgia Institute of Technology Atlanta, GA, USA
Katja Drdla
NASA Ames Research Center Moffett Field, CA, USA Dave Fahey
NOAA Earth System Research Laboratory Boulder, CO, USA
Hans Graf
University of Cambridge Cambridge, UK
Matt Hitchman
University of Wisconsin Madison, WI, USA Jens Hjorth
The EC Joint Research Centre Ispra (VA), Italy
Ben Liley
Natl.Inst.of Water & Atmos. Res.(NIWA) Lauder, Central Otago, New Zealand Rob MacKenzie
Lancaster University Lancaster, UK
Steve Massie
NCAR/Atmospheric Chemistry Division Boulder, CO, USA
Roland Neuber Alfred-Wegener-Institut Potsdam, Germany Irina Petropavlovskikh NOAA/SRRB Boulder, USA Andreas Petzold
Dt. Zentrum für Luft- und Raumfahrt, DLR, Oberpfaffenhofen, Germany Lamont Poole
NASA Langley Research Center Hampton, VA, USA
Bob Portmann
NOAA Earth System Research Laboratory Boulder, CO, USA
Cora Randall
University of Colorado Boulder, CO, USA Bill Randel
NCAR/Atmospheric Chemistry Division Boulder, CO, USA
Donald Thornton Drexel University Philadelphia, PA, USA Rich Turco
University of California, Los Angeles Los Angeles, CA, USA
Rudy Zander University of Liege Liege, Belgium
CHAPTER 1
Stratospheric Aerosol Processes
Lead Authors:
Kenneth S. Carslaw Bernd Kärcher
Chapter 1: Stratospheric Aerosol Processes
3
1.1 The Importance of Stratospheric Aerosol
Stratospheric aerosol is important for a number of processes that affect the chemical and radiation balance of the atmosphere (McCormick et al., 1995; Solomon, 1999). During periods of high volcanic aerosol load there is evidence for heterogeneous chemistry on the sulfate aerosol reducing ozone (Angell et al., 1985; Hofmann and Solomon, 1989; Jäger and Wege, 1990; Gleason et al., 1993; Deshler et al., 1996), for stratospheric warming (Labitzke and McCormick, 1992; Angell, 1993; Russell et al., 1993), and for tropospheric cooling (Manabe and Wetherald, 1967; Pollack et al., 1976; Dutton and Christy, 1992; Hansen et al., 1992). Stratospheric aerosol plays a role in the budget of several trace gases, in particular NOx. These chemical effects are enhanced when the aerosol surface area is increased after volcanic eruptions: for example, NO2 columns were reduced after both El Chichón and Pinatubo (Johnston and McKenzie, 1989; Johnston et al., 1992) from the hydrolysis of N2O5.(Rowland et al., 1986; Tolbert et al., 1988; Mozurkiewicz and Calvert, 1988). At low aerosol loading NOx increases and induces ozone loss from the nitrogen catalytic cycle (Crutzen, 1970). Fahey et al. (1993) provided direct measurements of the anticorrelation of aerosol surface area and the NOx/NOy ratio. The hydrolysis of N2O5 saturates as aerosol surface area increases above 5-10 µm2 cm-3, thus the role aerosol plays in controlling NO
x is primarily important during periods of low aerosol loading (Prather, 1992). Changes in NOx also affect the abundance of ClOx and HOx, both of which also react with ozone (Wennberg et al., 1994; Solomon et al., 1996). The importance of aerosol in stratospheric chemistry first became apparent with the suggestion of its role in polar ozone loss (Solomon et al., 1986). Long term stratospheric aerosol measurements had their beginnings about fifteen years prior to this realization.
During volcanically quiescent periods, when the stratospheric aerosol is in a "background" state unperturbed by volcanism, radiative effects of the aerosol are negligible. However, following a major eruption the increased aerosol loading can have a transient but significant radiative impact (McCormick et al., 1995). Radiative heating can lead to significant warming of the middle stratosphere (Labitzke and McCormick, 1992). It also increases the albedo of the Earth (Brogniez et al, 1999; Stenchikov et al., 1998), leading to changes in surface temperature, although changes are not evenly distributed (e.g., Hansen et al., 2002).
Volcanic aerosols may also have indirect effects on the troposphere. For example, aerosol transported into the upper troposphere may affect the microphysical structure of deep convective clouds (Minnis et al., 1993).
The distribution of stratospheric aerosol can also be used to understand the circulation of the stratosphere. Examples include the meridional circulation changes associated with the Quasi-Biennial Oscillation (Trepte and Hitchman, 1992) and seasonal changes in the Brewer-Dobson circulation (Hitchman et al., 1994). In addition, observed interleaving of high and low aerosol loadings in subtropical jets implies extensive two-way stratosphere-troposphere exchange of aerosol (Wilson et al., 1992). These and other examples of using stratospheric aerosol to understand stratospheric circulation are reviewed in Hitchman et al. (1994).
Chapter 1: Stratospheric Aerosol Processes
1.2 The Life Cycle of Stratospheric Aerosol
The life cycle of stratospheric aerosol (Figure 1.1) involves processes of gaseous precursor species and aerosol particles entering the stratosphere through the tropical tropopause, the transport and transformation of the aerosol within the Brewer-Dobson circulation, and the removal of aerosol in air traversing the extra-tropical tropopause and through gravitational sedimentation.
Figure 1.1. Schematic of the stratospheric aerosol life cycle (from Hamill et al., 1997).
Non-volcanic stratospheric aerosol particles are formed primarily through binary homogeneous nucleation of sulfuric acid and water in rising air masses close to the tropical tropopause (Goodman et al., 1982; Yue and Deepak, 1984; Brock et al., 1995). These particles grow by condensation of H2SO4 and water vapor and undergo coagulation, both with other newly formed particles and with larger aged particles mixed into the same atmospheric region. The aerosol in the tropical regions is rapidly transported zonally with the mean stratospheric winds, while the transport meridionally is determined by large-scale stirring and mixing, with an air mass boundary existing in the 15-30o latitude range (Plumb, 1996). The existence of such a “leaky tropical pipe” reduces the rate of dilution of tropical aerosol mass into the extra-tropics, (Trepte and Hitchman,1992). Poleward transport of aerosol becomes effective during the westerly phase of the quasi-biennial oscillation but is restricted during the easterly phase. Aerosol transported into the mid and high latitudes evolves in several ways. Firstly, particle growth by condensation of H2SO4 continues as OCS and SO2 are oxidised. The particle size distribution evolves through processes of growth, coagulation and sedimentation (see Section
Chapter 1: Stratospheric Aerosol Processes
5
1.4). In addition, the aerosol descends diabatically to the mid-latitude lowermost stratosphere where it can eventually be removed in the troposphere through quasi-isentropic transport of the air in tropopause folds. Such transport in air moving into the troposphere is the dominant removal mechanisms for stratospheric aerosol, although the aerosol mass towards the top of the aerosol layer is around 50% lower than at the bottom of the layer because of vertical redistribution of the particles by gravitational sedimentation. Particles transported into the polar vortex are also removed in diabatically descending air during winter and spring. Additional removal occurs over the poles when the sulfuric acid particles serve as sites for polar stratospheric cloud (PSC) particle formation. Some PSC particles composed of nitric acid hydrate or ice can grow to several microns in diameter and sediment rapidly to the tropopause, taking included sulfuric acid particles with them. Similar removal processes occur within cirrus clouds forming at tropopause altitudes.
The large-scale poleward transport and isentropic mixing of aerosol, coupled with the processes of particle condensational growth, coagulation and sedimentation leads to the generation of a quasi-steady aerosol layer (Junge layer). At the bottom of the layer, particles are removed at the tropopause. The top of the layer (typically >35 km altitude) is set by the thermodynamic stability of the sulfuric acid particles. Higher temperatures and lower partial pressures of H2SO4 and H2O at high altitudes are such that the acidic particles evaporate completely. The model calculations in Chapter 6 show that the total sulfur above the aerosol layer (=SO2 + OCS + H2SO4) is very strongly controlled by the sedimentation of particulate sulfur throughout the aerosol layer, being approximately one-third of the total abundance that would result if sedimentation were not effective.
Global 2-D and 3-D models have been developed that couple the gas phase chemistry of sulfur species with the large-scale dynamical transport and aerosol microphysics (see Chapter 6). These models have been quite successful in reproducing observed particle surface area densities, mass loadings and size distributions. The models are also useful in diagnosing the relative contribution of the different source gases to the eventual aerosol loading.
1.3 Sources of Sulfur Gases and Aerosol to the Stratosphere
Sulfur gases enter the stratosphere along with freshly nucleated aerosol primarily at the tropical tropopause. The global distribution of the gases OCS, SO2, and H2SO4 is then determined by the large-scale circulation, gas-phase chemical reactions, and eventual removal of H2SO4 by condensation on to the aerosol.
The non-volcanic “background” stratospheric aerosol loading (see the Introduction) is a critical quantity because, in comparison with models that simulate the aerosol loading, it provides a baseline quantification of the non-volcanic sulfur flux from the troposphere to the stratosphere (see Chapter 2).
The accurate quantification of gas concentrations at the tropopause, where air enters the stratosphere, requires precise knowledge of geographical distributions of sources, emission strengths of individual sources, and non-chemical sinks (e.g., uptake of OCS on vegetation in the NH introducing a seasonal signature in net OCS input to the free troposphere, see Chapter 2). The total sulfur emission at the Earth’s surface lies between 89 and 102 Tg/year, with SO2 emissions during the industrial period dominating this source. Although OCS emissions make up only a small fraction of the total sulfur emitted, the long atmospheric lifetime of OCS means that it is a significant source of sulfur to the stratosphere (Chapter 2).
Chapter 1: Stratospheric Aerosol Processes
Even when tropospheric source strengths of sulfur gases are known, there remains the difficulty of quantifying gas concentrations at the tropical tropopause. A particular problem in models has been to estimate the input of SO2 to the stratosphere because of its complex chemistry and interaction with clouds as it is transported to the tropical tropopause. Deep extra-tropical thunderstorms may also transport gases directly and irreversibly into the lowermost stratosphere, aided by breaking gravity waves at cloud top (Wang, 2004). Pitari et al. (personal communication, 2002) have estimated that 70% of stratospheric sulfuric acid is derived from tropospheric SO2 and 30% from OCS and Pitari et al. (2002) have shown that tropospheric convective transport of SO2 to the tropical upper troposphere is required in order to generate stratospheric aerosol loadings that agree with those derived from SAGE II observations. However, as this assessment shows, there remains considerable uncertainty in these numbers and much inter-model variability in SO2 concentrations in the tropics (Chapters 2 and 6). At present, the lack of SO2 observations during volcanically quiescent periods makes it difficult to improve these uncertainties. A particularly uncertain process in model is the efficiency with which SO2 is removed by precipitation in the cloud column.
It is important to note that SO2 input to the stratosphere has an immediate impact on the aerosol properties near the tropical source region, as it becomes quickly oxidized to condensable sulfuric acid. In contrast, the comparatively slow chemical conversion of OCS into sulfuric acid means that it is has widespread impact on the global stratosphere. Thus, uncertainties in quantifying the net stratospheric input of OCS will directly affect a large fraction of the aerosol mass in the middle and upper stratosphere globally, while uncertainties in SO2 input tend to influence lower stratospheric aerosol properties, where the bulk of the aerosol mass resides. As SO2 derived from combustion sources has a different isotopic mass than SO2 derived from oxidation of OCS, isotopic fractionation of sulfur species in aerosol particles could in principle be used to determine the origin of particulate sulfur.
Another difficulty in quantifying the background stratospheric aerosol loading is the poor quantification of the particles entering through the tropical tropopause. Particle concentrations in the tropical UT are poorly quantified from measurements and difficult to estimate from models. Only recently, in situ measurements of particle size distributions in the accumulation mode size range have become available in this region (see Chapter 6). In Chapter 6 the sensitivity of stratospheric aerosol to the assumed tropospheric source of particles is investigated. Overall, the model simulations conducted as part of this assessment suggest that OCS dominates as a source of sulfuric acid above about 25 km, with SO2 and becoming significant at lower altitudes. Sulfate particles transported from the upper troposphere is also a significant source below 25 km.
1.4 Stratospheric Aerosol Microphysics and the Particle Size Distribution
1.4.1 Global Aerosol
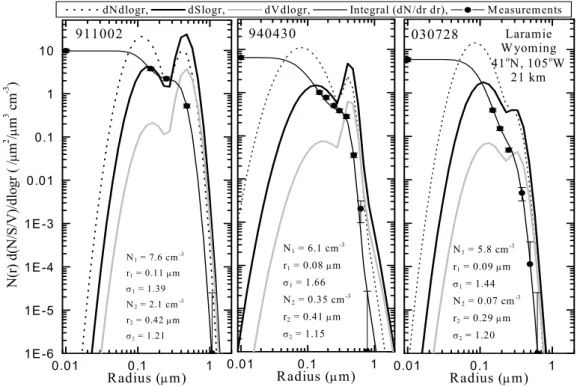
The microphysical processes of nucleation, condensational growth, coagulation, sedimentation and evaporation determine the particle number concentration and size distribution. Figure 1.2 shows size distributions from in situ optical particle counter measurements at 21 km altitude above Laramie, Wyoming during non-volcanic and volcanic conditions. The observations have been fit to a bimodal lognormal distribution. A single mode lognormal distribution has the form
Chapter 1: Stratospheric Aerosol Processes 7
(
)
2 1 ) 2 ( ln ln ) / ( ln exp ) ( 2 2 2 1 0 σ π σ r r r N dr r dN m − = ,where N is the number concentration, N0 is the total particle concentration in the mode, r is radius, rm is the median radius, and σ is the width of the distribution. Lognormal distributions have been used to fit the stratospheric aerosol sizes for some time (Jäger and Hofmann, 1991; Hofmann and Deshler, 1991), although other distributions have been tested (Rosen and Hofmann, 1986). Lognormal distributions are commonly used because they typically fit the data very well. In addition, in a simple evolving aerosol there are physical reasons to expect a lognormal-like particle size distribution to develop, although the processes that shape the natural distribution in the stratosphere include also mixing of young and aged aerosol and gravitational settling, so lognormal distributions are likely to be only an approximation in most cases. Typical parameters of the distribution under volcanically quiescent periods are
N0 = 5-10 cm-3, rm = 0.07 µm and σ = 1.6-1.8.
The observations in Figure 1.2 show that the background particle number and volume distribution is clearly bimodal during both volcanic and non-volcanic conditions, with one mode at typically <0.1 µm radius and a larger mode at ~0.3-0.4 µm. The larger mode tends to be more pronounced in aerosol perturbed by the Pinatubo eruption. The particle number and surface area are dominated by the small mode, while the larger mode may contribute significantly to the total particle mass in some regions. Bauman et al. (2000; 2003) discuss the importance of bimodality for the retrieval of particle properties from satellite extinction measurements under background and volcanically perturbed conditions.
Figure 1.3 shows how the size distribution changes with altitude during volcanic and non-volcanic conditions. The number concentration in the small mode remains constant at between 5-10 cm-3 up to altitudes of 30-35 km during volcanic and non-volcanic conditions. In contrast, the number of particles in the larger mode falls sharply in the vertical during non-volcanic conditions, from around 0.1 cm-3 at 19-20 km altitude to 0.01 cm-3 above 25 km. The fraction of observed distributions with a detectable large mode also falls with altitude; almost all distributions are observed to be bimodal below 25 km but the fraction falls to zero at 35 km. The most obvious change in the vertical aerosol profile during volcanic conditions is the number of particles in the larger mode – typically around 1 cm-3 in the lower stratosphere, which is a factor 10 greater than during non-volcanic conditions. In contrast, the size of the particles in the large mode remains approximately constant at ~0.3-0.5 µm radius.
Global stratospheric aerosol microphysics models do not capture the observed bimodality above 0.1 µm radius (Chapter 6). Typical model size distributions have a mode at about 0.01 µm and a second mode at 0.1 µm. The small model mode is too small to be measured by optical particle counters, while the larger model mode agrees well with that observed. The observed large particle mode at 0.3-0.4 µm may be related to sources of primary particles at the tropopause. The observed decrease in the occurrence frequency and number of particles in this mode is consistent with such a tropospheric source. The observed large particle mode could also be generated from aerosol recycled within the stratosphere via the Brewer-Dobson circulation followed by transport back into the tropical updraft, but the importance of this pathway relative to a tropospheric source is difficult to assess. It is possible that such particles
Chapter 1: Stratospheric Aerosol Processes
could act as heterogeneous ice nuclei forming ice at low supersaturations and perhaps affect ozone chemistry (Meilinger et al., 2001).
Observations and model calculations (see Chapter 6) show that sulfuric acid particle nucleation occurs only in the coldest regions of the stratosphere – close to the tropical tropopause (Figure 1.4) and in the polar winter stratosphere (Section 1.4.2), while nucleation rates at the mid-latitude tropopause are considerably lower. Goodman et al. (1982) noted that size distributions observed over Panama (80o E, 10o N) by the ER-2 were consistent with newly formed particles. This observation was supported by the first SAGE observations of aerosol extinction (Yue and Deepak, 1984), and later by more recent tropical aircraft measurements and theoretical considerations (Brock et al., 1995). The Brock et al. observations show aerosol particle concentrations just below the tropical tropopause of up to 104 mg-1 air (~2x103 cm-3 at 100 hPa and 200 K), which is considerably higher than typical condensation nucleus (CN) concentrations of ~10 cm-3 observed at mid-latitudes (see Figure 1.3). Aerosol processes in the tropopause region are discussed further in Section 1.6. Observations outside the tropical regions also show an enhanced mode of small aerosol near the tropopause (Wilson et al., 1992).
0.01 0.1 1 1E-6 1E-5 1E-4 1E-3 0.01 0.1 1 10 0.01 0.1 1 0.01 0.1 1 N(r) d(N/S/V)/d lo gr ( / µ m 2 /µ m 3 cm -3 ) Radius (µm)
dNdlogr, dSlogr, dVdlogr, Integral (dN/dr dr), M easurements
911002 N1 = 7.6 cm-3 r1 = 0.11 µm σ1 = 1.39 N2 = 2.1 cm-3 r2 = 0.42 µm σ2 = 1.21 Radius (µm) 940430 N1 = 6.1 cm-3 r1 = 0.08 µm σ1 = 1.66 N2 = 0.35 cm-3 r2 = 0.41 µm σ2 = 1.15 Radius (µm) 030728 N1 = 5.8 cm-3 r1 = 0.09 µm σ1 = 1.44 N2 = 0.07 cm-3 r2 = 0.29 µm σ2 = 1.20 Laramie Wyoming 41oN, 105oW 21 km
Figure 1.2. Differential number (cm-3), surface area (µm2 cm-3), and volume ((µm3 cm-3) distributions,
as a function of dlog10(r) derived from fitting bimodal lognormal size distributions to in situ optical
particle counter measurements above Laramie, Wyoming. The measurements are shown as data points with Poisson error bars. The solid lines passing near the data points are the cumulative number distributions obtained from integrating the size distributions fit to the data. The measurements are all 1.0 km averages centered on 21 km, and are representative of mid stratospheric aerosol for cases of large volcanic loading (5 October 1991 - 911005), moderate loading (30 April 1994 - 940430) and background (28 July 2003 - 030728). Note that there is a second mode to the distribution even in the background case.
Chapter 1: Stratospheric Aerosol Processes
9
Coagulation and condensation of H2SO4 vapor as the aerosol is transported to higher latitudes leads to the development of the typical mid-latitude distribution containing ~10 particles cm-3, although as Hamill et al. (1997) have shown, the mixing of young and aged aerosol and the vertical redistribution of the largest particles likely play an important role in shaping the canonical distribution. Although a full microphysical model that couples these processes is required to generate observed distributions, some approximate time constants for the individual processes can be estimated. For example, using a simple box model Hamill et al. (1997) have shown that although coagulation and mixingis important in controlling the width of the particle size distribution, it is condensation of H2SO4 that accounts for most of the growth. They were able to broadly reproduce an observed size distribution by artificially mixing distributions that had evolved in the model over a period of 2 years. The very rapid
0.01 0.1 1 10 15 20 25 30 0.01 0.1 1 10 0.0 0.5 1.0 0.0 0.5 1.0 Radius (µm), Concentration (cm-3) 1995-2003 N1 r2 r1 N2 r2 r1 N2 N1 A lti tud e ( km ) 1992-1995 Laramie Wyoming 41oN 105oW Bimodal Fraction
Figure 1.3. Vertical profiles of integral number concentration (cm-3) and median radii (µm) from
unimodal/bimodal lognormal parameters fit to balloonborne in situ optical particle measurements [Deshler et al., 2003]. Averages and standard deviations for modal number concentration, N1, N2
(gray lines with error bars), and median radii, r1, r2 (dark lines with data points and error bars), and
fraction of measurements which were bimodal (red dashed lines, with scale at the top) are shown. The fitting parameters from two time periods are shown, 1992-1995, encompassing the Pinatubo aerosol and its decay, and 1995-2003, representing the current stratospheric background. Both time periods include about 30 individual profiles.
Chapter 1: Stratospheric Aerosol Processes
initial coagulation of high number densities of particles at the tropical tropopause, the long lifetimes of the aerosol in the stratosphere, and the rapid decrease in coagulation rate with decreasing particle concentration all ensure that the aged mid-latitude size distribution is relatively insensitive to the initial nucleation rate (Chapter 6). In fact, conditions at the tropical tropopause are such that the nucleation rate is often close to the kinetic limit, rendering the stratospheric aerosol population fundamentally insensitive to the assumed nucleation rate. This also implies that ion-assisted nucleation is of little importance in the tropical UT, because the number of ion pairs is typically much smaller (by two orders of
magnitude) than the number of nuclei mode particles.
To first order, the composition of the stratospheric aerosol outside the polar regions (T>200 K) can be considered as a mixture of sulfuric acid and water. The H2SO4 concentration in the aerosol particles depends on the water partial pressure and temperature, and the particles can be assumed to be in equilibrium with the ambient water on the timescale of seconds or less. Early calculations of the acid concentration (Steele and Hamill, 1981) over the full range of stratospheric conditions have been updated by more sophisticated thermodynamic model calculations (for a review, see Carslaw et al., 1997), although the changes relative to earlier calculations for binary H2SO4/H2O aerosol under most stratospheric conditions are small. Figure 1.4. Tropical upper troposphere/lower stratosphere condensation nucleus (CN) concentrations measured by Brock et al. (1995). The horizontal dashed line marks the approximate height of the tropopause.
Chapter 1: Stratospheric Aerosol Processes
11
Temperatures are low enough in the polar regions during winter to allow appreciable partitioning of other soluble gases such as HCl, HBr and HNO3 into the sulfuric acid (Carslaw et al., 1994; Tabazadeh et al., 1994; Carslaw et al., 1997). Figure 1.5 shows model calculations of the change in particle composition (and hence also size) with temperature.
The change in the equilibrium composition and water content of stratospheric particles in response to changes in temperature and humidity lead to seasonal changes in particle size that need to be taken into account when examining variations in aerosol extinction observed by satellite instruments (refractive indices also change with composition, but are of secondary importance to changes in particle size). For a change in temperature from 215 to 220 K the extinction ratio for a typical mid-latitude sulfuric acid size distribution (number = 10 cm-3, radius = 0.1 µm) changes by approximately 10%. Away from regions of new particle formation in the tropics, the stratospheric condensed sulfur amount is a rather slowly evolving quantity, although the aerosol physical and chemical properties can react essentially instantly to changes in temperature and humidity.
Figure 1.5. Model calculations of (a) specific particle volume and (b), (c) composition of stratospheric particles as a function of temperature, including uptake of soluble gases under polar winter conditions (from WMO 1998). The nitric acid trihydrate (NAT) and ice equilibrium temperatures are marked. In panel (a) the volume as measured by the Forward Scattering Spectrometer Probe (FSSP) during a flight of the ER-2 into the Arctic vortex in 1988 is shown as data points along with the equivalent model calculation.
![Figure 2.7 Global surface OCS mixing ratios as estimated from a range of surface sites (data from South Pole, Tasmania, Samoa, Kumukahi, Mauna Loa, Niwot Ridge, Barrow, and Alert were used to calculate hemispheric means [Montzka et al., 2001]](https://thumb-eu.123doks.com/thumbv2/123doknet/6773714.187544/68.892.123.715.129.532/figure-global-estimated-tasmania-kumukahi-calculate-hemispheric-montzka.webp)
![[PDF] L’essentiel sur Merise pdf](data:image/gif;base64,R0lGODlhAQABAIAAAP///wAAACH5BAEAAAAALAAAAAABAAEAAAICRAEAOw==)