URL de PolyPublie:
PolyPublie URL: https://publications.polymtl.ca/3530/
Version: Version officielle de l'éditeur / Published versionRévisé par les pairs / Refereed Conditions d’utilisation:
Terms of Use: CC BY
Document publié chez l’éditeur officiel
Document issued by the official publisher
Titre de la revue:
Journal Title: Journal of Voice
Maison d’édition:
Publisher: Elsevier
URL officiel:
Official URL: https://doi.org/10.1016/j.jvoice.2016.05.015
Mention légale:
Legal notice:
Ce fichier a été téléchargé à partir de PolyPublie, le dépôt institutionnel de Polytechnique Montréal
This file has been downloaded from PolyPublie, the institutional repository of Polytechnique Montréal
Different Signals’ Decomposition Techniques
*Lina Abou-Abbas,*Chakib Tadj,*Christian Gargour, and†Leila Montazeri,*Montreal, and †Canada
Summary: This paper addresses the problem of automatic cry signal segmentation for the purposes of infant cry anal-ysis. The main goal is to automatically detect expiratory and inspiratory phases from recorded cry signals. The approach used in this paper is made up of three stages: signal decomposition, features extraction, and classification. In the first stage, short-time Fourier transform, empirical mode decomposition (EMD), and wavelet packet transform have been considered. In the second stage, various set of features have been extracted, and in the third stage, two supervised learn-ing methods, Gaussian mixture models and hidden Markov models, with four and five states, have been discussed as well. The main goal of this work is to investigate the EMD performance and to compare it with the other standard decomposition techniques. A combination of two and three intrinsic mode functions (IMFs) that resulted from EMD has been used to represent cry signal. The performance of nine different segmentation systems has been evaluated. The experiments for each system have been repeated several times with different training and testing datasets, randomly chosen using a 10-fold cross-validation procedure. The lowest global classification error rates of around 8.9% and 11.06% have been achieved using a Gaussian mixture models classifier and a hidden Markov models classifier, respectively. Among all IMF combinations, the winner combination is IMF3+IMF4+IMF5.
Key Words: automatic segmentation–empirical mode decomposition–wavelet packet transform–Gaussian mixture models–hidden Markov models.
INTRODUCTION
Crying is the only possible way for newborns to express their needs and their physical conditions because they are not able to communicate with words. Cry signals have been studied for many years, and it has become evident that cry signals can provide valuable information concerning physiological and physical states of infants. Most research on infant cry focused on extracting in-formation from infant cry signals with known medical problems such as prematurity asphyxia, hypoglycemia, Down syndrome, and meningitis. For example, the cries of infants with neonatal asphyxia and meningitis are high-pitched, and the cry duration is very short or unusually long with melody type rising or falling-rising in comparison with healthy infants. Preterm babies have higher minimum fundamental frequency than normal babies. Cries of infants with hyperbilirubinemia have significant changes in fundamental frequency over a 100-ms period. For the reason of cries, features such as pitch and loudness are able to distin-guish hunger cry from pain cry.1–4
Given these pieces of evidence, many researchers have sug-gested an automatic system to classify infant cries, which is more like a pattern recognition problem, similar to automatic speech recognition (ASR) systems. The aim of the automatic classifi-cation system is to give clinicians an early diagnostic result if a baby may have high probability to get specific types of medical diseases. As in any ASR system, a cry classification system needs
a segmentation module that can detect useful parts of recorded signal and reject other acoustic activities to be thereafter classified. Infant cry signals consist of a sequence of audible expira-tory and inspiraexpira-tory phases separated by a period of silence or by unvoiced phases of cry (inaudible expiratory and inspira-tory phases during a cry). A cry signal recorded in a real environment usually contains different acoustic activities other than the cry, such as background noise, speech, sound of medical equipment, and silence. This work aims to retrieve most rele-vant and audible sections from cry signals recorded in a realistic clinical environment, as well as distinction between expiratory and inspiratory phases of the cries. One way to address this problem is to manually segment recorded audio signals and pick out important cry parts. However this manual task is tiresome and prone to errors when the volume of data is large. It is there-fore essential to design a segmentation system able to automate this tedious task and be implemented in a real-time clinical de-cision support tool. Typical waveforms of a cry signal, expiratory phase, and inspiratory phase of cry signals are shown inFigures 1, 2, and 3, respectively.
Some attempts to segment cry signals have been reported in the literature. Many studies used the spectrogram to segment cry signals manually through visual and audio monitoring.5On one
hand, automatic segmentation is often desired to manipulate all automated diagnostic systems, and on the other hand, because the manual segmentation is an extremely long, tedious task and is prone to errors especially when the amount of data is large. A number of recent works have been done on infant cry seg-mentation based on the time domain characteristics of the signal. The problem of cry segmentation was being considered as the problem of voice activity detection. Refs. 6, 7used high-pass filter to reduce most of the background noise, and to distin-guish between important and less important parts of the cry signals, they applied short-term energy or/and zero crossing rate by using a satisfactory threshold. However, these methods perform
Accepted for publication May 24, 2016.
From the *Electrical Engineering Department, École de Technologie Supérieure, Mon-treal, Canada; and the †Electrical Engineering Department, Polytechnique MonMon-treal, Canada. Address correspondence and reprint requests to Lina Abou-Abbas, Electrical Engineering Department, École de Technologie Supérieure, Montreal, Canada. E-mail: [email protected]
Journal of Voice, Vol. 31, No. 2, pp. 259.e13–259.e28 0892-1997
© 2017 The Authors. Published by Elsevier Inc. on behalf of The Voice Foundation. This is an open access article under the CC BY license (http://creativecommons.org/licenses/ by/4.0/).
well when cries have been recorded within a laboratory envi-ronment and fail under noisy or clinical envienvi-ronment.
In other research efforts, the cry detection problem was con-sidered as the problem of start and end points detection of a cry
unit. Based on the hypothesis that cry segments have four times more energy than unvoiced segments, authors in Refs.8, 9defined some guidelines to detect cry units based on a dynamic thresh-old for each record. In these works, authors eliminate not only useless sounds from the signals but also inspiratory sounds of the cry. Another technique used in Ref.10considers the problem of cry segmentation as the problem of Voiced/Unvoiced deci-sion. In Ref.10, authors modified a well-known fundamental frequency estimation method, the Harmonic product spectrum, to check the regularity of the segment analyzed to classify it as an important or not important cry part. In Ref.11, authors used the simple inverse filter tracking algorithm to detect the voiced frames of cry based on a threshold of the autocorrelation func-tion. The use of threshold limits the attractiveness of the mentioned approaches and decreases their performance in low signal-to-noise ratio levels.
Inspiratory cry parts have been proven to be important in iden-tification of newborns at risk for various health conditions.12
Despite this evidence, it is thus surprising that in most re-search analyzing cry signals, the inspiratory parts of a cry were ignored and not considered in the analysis and the main focus was only on extraction of acoustical data of expiratory parts. FIGURE 1. An example of a portion of cry signal with its corresponding components expiration (EXP), audible inspiration (INSV), and pauses (P).
FIGURE 2. An example of a waveform and spectrogram of an expiration phase.
FIGURE 3. An example of a waveform and spectrogram of an in-spiration phase.
A cry sound segmentation system has been implemented in this work. The proposed system has the capability of detecting three different acoustic classes: audible expiration, audible in-spiration, and others (including unimportant acoustics like speech, medical machine sounds, noise, etc). Different signal decom-position techniques such as wavelet packet transform (WPT) and empirical mode decomposition (EMD) have been examined for the features extraction phase.
The WPT has been widely and successfully used in various ap-plications in the voice signal processing domain. It decomposes cry signal into sub-bands to give better resolution. The EMD has been successfully used in denoising and characterizing nonstationary and multicomponent signals such as heart sound signal.13–17
Statistic generative models such as Gaussian mixture models (GMM) and hidden Markov models (HMM) have been also chosen as classifiers to distinguish between the three different classes. Recently, GMM and HMM techniques were proven by many researchers to be very successful especially in speaker rec-ognition. These models provide a robust solution when a large amount of training data is available.
The remainder of the paper is organized as follows: the following section is the Recording Procedure and Cry Database section. Then, it is followed by the Proposed Methodology section. Mathematical backgrounds of signal decomposition methods, features extrac-tion, modeling, and classification approaches used in this work are addressed in the Mathematical Background section. An evalua-tion of the proposed methods and results obtained is reported in the System Evaluation section. Finally, the Conclusion section con-cludes the paper, offering a list of suggestions for further research.
RECORDING PROCEDURE AND CRY DATABASE Data used in this research have been obtained from the newborn Cry-based Diagnostic System (NCDS) database. A description about the data collection technique was presented in a previous work.18
A total of 507 cry signals were randomly picked up from the da-tabase. Cry signals were recorded with a sampling rate of 44.1 kHz and a sample resolution of 16 bits. The 507 cry signals with an average duration of 90 seconds have been recorded from 203 babies, including both normal and pathological cases.
The constructed dataset contains different kinds of cries, such as pain, hunger, birth cry, etc. It also includes infants’ cries in dif-ferent recording environments and conditions, from silent to very noisy combined with different acoustic activities like speech, machine sounds, noise, silence, etc. Cry signals have been man-ually segmented and labeled using WaveSurfer application (Jonas Beskow and Kare Sjolander in KTH Royal Institute of Technol-ogy in Stockholm, Sweden).19
Ten-fold cross-validation was carried out to divide the dataset between the training and the testing sets. The dataset was partitioned into 10 folds: nine folds for the train-ing set and the remaintrain-ing fold for the testtrain-ing set. Ten tests were conducted with different choice of folds. Data base statistics and details about average time of each class in the testing and train-ing datasets are presented inTables 1 and 2, respectively.
PROPOSED METHODOLOGY
The basic contribution of this paper is the proposition of a prac-tical cry sounds segmentation system with the ability to detect
audible expiratory and inspiratory cry episodes. This section de-scribes the modules required for the development of the proposed system. A block diagram of the general system architecture is presented in Figure 4. The framework is based on supervised pattern classification and it consists of two stages: training stage and testing stage. In either stage, signal decomposition module receives the input cry signal. It converts the original signal from time domain to another domain to better characterize it. Train-ing and testTrain-ing stages also share the same features extraction module. This module receives the decomposed signal as input and extracts important acoustic information within each frame to form a set of feature vectors. Training involves learning the system and creating an acoustic model for each class based on the acoustic training dataset. Reestimation algorithms are used after the initial training to adapt models’ parameters to various conditions. Subsequently, the created models, stored in a data-base as reference models, are used to classify testing dataset and to measure the system performance during the testing stage. A description of each module is described in the following subsections.
MATHEMATICAL BACKGROUND Signal decomposition
Signal decomposition, also referred to the front-end module in any audio analysis system, is the first step in the proposed method. Because most of the audio signals are nonlinear and nonstationary, a time series and frequency analysis of the signals are needed. Fourier transform, WPT, and EMD are the most common anal-ysis techniques addressed in the literature. In this paper, two cry segmentation systems based on WPT and EMD are designed and
TABLE 1. Database Statistics Number of Babies Number of Signals
Female Full term Healthy 56 141
Pathological 34 94
Preterm Healthy 20 23
Pathological 17 49
Male Full term Healthy 4 11
Pathological 54 146
Preterm Healthy 5 11
Pathological 13 32
Total 203 507
TABLE 2.
Data Used for Training and Testing Corpuses
Classes Time in Seconds Average Time for Training Corpus/s Average Time for Testing Corpus/s Expiration 21,414 19,348 2,066 Inspiration 2,154.8 1,930 224.8
compared using the system already designed based on fast Fourier transform (FFT) in our previous work.18
Wavelet packet transform
The main objective of the wavelet analysis is to apply varying size of windowing techniques on the signal under study. In low frequency band study, a large window size should be used, whereas in high frequency band study, a small window size should be employed.20
WPT represents a generalization of wavelet de-composition that could offer a more precise signal analysis by considering both low- and high-pass results. WPT decomposes the original signal into different sub-bands to get better resolu-tion. Each WPT is associated with a level j, which splits the frequency band [0, fs/2] to 2jequal bands by decomposing both
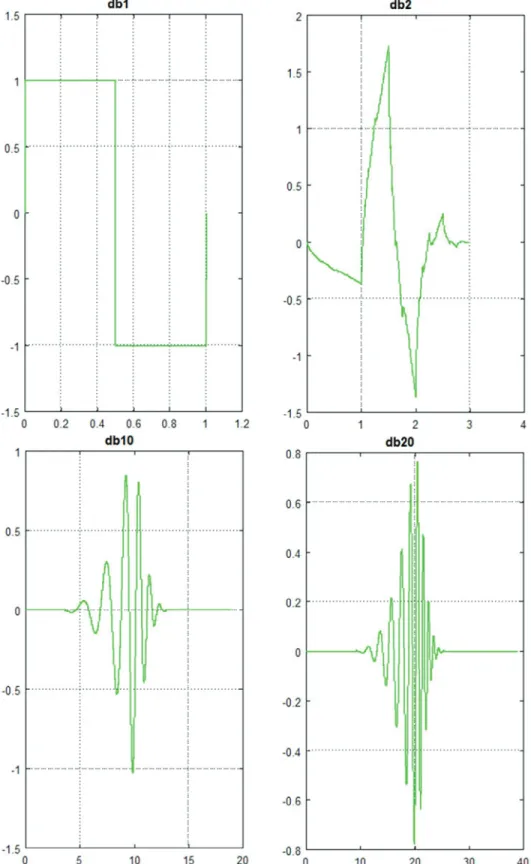
low and high frequency components called approximation and detail coefficients, respectively. The result of this decomposi-tion is a balanced tree structure. WPT has been widely and successfully used in various applications in voice signal pro-cessing domain. Based on experiences achieved during this work, WPT level 5 on different orders of Daubechies wavelet db1, db10, and db20 is employed in this study. InFigure 5, examples of some wavelet functions from the Daubechies family are shown. Considering that h(n) is the low-pass filter of length 2N also called scaling filter, and g(n) is the high-pass filter of length 2N also called wavelet filter, wavelet packet functions are esti-mated using the following equations:
W x h k W x k W x g k W x k n n k N n n k N 2 0 2 1 2 1 0 2 1 2 2 2 2 ( )= ( ) ( − ) ( )= ( ) ( − ) = − + = −
∑
∑
where W x0( )= ( )ϕ x is the scaling function andW x1( )= ( )Ψ x is the wavelet function. For more details about wavelet coefficients calculation, readers are referred to the publication of Mallat.21
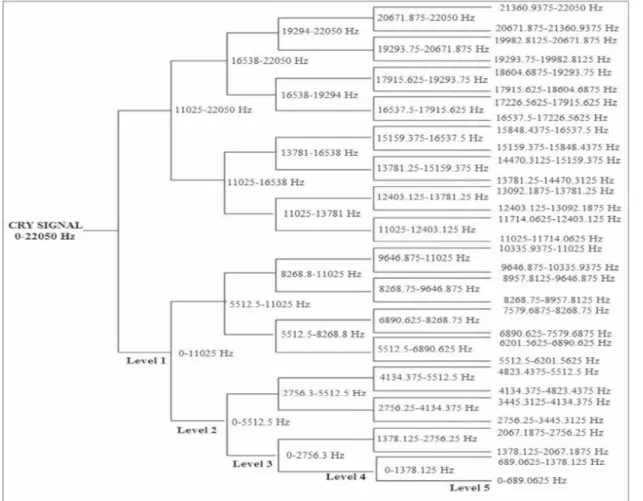
An example of a wavelet packet tree decomposition of level 5 and the corresponding frequency intervals at each level is given inFigure 6. The sampling frequency used in the present work is 44,100 Hz. Figures 7 and 8 are examples of details and
approximation coefficients at level 4 of inspiration and expira-tion phases, respectively.
Empirical mode decomposition
The EMD algorithm was proposed by Huang and colleagues in 1998 as an efficient tool to analyze natural signals that are mostly nonlinear and nonstationary. This method decomposes the given signal into a set of functions in time domain and of the same length of the original signal allowing for preservation of the fre-quency variation in time. This is the key feature of the EMD algorithm that helps to characterize natural signals being pro-duced by various causes at certain time intervals.
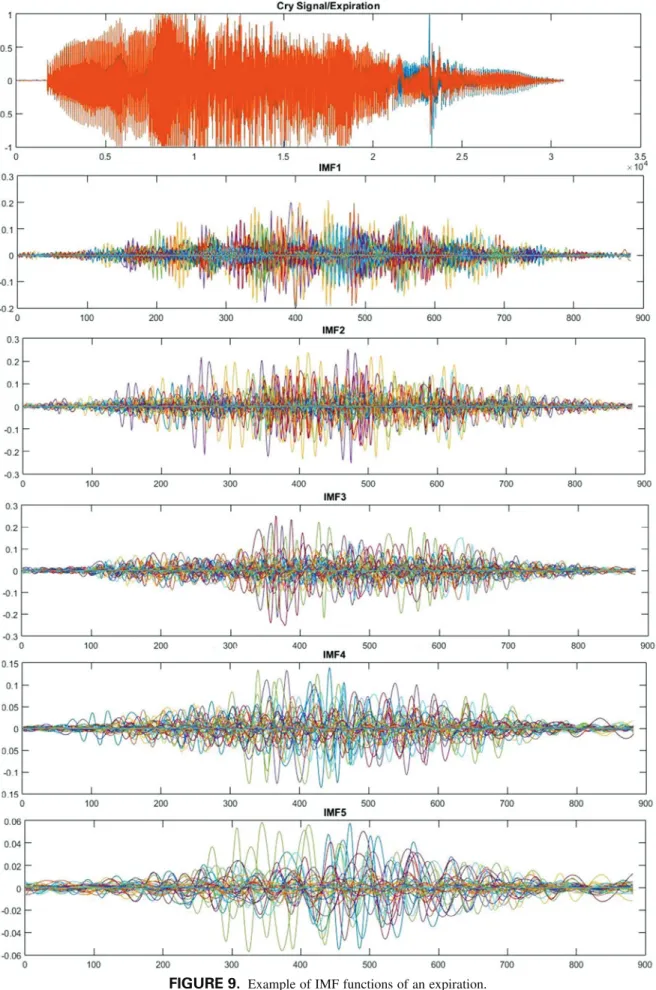
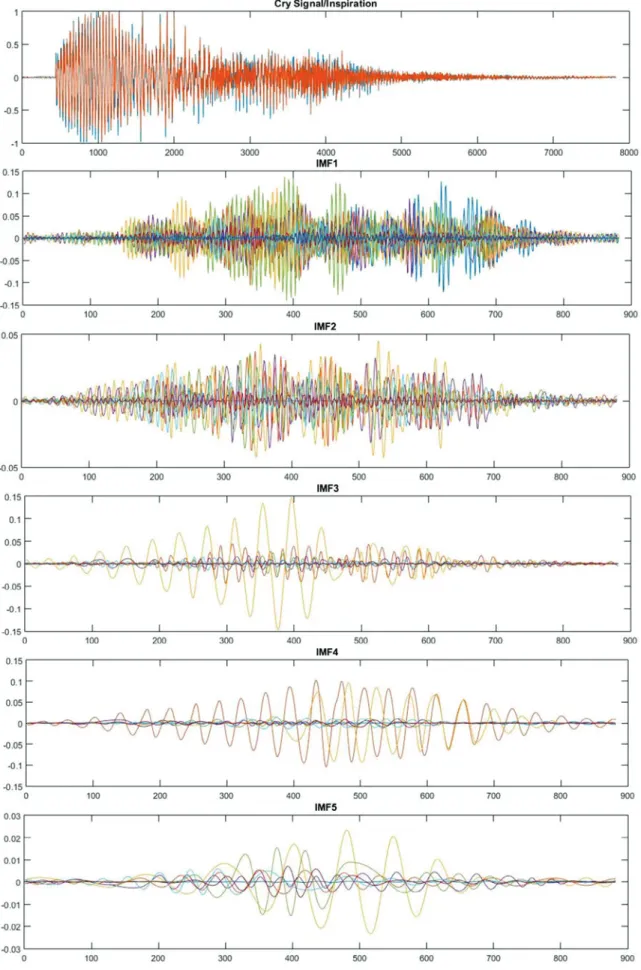
The EMD algorithm applies a sifting process to break down the given signal into a set of intrinsic mode functions (IMFs), which represents simple oscillatory mode of the original signal. Sifting process is an iterative process during which smooth en-velopes are formed by local minima and maxima of the signal, and their mean is subsequently subtracted from the initial signal to finally produce an IMF satisfying two criteria: (1) the number of extremes and the number of zero crossings in the whole se-quence of data are equal to or differ by one; (2) the mean value of the envelopes of local extremes is zero at all points. Ex-amples of extracted IMFs from expiratory and inspiratory parts of cry signal using EMD are depicted inFigures 9 and 10, respectively.
The following sifting approach has been adopted in this work to extract IMFs from a cry signal x t( ):
(1) Identify the local minima and local maxima of the given signal
(2) Interpolate the local maxima using cubic splines inter-polation method to form the upper envelope EnvU( )t
(3) Interpolate the local minima using cubic splines inter-polation method to form the lower envelope Env tL( )
(4) Obtain the mean envelope of the upper and lower en-velopes: Envm Env t Env t
U L
= ( )+ ( )
2
(5) Subtract the mean envelope from the signal:
h t( )= ( )−x t Envm( )t
(6) Iterate with x(t)= h(t) until h(t) satisfies the IMF criteria (7) Calculate the residue by subtracting the obtained IMF
from the signal: r t( )= ( )− ( )x t h t
(8) Repeat the process by considering the residue as the new signal x t( )= ( )r t until the termination condition is satisfied.
The original signal can be reconstructed by summing up the obtained IMFs and the residue:
x t C ti r t i n n ( )= ( )+ ( ) =
∑
1FIGURE 6. Example of wavelet packet decomposition level 5 of a cry signal at a sampling frequency of 44,100 Hz.
whereC ti( )and r tn( )represent the i-th IMF and the residue
func-tion, respectively. The number of IMFs extracted from the original signal is also represented by n.
The adopted termination condition in this work is the minimum number of extrema in the residue signal. However, usually a certain number of IMFs that contain more important informa-tion are used in the next steps. It has been proven through several experiments in this work that the first five IMFs of cry signals have the most important information.
Features extraction
Features extraction can be defined as the most prominent step in an automatic recognition system. It consists of decreasing the amount of information present in the signal under study by trans-forming the raw acoustic signal into a compact representation. Among several features extraction techniques that have been used in previous works, Mel-frequency cepstral coefficients (MFCC), which is still one of the best methods, has been chosen. It dem-onstrates good performance in various applications as it approximates the response of the human auditory system. Wavelet packet–based features have been also chosen owing to their ef-ficiency for segmentation proven in a previous work.22
FFT-based MFCC
MFCCs are used to encode the signal by calculating the short-term power spectrum of the acoustic signal based on the linear cosine transform of the log power spectrum on a nonlinear Mel scale of frequency (Figure 11). Mel scale frequencies are distributed in a linear space in the low frequencies (below 1000 Hz) and in a loga-rithmic space in the high frequencies (above 1000 Hz).23
The steps from original input signal to MFCC coefficients are as follows:
(1) Slice signal into small segments of N samples with an overlapping between segments
(2) Reduce discontinuity between adjacent frames by de-ploying Hamming window, which has the following form:
w n n N n N ( )= − − ⎛ ⎝ ⎜⎜⎜ ⎞⎠⎟⎟⎟ ≤ ≤ − 0 54 0 46 2 1 0 1 . . cos π ,
(3) Use FFT to convert the signal into spectrum form (4) Consider the log amplitude of the spectrum and apply
it to the Mel scale filter banks. The famous formula to convert f Hz into m Mel is given in the equation below:
Mel f( )= × ⎛ + f ⎝ ⎜⎜⎜ ⎞⎠⎟⎟⎟ 2595 1 700 10 log
(5) Apply discrete cosine transform (DCT) on the Mel log amplitudes
(6) Perform inverse of fast Fourier transform (IFFT) and the resulting amplitudes of the spectrum are MFCCs and are calculated according to the equation below:
c S n k k n K n k k n = ( ) ⎡ ⎛⎝⎜⎜⎜ − ⎞⎠⎟⎟⎟ ⎣ ⎢ ⎢ ⎤ ⎦ ⎥ ⎥ = … = −
∑
log cos 1 , , , , 2 1 2 0 1 πwhere Skis the output power spectrum of filters and K is chosen
to be 12.
Wavelet packet–based features
The shortcoming regarding traditional MFCCs is related to the use of FFT whose calculation is based on fixed window size. Another drawback concerning MFCCs is the assumption that the segment is stationary during the frame duration; it is, however, possible that this assumption could be incorrect. To solve this issue, wavelets have been given particular consideration owing to their multiresolution property. The extraction of features based on wave-lets similar to MFCC with higher performance has been shown in several works and in different ways.24–29In Ref.26, authors
pro-posed two sets of features called wavelet packet parameters and sub-band–based cepstral parameters based on WPT analysis and proved that these features outperform traditional MFCCs (Figure 12). Authors of Ref.29proposed Mel-frequency discrete wavelet co-efficients by applying discrete wavelet transform (DWT) instead FIGURE 8. Level 5 of a wavelet packet decomposition of an expiration.
of DCT to the Mel scale filter banks of the signal. Mel-frequency discrete wavelet coefficient was used in many recent works and proved its performance in speech and speaker recognition.30–32
In Ref.23, authors used admissible wavelet packet. The di-vision of frequency axis is performed such that it matches closely the Mel scale bands. In Refs.32and33, another feature extrac-tion technique is presented for deployment with speaker identification: same MFCCs extraction technique presented in FFT-based MFCC section but applied at the input wavelet chan-nels instead of the original signal. In this work, features based on WPT have been considered, and the following steps have been taken for calculation purposes:
The WPT is used to decompose the raw data signal into dif-ferent resolution levels at a maximum level of j= 5. The normalized energy in each frequency band is calculated accord-ing to the formula below:
E N W m j B j j j n m Nj =
[
( )]
= … =∑
1 1 2 2 1 , , ,where Wjn(m) is the mthcoefficient of WPT at the specific node
Wjn, p is the sub-band frequency index, and B is the total number
of frequency bands obtained after WPT.
The Mel scale filter banks are then applied to the magnitude spectrum.
The logarithms of the Mel energies obtained in each frequen-cy band are then de-correlated by applying the discrete cosine transform according to the above formula:
WE DCT n S n p B n p p B _ ( )=
(
)
⎛ + ⎝ ⎜⎜⎜ ⎞⎠⎟⎟⎟ ⎡ ⎣ ⎢ ⎢ ⎤ ⎦ ⎥ ⎥ + = −∑
log10 1 cos , 0 1 1 2 π = =0 1, ,…, B−1WE_DCT stands for wavelet energy–based DCT, which is es-timated from wavelet channels and not from the original signal.
EMD-based MFCC
These coefficients are estimated by applying MFCC extraction process on each IMF or on the sum of IMFs instead of apply-ing it on the original signal. This technique has been successfully used in many recent works in speech and heart signals classification.13–17
The EMD algorithm with resolution of 50 dB and residual energy of 40 dB has been applied to the subjected cry signals to decompose them into five IMFs (Figure 13). Next, four dif-ferent combinations of two or three IMFs have been created to be used in feature extraction phase. These sets are as follows:
Set 1: IMF34=IMF3+IMF4 Set 2: IMF45=IMF4+IMF5 Set 3: IMF234=IMF2+IMF3+IMF4 Set 4: IMF345=IMF3+IMF4+IMF5
Twelve Mel-frequency cepstral components as well as their corresponding energy have been further derived from different sets of IMFs.
Modeling and classification
Once the important parameters are retrieved from an input signal (train or test), these parameters are used as input to a nonlinear classifier whose role is to correctly attribute a class to an input frame under numerous conditions. For the classification stage of this research, two efficient statistical classifiers widely used in machine learning and pattern recognition over the last decades especially in speech and speaker recognition have been chosen: FIGURE 11. Extraction Mel-frequency cepstral coefficients (MFCC) from the audio recording signals.
HMMs and GMMs. GMM and HMM are well suited for audio recognition. GMMs are often used owing to their reduced com-putational costs, whereas HMMs allow a more refined analysis while taking into consideration the variation of the signal over time. In the following subsections, some theoretical back-grounds of these two techniques will be discussed.
Gaussian mixture models
The GMM is a probabilistic model for the computation of the probability density function p of a set of observed variables o using a multivariate Gaussian mixture density. A GMM is rep-resented as a weighted sum of Gaussian distributions and is expressed by the equation below:
p o w G oj j j j J λ μ ( )=
(
)
=∑
: ,Σ 1 where:p o( λ) is the likelihood of an input observation o of dimen-sion D
J is the number of mixtures
wj represents positive weighting factors satisfying the
con-straint wj j J =
∑
= 1 1G o
(
j,μ Σj, j)
denotes the jth Gaussian with a mean vectorμj and covariance matrix Σj. It is given by the equation
below: G o j j o M o M D i i T i i ;μ,Σ π Σ exp
(
)
=( )− −{
− ( − ) −( − )}
∑
2 1 2 2 1 2 1Given a set of observation inputs{O O1, 2,…,On}, GMM has
been shown to accurately compute the continuous probability density functions P=
{ }
pij . The parameters of each distributionwj,μjandΣj are estimated by using the
expectation-maximization algorithm. Readers seeking more details about GMM should consult the paper of Reynolds and Rose.35
During the training stage, and for each audio class defined, the parameters of each Gaussian model are computed from some sequence of training input observations by maximizing the likelihood.
During the classification or testing stage, an observation input is attributed to a specific class for which the likelihood is maximum.
Hidden Markov models
HMMs are used in most modern ASR systems. They provide an efficient framework for modeling time-varying spectral feature vectors.36Different applications of HMM in statistical signal
pro-cessing and acoustic modeling can be found in literature especially in speech and audio domains.36,37
An HMM is defined by dif-ferent sets of parameters: number of hidden states, state transition probability distribution A, observation probability distribution B, and initial state distributionπ.
HMM model is denoted asλ = {A, B, π}.
Considering a spectral sequence of observations O= O1,
O2, . . .,OT, one can model the sequence of spectra by using a
Markov chain.
q=(q q0, ,1…qt) qtas the state of the system at time t, and
N as the number of states of HMM.
A a a q j q i i j N ij ij t =
[ ]
=Pr( = = ) 1≤ , ≤The probability of q being generated by the Markov chain is given by the following equation:
Pr(q A,π)=πq11aq q0 1aq q1 12…aqt−1qt
For more details about HMM parameters estimation, readers are referred to Refs.22, 36.
As main training function and to initialize HMM param-eters, the Viterbi algorithm is used to find the most likely state sequence for each training input. The log likelihood of the train-ing data is calculated, and the process is repeated until no further increase in likelihood can be found. By applying the so-called Baum-Welch algorithm, the reestimation of the HMM param-eters is carried out. The probability of the observation generated by each class is computed to test an unknown observation, and a decision is then taken based on the maximum probability obtained.
SYSTEM EVALUATION
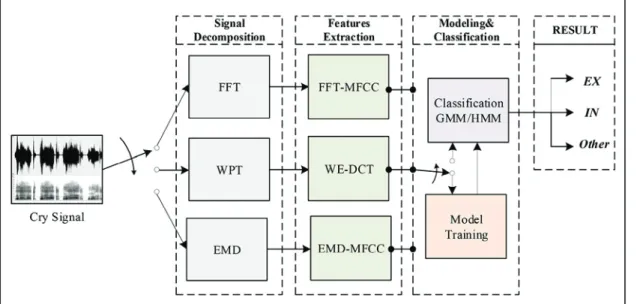
The aim of this work is to develop an automatic segmentation system with a low error rate.Figure 14depicts an overview of the adopted methodology. It is based on three essential stages: signal decomposition, features extraction, and classification. In this study, we evaluated the efficiency of nine differently imple-mented systems listed below by varying approaches in each stage:
(1) FFT+FFT-MFCC+GMM (2) FFT+FFT-MFCC+4-states HMM (3) FFT+FFT-MFCC+5-states HMM FIGURE 13. Features extraction step after EMD.
(4) WPT+WE-DCT+GMM (5) WPT+WE-DCT+4-states HMM (6) WPT+WE-DCT+5-states HMM (7) EMD+EMD-MFCC+GMM (8) EMD+EMD-MFCC+4-states HMM (9) EMD+EMD-MFCC+5-states HMM
GMM-based system is compared with four and five states, left to right HMM-based systems using multiple Gaussian mix-tures with diagonal covariance matrices for each class. A varying number of mixtures per state from 16 to 64 Gaussians have been also considered. The efficiencies of the proposed systems are evaluated by comparing their performances with the FFT-based system designed in the previous work.18Each frame was
represented by a 13-dimensional feature vector. Two different window frame sizes, 30 ms and 50 ms, with an overlap of 30% are employed.
For both training and evaluation purposes, 507 cry signals used in this paper are manually labeled. The experiments were per-formed using the 10-fold cross-validation. The whole database is divided several times into two parts: the first part has been used for training and the second part for testing. The average duration of the corpuses used was shown inTable 2. The process of training and testing was repeated for each set of corpuses. To ensure reliable results, the average of the total classification error rate of the same experiments repeated with different sets of training and test corpuses was considered.
To evaluate the efficiency of the systems, the manual tran-script files and the files generated at the front end of the system are compared. The performance of the designed systems is then calculated as shown below:
CER Nb of Correctly Classified Segments
Total number of Observ
=100−
a
ation in the test Corpus
×100%
where CER stands for classification error rate.
Systems 2 and 3 based on FFT decomposition were consid-ered in the previous work.18
Training and testing phases using the corpuses described in the Proposed Methodology section are re-executed.Table 3summarizes the comparison between systems 1, 2, and 3 based on FFT decomposition.
It can be concluded that based on an FFT decomposition: (1) a GMM classifier outperforms the four- and five-states
HMM classifiers.
(2) a lower window size with GMM classifier gives better results than higher window size.
(3) an HMM classifier produces best results by increasing its number of states.
(4) a higher window size with HMM classifier presents best overall results than lower window size.
The obtained results are summarized inFigure 15. A GMM with 40 mixtures outperforms all experiments and gives a low classification error rate of 8.98%.
Results obtained using systems 4 to 6 are indexed inTable 4
where WPT was employed as decomposition method:
Different levels of decomposition such as 4, 5, and 6 are tried. The best results were obtained using five levels of decomposi-tion. In this paper, therefore, only results obtained by level 5 are addressed.
FromTable 4andFigure 16, it can be concluded that using a wavelet packet decomposition:
FIGURE 14. Overview of the different methodologies used in this work.
TABLE 3.
Classification Error Rates for an FFT-based Extraction Features
FFT_MFCC 30 ms–21 ms 50 ms–35 ms
GMM 8.98 15.99
4-states HMM 26.3 21.23
(1) an HMM classifier outperforms a GMM classifier. (2) a lower window size with either a GMM or an HMM
classifier gives better results than higher window size. (3) an HMM classifier with four states outperforms an HMM
classifier with five states.
The results obtained from systems 4, 5, and 6 are shown in the chart inFigure 16. It is proven that lower classification error rate of 17.02% is achieved using a four-states HMM and a window size of 30 ms.
Using the EMD decomposition technique, four sets of dif-ferent IMF combinations are examined. These four sets are chosen
based on results obtained from the experiments of a previous work.38
InFigure 17, it can be concluded that while using different combinations of IMFs:
(1) the parameters based on the combination of IMF3, IMF4, and IMF5 yielded the best results.
(2) GMM classifier outperforms an HMM classifier in the set IMF45, IMF234, and IMF345.
(3) four-states HMM outperforms GMM classifier and five-states HMM classifier while using the set IMF34. (4) best results in most classifiers are obtained using a lower
window size.
It can also be seen fromFigure 17that the features repre-sented by the so-called IMF345, which is the combination of IMF3, IMF4, and IMF5, yielded the lowest error rate of 11.03% using again a GMM classifier and a window size of 30 ms.Table 5
andFigure 18compare the proposed systems in terms of fea-tures and classifiers.
It can be seen inTable 5that best results are yielded using the features obtained based on FFT decomposition and using a GMM FIGURE 15. Comparison of CER between different classifiers for an FFT-based MFCC.
TABLE 4.
Classification Error Rates for a WPT-based Extraction Features
WE_DCT 30 ms–21 ms 50 ms–35 ms
GMM 22.2 29.75
4-states HMM 17.02 27.09
5-states HMM 21.17 27.42
classifier while using a window size of 30 ms. The minimum ob-tained classification error rates while employing a 50 ms window size are marked by using EMD decomposition combining IMF3, 4, and 5 and GMM classifier to reach a classification error rate of 11.43%. The results are demonstrated inTable 6andFigure 19.
To compare the performance of all examined systems in this paper,Table 7summarizes the best error rate obtained by varying different parameters.
Analyzing these results, we outline the following conclusions:
FIGURE 17. CER of different classifiers used and different window sizes for EMD-based features.
TABLE 5.
CER of Different Features Extracted and Different Clas-sifiers for a Window Size of 30 ms
Features/Classifier—30 ms GMM 4-states HMM 5-states HMM FFT_MFCC 8.98 26.3 23.4 WE_DCT 22.2 17.02 21.17 IMF34 17.12 13.44 17.73 IMF45 12.74 13.43 18.38 IMF234 11.32 11.53 15.09 IMF345 11.03 11.06 11.56
FIGURE 18. Comparison between CER of different features extracted and different classifiers for a window size of 30 ms.
TABLE 6.
CER of Different Features Extracted and Different Clas-sifiers for a Window Size of 50 ms
Features/4-states HMM—50 ms GMM 4-states HMM 5-states HMM FFT_MFCC 15.99 21.23 17.29 WE_DCT 29.75 27.09 27.42 IMF34 20.06 17.73 21.91 IMF45 13.95 18.38 22.15 IMF234 12.16 15.09 20.96 IMF345 11.43 11.56 16.45
(1) System number 1 (FFT+FFT-MFCC+GMM) performed the best among the nine proposed systems by giving an average class error rate of 8.98% for various training and testing datasets.
(2) Next is system number 7 (EMD+EMD-MFCC+GMM) that achieved an error rate of 11.03% by using a com-bination of IMF345.
(3) It can also be observed that results are the best for the GMM-based classification method in the case of FFT and EMD decompositions and for the four-states HMM in the case of WPT decomposition.
(4) For the FFT decomposition with HMM, best results are reached by increasing the number of states and the window size.
CONCLUSION
Newborn cry signals provide valuable diagnostic information con-cerning their physiological and psychological states. In this paper, EMD-based and wavelet-based architectures have been examined
for the purpose of automatic expiratory and inspiratory epi-sodes detection under the scope of designing a complete automatic newborn cry-based diagnostic system. The methodology em-ployed in this research is based on three phases: signal decomposition, features extraction as well as modeling, and clas-sification. Different approaches at each phase have been addressed to implement in total nine different segmentation systems. Three signal decomposition approaches were compared: FFT, wavelet packet decomposition, and EMD. WPT is applied to capture the more prominent features in high and intermediate frequency bands for the segmentation purpose and is compared with IMFs that resulted from EMD decomposition. GMM classifier is also com-pared with four and five states, left to right HMMs baseline system using multiple Gaussian mixtures with diagonal covariance ma-trices for each class. Cry signals recorded in various environments are used for training and evaluation of the proposed systems; this dataset includes 507 cry signals with average duration of 90 seconds from 207 babies. To ensure the liability of results, the 10-fold technique is carried out; 90% of the data corpus was FIGURE 19. Comparison between CER of different features extracted and different classifiers for a window size of 50 ms.
TABLE 7.
The Best CER Obtained for the Different Systems Implemented
System Decomposition Technique Features Extraction Classification Method Best Error Rate %
1 FFT FFT-MFCC GMM 8.98 2 FFT FFT-MFCC 4-states HMM 21.23 3 FFT FFT-MFCC 5-states HMM 17.29 4 WPT WE-DCT GMM 22.2 5 WPT WE-DCT 4-states HMM 17.02 6 WPT WE-DCT 5-states HMM 21.17 7 EMD EMD-MFCC GMM 11.03
8 EMD EMD-MFCC 4-states HMM 11.06
tion grant number OPP1067980. Thank the staff of Neonatology deparments at Sainte Justine Hospital and Sahel Hospital for their cooperation in the data collection process.
REFERENCES
1. Corwin MJ, Lester BM, Golub HL. The infant cry: what can it tell us? Curr
Probl Pediatr. 1996;26:325–334.
2. Wasz-Höckert O, Michelsson K, Lind J. Twenty-five years of Scandinavian
cry research. In: Lester B, Zachariah Boukydis CF, eds. Infant Crying. Springer US; 1985.
3. Amaro-Camargo E, Reyes-García C. Applying statistical vectors of acoustic
characteristics for the automatic classification of infant cry. In: Huang D-S, Heutte L, Loog M, eds. Advanced Intelligent Computing Theories and
Applications. With Aspects of Theoretical and Methodological Issues.
Springer Berlin Heidelberg; 2007.
4. CanoOrtiz SD, Beceiro DIE, Ekkel T. A radial basis function network
oriented for infant cry classification. 2004.
5. Messaoud A, Tadj C. A cry-based babies identification system. In: Image
and Signal Processing. Springer; 2010.
6. Kuo K. Feature extraction and recognition of infant cries. In: Electro/
Information Technology (EIT), 2010 IEEE International Conference on.
IEEE; 2010:1–5.
7. Várallyay G. Future prospects of the application of the infant cry in the
medicine. Electr Eng. 2006;50:47–62.
8. Rui XMAZ, Altamirano LC, Reyes CA, et al. Automatic identification of
qualitatives characteristics in infant cry. In: Spoken Language Technology
Workshop (SLT), 2010 IEEE. 2010:442–447.
9. Rúız MA, Reyes CA, Altamirano LC. On the implementation of a method
for automatic detection of infant cry units. Procedia Eng. 2012;35:217– 222.
10. Várallyay G, Illényi A, Benyó Z. Automatic infant cry detection. In:
MAVEBA. 2009:11–14.
11.Manfredi C, Bocchi L, Orlandi S, et al. High-resolution cry analysis in
preterm newborn infants. Med Eng Phys. 2009;31:528–532.
12. Grau SM, Robb MP, Cacace AT. Acoustic correlates of inspiratory phonation
during infant cry. J Speech Hear Res. 1995;38:373–381.
13. Chu YY, Xiong WH, Shi WW, et al. The extraction of differential MFCC
based on EMD. In: Applied Mechanics and Materials. Trans Tech Publ.; 2013:1167–1170.
14. Tu B, Yu F. Speech emotion recognition based on improved MFCC with
EMD. Jisuanji Gongcheng yu Yingyong (Computer Engineering and
Applications). 2012;48:119–122.
15. Becerra MA, Orrego DA, Mejia C, et al. Stochastic analysis and classification
of 4-area cardiac auscultation signals using Empirical Mode Decomposition
cry sounds using Wavelet Packet based features. In: Electrical and Computer
Engineering (CCECE), 2015 IEEE 28th Canadian Conference. Halifax,
Canada: 2015.
23. Rabiner LR, Juang BH. Fundamentals of Speech Recognition. Englewood
Cliffs, NJ: PTR Prentice Hall; 1993.
24. Farooq O, Datta S. Mel filter-like admissible wavelet packet structure for
speech recognition. IEEE Signal Process Lett. 2001;8:196–198.
25. Farooq O, Datta S. Phoneme recognition using wavelet based features. Inf
Sci (Ny). 2003;150:5–15.
26. Farooq O, Datta S, Shrotriya MC. Wavelet sub-band based temporal features
for robust Hindi phoneme recognition. Int J Wavelets Multi Inf Process. 2010;8:847–859.
27. Sarikaya R, Pellom BL, Hansen JH. Wavelet packet transform features with
application to speaker identification. In: IEEE Nordic Signal Processing
Symposium. CiteSeerX; 1998:81–84.
28. Siafarikas M, Ganchev T, Fakotakis N. Wavelet packet based speaker
verification. In: ODYSSEY04-The Speaker and Language Recognition
Workshop. 2004.
29. Siafarikas M, Ganchev T, Fakotakis N. Wavelet packet bases for speaker
recognition. In: Tools with Artificial Intelligence, 2007. ICTAI 2007. 19th
IEEE International Conference on. 2007:514–517.
30. Gowdy JN, Tufekci Z. Mel-scaled discrete wavelet coefficients for speech
recognition. In: Acoustics, Speech, and Signal Processing, 2000. ICASSP‘00.
Proceedings. 2000 IEEE International Conference on. IEEE; 2000:1351–
1354.
31. Farhid M, Tinati MA. Robust voice conversion systems using MFDWC.
In: Telecommunications, 2008. IST 2008. International Symposium on. IEEE; 2008:778–781.
32. Bai J, Wang J, Zhang X. A parameters optimization method of v-support
vector machine and its application in speech recognition. J Comput. 2013;8:113–120.
33. Siafarikas M, Ganchev T, Fakotakis N. Objective wavelet packet features
for speaker verification. 2004.
34. Abdalla MI, Ali HS. 2010. Wavelet-based Mel-frequency cepstral coefficients
for speaker identification using hidden Markov models, arXiv preprint arXiv:1003.5627.
35. Reynolds D, Rose RC. Robust text-independent speaker identification using
Gaussian mixture speaker models. Speech Audio Process IEEE Trans. 1995;3:72–83.
36. Gales M, Young S. The application of hidden Markov models in speech
recognition. Found Trends Signal Process. 2008;1:195–304.
37. Juang BH, Rabiner LR. Hidden Markov models for speech recognition.
Technometrics. 1991;33:251–272.
38. Abou-Abbas L, Montazeri L, Gargour C, et al. On the use of EMD for
automatic newborn cry segmentation. In: 2015 International Conference on