UNIVERSITÉ DU QUÉBEC EN ABITIBI-TÉMISCAMINGUE
DISTINCTION DES TYPES DE PESSIÈRES À L’AIDE DE MARQUEURS POLLINIQUES POUR LA RECONSTRUCTION HOLOCENE DE LA DENSITE
ARBORESCENTE DE LA FORET BOREALE NORD-AMÉRICAINE
MÉMOIRE PRÉSENTÉ
COMME EXIGENCE PARTIELLE À LA MAÎTRISE EN ÉCOLOGIE
PAR
EVRARD KOUADIO
Mise en garde
La bibliothèque du Cégep de l’Abitibi-Témiscamingue et de l’Université du Québec en Abitibi-Témiscamingue (UQAT) a obtenu l’autorisation de l’auteur de ce document afin de diffuser, dans un but non lucratif, une copie de son œuvre dans Depositum, site d’archives numériques, gratuit et accessible à tous. L’auteur conserve néanmoins ses droits de propriété intellectuelle, dont son droit d’auteur, sur cette œuvre. Il est donc interdit de reproduire ou de publier en totalité ou en partie ce document sans l’autorisation de l’auteur.
Warning
The library of the Cégep de l’Abitibi-Témiscamingue and the Université du Québec en Abitibi-Témiscamingue (UQAT) obtained the permission of the author to use a copy of this document for nonprofit purposes in order to put it in the open archives Depositum, which is free and accessible to all. The author retains ownership of the copyright on this document. Neither the whole document, nor substantial extracts from it, may be printed or otherwise reproduced without the author's permission.
REMERCIEMENTS
La réalisation de ce projet n’a pas du tout été un long fleuve tranquille. Je tiens à remercier en premier lieu mes directeurs de maîtrise, Yves Bergeron et Olivier Blarquez, qui m’ont permis d’aller au terme de ce projet. Malgré mes lacunes, tant au niveau du savoir-faire que du savoir-être, vous m’avez toujours soutenu. Je vous en suis reconnaissant. Je tiens également à remercier toutes personnes qui m’ont aidé durant la réalisation de ce projet : Adam Ali, Christelle Hély, Raynald Julien, Dave Gervais, Carole Bastianelli. Je remercie particulièrement les membres des laboratoires de paléoécologie et de biogéographie de l’Université de Montréal (UdeM) pour toutes les discussions enrichissantes qu’on a pu avoir. Julie Talbot, Julie Aleman, Jordan Paillard, Andy Hennebelle, Julien Arsenault, Augustin Feussum-Tcheumeleu et Philippe Major, merci d’exister. Je remercie également les organismes qui ont été impliqués dans la réalisation de ce projet. Je remercie le conseil de recherches en sciences naturelles en génie du Canada (CRSNG), MITACS, l’Université du Québec en Abitibi-Témiscamingue, l’UdeM, L’Université du Québec à Montréal et le Centre d’étude de la forêt (CEF) qui m’ont permis de mener à bien ce projet. Enfin, je remercie tous ceux qui de près ou de loin m’ont permis d’achever ce programme de maîtrise.
AVANT-PROPOS
Ce mémoire de maîtrise comprend trois chapitres. Le chapitre 1 qui correspond à l’introduction générale, présente une mise en contexte de l’étude, les objectifs et les hypothèses. Le chapitre II correspond à l’ensemble de la recherche réalisée, présentée sous la forme d’un article scientifique (en cours de soumission). Enfin, la conclusion générale correspondant au troisième chapitre, présente les implications de l’étude.
TABLE DES MATIERES
AVANT-PROPOS ... iii
LISTE DES FIGURES ... vi
LISTE DES TABLEAUX ... vii
RÉSUMÉ ... viii
CHAPITRE I INTRODUCTION GÉNÉRALE... 1
1.1 Mise en contexte et problématique ... 1
1.2 Cas de la forêt boréale nord-américaine ... 3
1.3 Intérêt de l’approche paléoécologique... 5
1.4 Hypothèses et objectifs d’étude ... 6
CHAPITRE II DISTINGUISHING SPRUCE FOREST CLASSES BY NUMERICAL AND POLLEN ADUNDANCE ANALYSIS FOR EASTERN NORTH AMERICAN BOREAL FOREST TREE COVER RECONSTRUCTION .. 8
2.1 Abstract ... 9
2.2 Résumé ... 11
2.3 Introduction ... 13
2.4 Materials and methods ... 16
2.4.1 Modern pollen selection in study zone ... 16
2.4.2 Modern pollen site: vegetation classes and vegetation groups definition based on tree cover structural classes ... 16
2.4.3 Modern pollen site: pollen taxa that distinguish the two groups of vegetation ... 19
2.4.4 Fossil pollen series classification for TC reconstruction ... 20
2.4.5 Wavelet transform analysis for underlining past TC change ... 21
2.5 Results ... 21
2.5.1 Vegetation classes and vegetation groups ... 21
2.5.2 Indicator pollen taxa of modern sites ... 22
2.5.3 Vegetation structure and stability evolution during Holocene ... 26
2.6 Discussion ... 30
2.6.1 Tree cover density during Holocene ... 30
2.6.2 Resilience mapping and stable state mechanism hypothesis... 33
2.7 Conclusion ... 34
2.8 Appendices ... 36
CHAPITRE III CONCLUSION GÉNÉRALE ... 52
3.1 Implication pour la résilience et la résistance des écosystèmes forestiers 52
3.2 Implication pour l’aménagement et la recherche forestière ... 54
3.3 Implications méthodologiques ... 55
LISTE DES FIGURES
Figure Page
2.1 Study area ... 18
2.2 LDA plots ... 24
2.3 Discriminant score variation for CF region. ... 28
2.4 Discriminant score variation for LW region ... 29
A2.6 Synthesis of steps of the methods used for tree reconstruction... 44
A2.7 Study area and the names of the sites ... 45
A2.8 Discriminant score median per millenium ... 46
A2.9 Posterior probability variation over the last 8000 years around for 24 sites. .. 47
A2.10 Pollen diagrams throughout the last 8000 years... 48
LISTE DES TABLEAUX
Table Page
2.1 Indicator pollen taxa of vegetation groups using phi-coefficient... 25 A2.1 Selected pollen series from modern pollen data of north america (see .xls
document). ... 36 A2.2 Main features of the paleosites with associated publications. ... 36 A2.3 List of pollen taxa used for classification and reconstruction ... 40 A2.4 Vegetation classes underlined in literature for north american boreal zone. .. 42 A2.5 Error rate depending on the choice for predefined group. ... 43
RÉSUMÉ
Les forêts boréales jouent un rôle essentiel pour les différents services qu’elles confèrent. Il est bien établi que les changements climatiques conduiront à une augmentation du régime des perturbations. Bien que les forêts soient bien adaptées aux perturbations naturelles, la vitesse des changements en cours amplifie les incertitudes quant au devenir des forêts boréales. La mise en place de méthodes de gestion et de conservation adaptées nécessite une bonne compréhension des dynamiques forestières, notamment à des échelles temporelles longues (100 à 1000 ans). Dans la zone boréale nord-américaine, les reconstructions polliniques sont marquées par la présence de l’épinette noire qui représente à la fois l’arbre dominant et un gros producteur de pollen à la fois dans la zone de la forêt fermée et dans la toundra. L’objectif de cette étude a été de reconstruire à partir d’outils statistiques appliqués à l’analyse pollinique, la densité arborescente dans la zone boréale afin de distinguer les principales classes de végétation dans ce biome. 203 séries polliniques modernes ont été sélectionnées couvrant la zone boréale. La densité arborescente a été définie autour des sites polliniques modernes. Les sites modernes ont été regroupés en fonction de la classe de densité de végétation majoritaire autour du site. L’analyse discriminante linéaire (LDA) réalisée à partir des séries modernes d’abondance polliniques a permis de mettre en évidence la relation entre les classes de végétation et les assemblages polliniques. Nous avons ensuite appliqué ce modèle à des séries polliniques fossiles afin de reconstruire la classe de végétation dominante au cours du temps. Cette étude a montré que la structure de la végétation n’a pas été la même à l’échelle de la zone boréale. La densité arborescente a été relativement stable durant les derniers 6000 ans, excepté dans la partie est du Québec Labrador où des pertes de densité significatives ont été mises en évidences. L’ouverture de ces végétations serait liée à une perte de résilience de la végétation durant le néoglaciare plus froid et associée à des changements dans la dynamique des perturbations notamment les paléo-incendies. L’héritage historique associé aux nouvelles conditions environnementales sont susceptibles d’altérer davantage la résilience et la résistance des peuplements forestiers dans la zone de transition entre forêts fermées et toundra. Cette étude confirme la nécessité de garder cette zone en dehors du territoire des forêts aménagées.
Mots clés : changement climatique, reconstruction pollinique, densité arborescente, perturbation, forêts boréales, résilience, résistance, paléo-incendies, paléoécologie.
CHAPITRE I
INTRODUCTION GÉNÉRALE
1.1 Mise en contexte et problématique
Les écosystèmes forestiers boréaux renferment environ 20 % du stock de carbone planétaire (Pan et al., 2011), ce qui leur confère un rôle important dans la régulation climatique et les grands cycles biogéochimiques. En plus de cela, ces forêts représentent également un capital économique (produits forestiers ligneux et non ligneux) et culturel majeur par le biais des nombreux services qu’elles fournissent (Brandt et al., 2013). La dynamique spatio-temporelle des végétations boréales est le résultat de l’interaction entre différents facteurs tels que le climat, les perturbations, les paramètres physiques du milieu (topographie, dépôts de surface, types de sols, l’humidité), les caractéristiques biologiques des espèces végétales, les relations au sein de la communauté végétale, les facteurs historico-géologiques (Girard et al., 2008; Grondin et al., 2015). Le climat a une influence directe et indirecte sur le régime (sévérité, taille, occurrence, fréquence) des perturbations (Pureswaran et al., 2015; Turetsky et al., 2011; Balshi et al., 2009; Romps et al., 2014; Pickett et White, 1985). Les perturbations jouent un rôle essentiel en influençant, en fonction des caractéristiques de leur régime, la composition spécifique, l’âge, la structure, la productivité et la biodiversité de la forêt (Weber et Flannigan, 1997). L’hétérogénéité des paramètres environnementaux à l’échelle locale tels que les paramètres édaphiques, la composition et la structure de la végétation, en interaction avec le climat (effet « bottom up »), favorisent également une hétérogénéité du régime des perturbations
(Hély et al., 2001; Belisle et al., 2016; Mansuy et al., 2010). Plusieurs études ont montré que les écosystèmes boréaux étaient relativement bien adaptés aux changements climatiques et aux variations des régimes de perturbation passés depuis les dernières glaciations (Carcaillet et al., 2001; Ali et al., 2012; Williams, 2002; Richard, 1995). Cependant, dans le contexte d’augmentation rapide de la concentration atmosphérique en gaz à effet de serre, il est prévu un changement de la dynamique climatique avec en particulier une augmentation de la température et des évènements extrêmes (cyclones, sécheresse) (IPCC, 2014). Tous les scénarios du GIEC suggèrent une augmentation de la température (IPCC, 2014). En plus, cette augmentation devrait être maximale au sein du biome boréal comparativement aux autres biomes forestiers au cours du 21e siècle (IPCC, 2014). Bien que l’enrichissement en CO2 puisse favoriser une augmentation de la productivité, cet effet pourrait être contrebalancé par les stress hydriques et la disponibilité en nutriments (Girardin et al., 2016). Le réchauffement du climat est, pour ces raisons, susceptible de réduire la productivité à la fois par l’augmentation des perturbations, mais aussi par la baisse de la disponibilité en eau et en nutriments (Houle et al., 2016; Shuman et al., 2017). L’élévation de la température atmosphérique, si elle n’est pas compensée par les précipitations, pourrait entrainer une augmentation des fréquences de feux à l’échelle circumboréale (Dale et al., 2001; Haughian et al., 2012; Wotton et al., 2010). Le réchauffement pourrait également favoriser des épidémies d’insectes plus virulentes du fait d’une capacité d’adaptation plus importante de ceux-ci par rapport à leurs hôtes végétaux (Soja et al., 2007; Aitken et al., 2008; Pureswaran et al., 2015). Par exemple, la tordeuse des bourgeons de l’épinette pourrait notamment synchroniser son émergence sur le débourrage de l’épinette noire et ainsi accroitre son emprise spatiale et ses dégâts vers le Nord de la forêt boréale (Pureswaran et al., 2015; Navarro et al., 2018). Le caractère potentiellement inédit de ces changements de même que leurs impacts potentiels conduit à se questionner quant à la réponse des écosystèmes boréaux dans le futur (Terrier et al., 2014). Ainsi, la définition des trajectoires futures des végétations boréales nécessite d’avoir une meilleure
compréhension du fonctionnement de ces écosystèmes et de leurs réponses face aux variations climatiques passées.
1.2 Cas de la forêt boréale nord-américaine
La forêt boréale nord-américaine peut être subdivisée en 2 zones qui se distinguent par des types de végétation dominants (Payette et Delwaide, 2018). L’espèce arborescente majoritaire est l’épinette noire (Picea mariana [Mill.] BSP) en association avec d’autres espèces arborescentes dont les principaux genres sont Abies, Larix, Picea,
Pinus (pour les espèces conifériennes), Populus et Betula (pour les espèces feuillues)
(Brandt, 2009). Les deux principaux types de végétation sont repartis selon un gradient latitudinal. Au Nord, les végétations sont plus ouvertes avec un sol couvert de lichens (principalement du genre Cladonia). Ces pessières à lichens seraient le résultat d’un défaut de régénération des semis d’épinettes noires après perturbation (feux ou épidémies de tordeuse de bourgeon de l’épinette), principalement liée au climat plus froid au Nord (Payette, 1992). Ce défaut de régénération serait par ailleurs amplifié par le tapis de lichens. En effet, celui-ci agirait non seulement comme une barrière physique à l’établissement des graines d’épinettes noires (Mallik et Kayes, 2018; Morneau et Payette, 1989; Pacé et al., 2019), mais aussi comme une barrière chimique par la sécrétion de substances allélopathiques qui pourraient également inhiber la germination et la croissance des semis d’épinettes noires (Mallik et Kayes, 2018; Wallstedt et al., 2002). Au Sud, dans la zone de la forêt fermée composée majoritairement de la pessière à mousses, les peuplements d’épinettes noires, à la faveur d’un climat relativement moins froid et donc d’une meilleure régénération après perturbations, sont plus denses et plus diversifiées avec un sol souvent couvert par un tapis continu de mousses et/ou de sphaignes (Fenton et al., 2005; Lecomte et al, 2006; Payette et al., 2001). Cependant, la perte de densité arborescente dans la forêt fermée,
caractérisée par une augmentation de la proportion des parcelles de pessières à lichens a été constatée ces dernières décennies (Girard et al., 2008; Côte et al., 2013). Ce phénomène qui aurait débuté durant l’Holocène (Payette, 1992) serait lié à un changement dans le régime des perturbations, principalement les feux et/ou en association avec d’autres perturbations telles que des épidémies de tordeuse des bourgeons de l’épinette (TBE), des épisodes climatiques sévères (épisodes froids essentiellement) et, plus récemment, les activités forestières (Girard et al., 2008; Payette et al., 2001; Sirois et al., 1999). Les deux types de végétations ne correspondraient pas à des stades transitoires de succession (Jasinski et Payette, 2005). Les pessières à lichens et les pessières à mousses seraient plutôt des états stables alternatifs, car pour des conditions environnementales similaires elles sont susceptibles de coexister et de se maintenir (Asselin et al., 2006; Scheffer et al., 2001). La résilience des états alternatifs, c’est-à-dire leur capacité à revenir à l’état d’origine (« état stable ») après une perturbation, varie en fonction des conditions environnementales (Scheffer et al., 2001). Compte tenu des projections qui prévoient une augmentation du régime des feux, on pourrait assister à une progression de la proportion des pessières à lichens (Flannigan et al., 2016). Dans le contexte des changements en cours du climat et de la dynamique des perturbations, la question de la stabilité et de la résilience des pessières se pose. Comment la stabilité de ces écosystèmes a-t-elle évolué dans le temps ? Comment leur résilience en a-t-elle été affectée au cours du temps ? Sur quelles échelles spatio-temporelles les transitions entre ces types de pessières s’effectuent-elles ? Ces transformations sont-s’effectuent-elles gradus’effectuent-elles ou existe-t-il des points de bascule (points de changement brutal) ?
1.3 Intérêt de l’approche paléoécologique
Affiner la connaissance des processus associés aux dynamiques de ces végétations permettrait de mieux définir leurs trajectoires face aux différents scénarios associés aux changements climatiques en cours. Or, ces dynamiques se mettent en place sur des échelles temporelles pluriséculaires, voire plurimillénaires. Une bonne compréhension de ces phénomènes nécessite donc que des reconstructions soient réalisées à des échelles temporelles correspondantes. Dans ce contexte, la paléoécologie, à partir de l’étude d’indicateurs fossilisés dans les dépôts sédimentaires (lacustres, tourbeux) constitue un moyen efficace pour mettre en évidence ces dynamiques sur ces longues échelles temporelles et ainsi permettre de comprendre comment ces écosystèmes ont réagi dans le passé à des perturbations (Bergeron et al., 1999; Schoonmaker et Foster, 1991). Les micro-restes (essentiellement pollens et spores) constituent la principale source utilisée pour les études concernant la reconstruction de la végétation (Seppa et al., 2009). Certaines avancées majeures, concernant entre autres la détermination des échelles spatiales de la source pollinique ainsi que la reconstitution de la biomasse et du paysage à partir des pollens fossiles, sont notables dans ce domaine, surtout en Europe (Gaillard et al., 2010; Kaplan et al., 2009; Sugita et al., 2007a; Sugita et al., 2007b) mais également en Amérique du Nord (Blarquez et Aleman, 2015; Gajewski, 1991; Garralla et Gajewski, 1992). Les modèles utilisés pour la reconstruction de la végétation sont basés majoritairement sur le principe de la technique des analogues modernes (MAT). Cette technique permet de quantifier la ressemblance entre assemblages polliniques modernes et fossiles. La biomasse ou la densité arborescente de la végétation passée est alors estimée en fonction des variables de couverture forestière modernes des meilleurs analogues (Blarquez et Aleman, 2015). Cependant, la difficulté majeure pour les reconstitutions polliniques au Canada, qui est exacerbée dans la zone boréale coniférienne, réside dans le fait que les écosystèmes sont dominés principalement par une seule espèce, l’épinette noire, rendant difficile la distinction
entre les deux types de pessières au niveau de l’archive pollinique contenue dans les sédiments lacustres. Pourtant, sans cette distinction, la reconstitution et l’interprétation de la dynamique de la végétation et des paysages dans la zone boréale à l’échelle du Canada restera limitée. D’où la nécessité d’améliorer la calibration des outils/proxies utilisés pour les reconstitutions de sorte à mieux prendre en compte les changements de structure de la végétation (par exemple milieux ouverts versus milieux fermés).
1.4 Hypothèses et objectifs d’étude
L’objectif de mon étude consiste à reconstruire l’histoire de la structure de la végétation de la forêt boréale nord-américaine. Cette reconstruction nécessite la mise en évidence, au niveau des archives fossiles des seuils caractéristiques permettant de faire la distinction entre les pessières à lichens et les forêts fermées comme les pessières à mousses. L’établissement de ces seuils nécessite de comprendre à quoi correspondent les configurations spatiales actuelles de ces deux types de pessière en termes de quantité de micro-restes dans l’archive sédimentaire. Le fait que ces deux types de matrice de végétation soient largement dominées par une seule espèce arborescente (l’épinette noire) implique que leur production pollinique soit a priori assez semblable (Richard, 1995). Cela dit, dans la mesure où les milieux fermés de pessières à mousses ont une densité plus importante d’épinettes que les milieux ouverts de pessières à lichens (Payette, 1992), nous formulons l’hypothèse (hypothèse 1) que les grains de pollen de taxons arborescents sont caractéristiques de la pessière à mousse, à bassin versant équivalent. Par ailleurs, les cortèges floristiques des deux types de pessières étant relativement différents, notre hypothèse (hypothèse 2) est que les quantités de micro-restes (pollen et spores) devraient refléter l'environnement autour du lac et dans la région d’étude.
Pour tester ces hypothèses, la relation entre les abondances polliniques (issus la base de données polliniques modernes nord-américaine) et la densité arborescente (estimée autour des lacs via des analyses de télédétection) a été analysée. Par la suite, sur la base de cette analyse (calibration), la densité arborescente a été reconstruite autour de différents sites pour lesquels on disposait de séries de pollen fossiles qui couvrent l’Holocène.
En plus de l’introduction générale, le présent mémoire est composé d’un article (Distinguishing spruce forest classes by numerical and pollen abundance analysis for
North American boreal forest tree cover reconstruction) en cours de soumission et
CHAPITRE II
DISTINGUISHING SPRUCE FOREST CLASSES BY NUMERICAL AND POLLEN ABUNDANCE ANALYSIS FOR EASTERN NORTH AMERICAN
BOREAL FOREST TREE COVER RECONSTRUCTION
Ce chapitre a été rédigé en anglais sous la forme d’un article scientifique afin d’être soumis à la revue Open Quaternary.
Evrard Kouadio1, Yves Bergeron1, Olivier Blarquez2
1. Université du Québec en Abitibi-Témiscamingue, Institut de recherche sur les forêts
2.1 Abstract
The increase in lichens woodland (LW) low tree density stands in the close crown forest area highlighted during the last decades could become more important in a global warming context. A better understanding of the driving ecological processes of this opening requires vegetation reconstructions spanning the corresponding long spatio-temporal scales. In this study we explored a new approach to reconstruct boreal forest tree cover during the Holocene in the North American boreal zone. We selected 203 moderns pollen records spanning the last 8000 years in the Canadian boreal zone. Tree cover distribution was analysed to underline dominant vegetations classes in this domain. Modern pollen records were split into two groups: closed crown forest site (CF, sites mainly surrounding at landscape scale by closed crown forest vegetation class) and spruce lichens site (LW, sites mainly surrounding at landscape scale by open vegetation class) by analysing the dominant vegetation class the 30 km around each site. We used a classification method, the Linear Discriminant Analysis (LDA) to underline specie that best discriminates the two groups. This model was applied on 24 fossil pollen series to reconstruct vegetation structure for the last 8000 years and along an east-west gradient of around 3000 km along CF-LW ecotone. Tree pollen taxa were positively and negatively correlated to CF and LW classes, respectively. Modern pollen series corresponding to CF and LW classes were separated significantly by LDA cross validation with an error rate of 15 %. Holocene Base on this model, TC reconstruction was realized in the study zone. TC reconstruction obtained with discriminant analysis showed boreal TC remained relatively stable during the last 6000 years in the boreal zone excepted for the north-eastern part of Quebec Labrador. In this region, TC reconstruction suggested that from 6000 BP to 5000, the CF domain expanded further north than its current limit. Shift from CF to LW were underlined particularly since 2000 BP. Forest opening would have been related to change in fire dynamic and
edaphic condition associated to a loss of resilience inherited since the beginning of neoglacial period (since ~ 4000 BP). The innovative methodological approach used in this study performed well at reconstructing forest structure large spatio-temporal scales. It allowed as to associate more accurately vegetation type with pollen data at the landscape scale. It provides a basis to highlight the regional variability of the vegetation response face to climate and disturbances changes. Despite the relative vegetation stability of the boreal biome, this study suggests that in the context of global warming and increased disturbances, could lead to catastrophic loss of tree cover particularly in the east part of the boreal zone. This study provides a new insight in TC reconstruction in the boreal zone.
2.2 Résumé
L'augmentation des peuplements à faible densité d'arbres des landes à lichens (LW) dans la zone de la forêt fermée (CF), mise en évidence au cours des dernières décennies pourrait devenir plus importante dans le contexte de réchauffement climatique. Une meilleure compréhension des processus écologiques moteurs de cette ouverture nécessite des reconstructions de la végétation couvrant les longues échelles spatio-temporelles correspondantes. Dans cette étude, nous avons exploré une nouvelle approche pour reconstruire le couvert forestier boréal pendant l'Holocène dans la zone boréale nord-américaine. Nous avons sélectionné 203 enregistrements de pollen modernes couvrant les 8 000 dernières années dans la zone boréale. La distribution de la densité arborescente a été analysée pour mettre en évidence les classes de végétation dominantes dans ce domaine. Les relevés polliniques modernes ont été divisés en deux groupes: sites de la foret fermée (CF, sites principalement entourés à l'échelle du paysage par des classes de végétation forestière fermée) et site de landes à lichens (LW, sites principalement entourés à l'échelle du paysage par des classes de végétation ouvertes) par l’analyse de la classe de végétation dominante dans un rayon de 30 km autour de chaque site. Nous avons utilisé une méthode de classification, l'Analyse Discriminante Linéaire (LDA) pour mettre en évidence les espèces qui discriminent le mieux les deux groupes. Ce modèle a été appliqué sur 24 séries de pollens fossiles pour reconstruire la structure de la végétation des 8 000 dernières années le long d'un gradient Est-Ouest d'environ 3 000 km le long de l'écotone CF-LW. Les taxons de pollen d'arbres étaient corrélés positivement et négativement respectivement pour les classes CF et LW. Les séries de pollen modernes correspondant aux classes CF et LW ont été séparées de manière significative par validation croisée LDA avec un taux d'erreur de 15%. Sur la base de ce modèle, la reconstruction Holocène de la densité arborescente a été réalisée dans la zone d'étude. La reconstruction de la densité
arborescente obtenue avec une analyse discriminante a montré que la structure de la forêt boréale est restée relativement stable au cours des 6000 dernières années dans la zone boréale à l'exception du Nord-Est du Québec et du Labrador. Dans cette région, la reconstruction de TC a suggéré que de 6000 BP à 5000, le domaine CF s'est étendu plus au Nord que sa limite actuelle. Le passage de CF à LW a été souligné en particulier depuis 2000 BP. L'ouverture de la forêt aurait été liée à un changement de la dynamique du feu et des conditions édaphiques associé à une perte de résilience héritée depuis le début de la période néoglaciaire (depuis 4000 BP). L'approche méthodologique innovante utilisée dans cette étude a bien fonctionné pour reconstruire la structure forestière à de grandes échelles spatio-temporelles. Cela a permis d'associer plus précisément à l'échelle du paysage, le type de végétation avec les données polliniques. Il fournit une base pour mettre en évidence la variabilité régionale de la réponse de la végétation face aux changements climatiques et aux perturbations. Malgré la relative stabilité de la végétation du biome boréal, cette étude suggère que, dans le contexte du réchauffement climatique et de l'augmentation des perturbations, pourrait entraîner une perte catastrophique du couvert arboré, en particulier dans la partie Est de la zone boréale. Cette étude fournit un nouvel aperçu de la reconstruction de la densité arborescente dans la zone boréale.
2.3 Introduction
Since forest recolonization after the last ice age, boreal forest tree species have been largely well adapted to natural disturbance regimes. Regeneration of these stands after disturbance to a similar stand is only possible under certain conditions. If the time interval between two disturbances (fire only or fire associated with a clear-cut, an insect epidemic or unfavorable climatic conditions) is too short, the tree does not have time to reach sexual maturity, which hinders optimal seed production. (Côte et al., 2013; Fryer, 2014; Gamache and Payette, 2005; Meunier et al., 2005; Youngblood and Safford, 2008). When the disturbances, particularly fire, are too severe, it reduces the vigor of the plant, which influence vegetative reproduction (Veilleux-Nolin et Payette, 2012). In contrary, when low severity fire, increase soil organic mater depth and then reduce regeneration (Simard et al., 2007). In addition, disturbances can have indirect effects on the regeneration of stands by acting on edaphic parameters and on climate. However, boreal zone climate projections predict an increase in fire regime (Flannigan et al., 2016). The anticipated drier conditions in the context of global warming could lead to an increase in forest opening (Girard et al., 2008). In Canadian boreal forest, representing 10% of the world's forest cover (FAO, 2012), forest opening is characterized by an increase in the proportion of lichen woodlands (LW) in closed crown forest (CF) zone. CF are mainly composed by spruce-moss (SM) stands and other tree genus (such as Abies, Pinus, Populus, Betula) stands (Brandt, 2009). Spruce moss stands are characterized by closed crown area of black spruce (Picea mariana (Mill.) BSP) with a ground layer dominated by feather mosses (Pleurozium schreberi (Willd. ex Brid.) Mitt. and others), and sphagnum (Sphagnum spp.), while LW are low density stands, also mainly composed of black spruce stands as the dominant tree with ground cover dominated by lichens, mostly Cladonia spp. LW proportion increase would have started since the Holocene (Payette, 1992) and would be related to shift in
disturbance regime, mainly fire and/or combined with other disturbances (Jasinski and Payette, 2005; Ali et al., 2012). Future spruce-lichens stands increase could be expected in closed crown forest (Girard et al., 2008; Côté et al., 2013). Understanding the ecological processes associated with this opening is essential to better forecast vegetation response to ongoing change. These ecological processes take place on long temporal scales and as such vegetation reconstruction should be ideally analysed on equally long temporal scales. Paleoecological study through use of fossil plant remains such as pollen and spore provide a valuable insight in vegetation reconstruction (Novenko et al., 2014; Richard et al., 2020). These reconstructions are mainly based on modern analog technique (MAT) which is characterised by the comparison between modern and fossil micro-remain spectra (Overpeck and Webb, 1985). Prior to this reconstruction, it is necessary to understand the relationship between the modern vegetation and the representation of modern micro-remains (pollen and spores) from surface modern lacustrine sediments. For this step classification methods are used to linked modern pollen abundance to actual vegetation type, in terms of composition, biomass and/or TC (Blarquez and Aleman, 2016; Frechette et al., 2018; Williams, 2002; Tarasov et al, 2007). Past vegetation type is then defined based on modern vegetation cover variables of the best analogues (Williams, 2002). However, pollen-based reconstruction can be a challenge in North American boreal zone. The complexity is this zone is related to the large dominance of a single tree pollen species, the black spruce, largely dominating the pollen both CF and LW zones. So, pollen taxa dominance should be in principle quite similar between the two zones (Williams, 2002). In view of the low TC of open LW habitats compared to CF habitats (Payette, 1992), we hypothesize that for an equivalent pollen abundance recording area, arboreal pollen should be more representative of CF than LW (hypothesis 1). We also hypothesize that for an equivalent pollen recording area, the difference in tree cover could influence environmental conditions (light and nutrients availability) and therefore, species community of these vegetations classes. Based on this potential
difference in terms of tree cover of these vegetations, our second hypothesis is that the quantities of micro-remains abundance should reflect the environment around the lake.
Few studies have made it possible to distinguish between CF and LW at the level of pollen assemblages (Gajewski, 1991; Frechette et al., 2018). Even when this distinction is made, the characterization of assemblages relies on the bioclimatic domains in which each modern pollen site is found. These large ecological units are implicitly considered homogeneous from the point of view of biophysical characteristics (climatic, pedological, geological and floristic). However, some studies have shown that these units were relatively more spatially heterogeneous both in terms of vegetation trajectories and in terms of disturbances dynamics (Boulanger et al., 2014; Hennebelle et al., 2018). Therefore, distinguishing pollen assemblages based on these large units can potentially lead to spatially inaccurate vegetation reconstruction.
The aim of this study is to reconstruct Tree cover (TC) change during the Holocene in the North American boreal zone. In contrary, to prior vegetation type characterization that assume an implicit homogeneity in predefined bioclimatic zone, vegetation type classification around modern pollen sites was made from the TC based on a distance corresponding to the maximum pollen dispersal of the main boreal tree species (Blarquez and Aleman, 2016). We used the relation underlined between modern pollen and vegetation classes as basis for Holocene TC reconstruction.
2.4 Materials and methods
2.4.1 Modern pollen selection in study zone
Pollen sites were selected withing the boreal (zone Figure 2.1) defined by Brandt (2009). Pollen site in the same ecoregion allow us to reduce biases linked to climate parameter that could influenced pollen abundance (Sugita et al., 2007a; Sugita et al., 2007b). For highlight the relationship between pollen abundance and tree cover, several criteria were used to select modern pollen series sites from the modern pollen dataset of North America (Appendix A2.1) (Whitmore et al., 2005). To ensure relative homogenous environmental condition, species communities and ecological processes site selection was limited only in North America’s boreal zone (Brandt, 2009) between 48°- 58° North and 55-100° West. We focus on this zone because some taxa could be replaced by non-equivalents in the western boreal zone. For example, Abies pollen, west of 100°W, could possibly represent Abies grandis or A. lasiocarpa but only A.
balsamea in the east and this distinction is not recorded in the modern pollen dataset
nor easy to perform by looking at pollen anatomy (Blarquez and Aleman, 2016). Consequently, we focused on sites on the east of i.e 100°W of the North America’s boreal zone to keep the same pollen pool taxa (Blarquez and Aleman, 2016). Only lacustrine sites were selected to limit taphonomic bias (Blarquez and Aleman, 2016).
2.4.2 Modern pollen site: vegetation classes and vegetation groups definition based on tree cover structural classes
After selection, sites were characterized to be classified depending on their main vegetation class. Prior to site classification, we define tree cover (TC) structural classes
in the study zone. In our study area, mixture model was fitted on the TC frequency distribution data from Landsat-based 30-m resolution tree canopy cover map (Sexton et al., 2013) to estimate the number of modes (Aleman et al., 2017). For fitting mixture model, we use the “normalmixEM” function in the package “mixtools” (Benaglia et al., 2009). Vegetation classes, corresponding to the three colors represented in figure 2.1 (DL, SL, CF), were defined based on these modes (Aleman et al., 2017). Then, TC frequency distribution data (Sexton et al., 2013) was used to calculated TC values (in percentage) around each modern pollen site (Figure 2.1), for a buffer zone of 30 km (Seppa et al., 2009). Medians TC were used to evaluate the vegetation group (LW, CF) for each modern pollen site. The size of buffer correspond to the maximum distance beyond which pollen dispersion is not significant for the main arboreal pollen taxa of the study area (Bradshaw and Webb, 1985; Webb et al., 1981; Blarquez and Aleman, 2016). The large radius of the buffer zone allowed us to the reduce bias associated to the time gap between TC estimation period (by vegetation remote sensing) and modern pollen sampling (difference > 50 years). Pixel value corresponding to water on TC map were removed by using hydrographic maps (Aleman et al., 2017).
Figure 2.1 Study area
a) Map adapted from Payette and Delwaide (2018), representing Lichen woodland (LW in light grey) and closed-crown forest (CF in dark grey). b) LW and CF zones are colored depending on tree cover (TC) structural classes. Fossil pollen sites in with a modern TC corresponding to the current LW zone are colored in blue. Those corresponding to the northern part of the current CF zone are colored in green. c) TC structural classes and vegetation classes (colors). Density of pixels for continuous TC values binned in 5% classes and main vegetation classes (in pink, blue and green). Three classes have been selected: the more open one with TC <26%, also called dry barren area (in pink, DL), the less open one with TC values ranging from 26 to 65 % also called spruce lichen (SL) stands (in blue) and the closed-crown forests group (CF) identified with a TC greater than 65% (in green). These two first vegetation classes are forming the lichen woodland group (LW). The last vegetation class (CF) is mainly dominated, in its northern part by spruce moss stands (SM) in association with balsam fir and white birch stands.
2.4.3 Modern pollen site: pollen taxa that distinguish the two groups of vegetation
To distinguish species that best separate the two vegetation groups (LW and CF) defined previously, we used linear discriminant analysis (LDA). By maximising variance between groups and minimize variance within each group (Legendre and Legendre, 2012; Martinez and Kak, 2001), LDA is a useful tool to identify variables that best discriminate groups. Discriminant scores and posterior probabilities obtained for each group were used to cross validate or predict vegetation group of the 203 modern pollen sites (Braun et al., 2013; Legendre and Legendre, 2012). LDA was performed using R (R Core Team, 2017). Before the LDA, we standardized pollen percentage related data (standardization done relative to species) by using “deconstand” function of vegan package (Oksanen et al., 2010). This transformation reduces the asymmetry of pollen data distribution caused by high level pollen percentage, like Picea mariana (Borcard et al., 2018). We keep only most abundant (> 1%) pollen taxa. Artemisia, Ambrosia and Poaceae pollen taxa are related to area characterized by anthropisation and/or open vegetation (Garralla and Gajewski, 1992; Hicks and Birks, 1996). However, in our study area, anthropisation is more important in the south part where CF stands are the main vegetation class while open vegetation are the main class in the north part (Gauthier et al., 2015). These taxa were thus not useful to discriminate pollen taxa specific to LW and CF groups and where thus withdraw. Pinus banksiana was the dominant species representative of the genus Pinus in the modern pollen record. P. banksiana distribution is strongly affected by the east west precipitation gradient that controls the fire regime and thus main factor for explaining the taxa distribution (Asselin et al., 2003). This strong latitudinal distribution prevented us from including these taxa because our aim was to reconstruct vegetation classes that are mainly latitudinally distributed (Asselin et al., 2003). In total, 20 pollens taxa were (Appendix A2.3).
To determine the statistical significance of the relationship between the modern taxa identified previously and vegetation group (LW, CF), we used phi-coefficient of association index (Chytry et al, 2002; De Caceres and Legendre, 2009). Statistical significance is based on permutation tests of species site group associations and bootstrap methods for obtaining confidence intervals. Correlation measures are related to Pearson correlation computed using two binary vectors: a vector containing ‘‘1’’ for sites where the species is present and ‘‘0’’ for those where it is absent, and a vector with ‘‘1’’ for sites belonging to the group of interest and ‘‘0’’ for sites belonging to other groups (De Caceres et Legendre 2009). This analysis was applied on the same data set used previously (203 modern pollen sites) in LDA. Depending on their relative niche breadth, specie can be related to one or more groups of sites more importantly in similar environmental condition and vegetation class like in our study area (Tsiripidis et al., 2009). Compared to the classical methods of indicator species, the phi-coefficient of association is more suitable to distinguish group of sites considering specie occurrence (De Caceres and Legendre, 2009).
Here, phi-coefficient was used to show the statistical significance of the relationship between a set of pollen taxa and a given vegetation class. We completed the description of the pollen taxa underlined by the LDA model with the statistical significance and correlations measures provided by the phi-coefficient of association. We used “multipatt” function from “indicspecies” package (De Caceres et al., 2015) to determine indicator taxa.
2.4.4 Fossil pollen series classification for TC reconstruction
LDA model was realized on the data set containing modern pollen record (n=203) split by two predefined groups of vegetation (LW and CF). LDA define discriminants function for each group. These functions were used to train the model for group
membership prediction (Braun et al., 2013) for new additional samples (here fossil pollen series). For TC and group reconstructions, 24 fossil pollen series covering the study area were selected (See Appendix A2.7 and Appendix A2.2 for site location and a complete list and associated references). Each pollen series chosen recovered the last 8000 BP. Then, based on the training set, discriminant score and posterior probabilities of the fossil pollen series were determined. Past TC reconstruction was therefore performed by using fossil pollen post classification (Appendix A2.6).
2.4.5 Wavelet transform analysis for underlining past TC change
Wavelet transform was used for decomposing time series spectrum into a multi-resolution series to localize significant time-frequency change (Torrence and Compo, 1998). It is a useful statistical tool that can clear up spectral trend and consequently operating factor at various scale (Pal and Devara, 2012). We used this analysis on discriminant score for all fossil pollen series to underline amplitude and-frequency change in vegetation landscape dynamics during the Holocene. Wavelet transform spectrum of discriminant score and the raw value of discriminant score were paired to evaluate if changes in TC implied transition between the two groups of vegetation (LW, CF). Ecological pathway of vegetation dynamics particularly stability and resilience variation during Holocene were evaluated for all fossil pollen sites.
2.5 Results
2.5.1 Vegetation classes and vegetation groups
TC frequency distribution analysis underlined three modes. Thus, three classes were defined (Figure 2.1c). The lower TC structural class was characterised by TC ≤ 26%
correspond mainly to “dry barren” areas corresponding to more open lichen woodland (“dry barren lichen area”, DL). The middle class was characterised by 26% < TC ≤ 65% corresponding to lichen woodland mainly composed of spruce lichen stands (SL). The class with the highest TC was characterized by 65% < TC ≤ 100% and correspond to the CF domain, mainly composed, in the northern part, of spruce moss stands. Depending on these three vegetation classes (DL, SL, CF) and median of TC value around each lake (in a 0-30 km buffer zone), 203 modern pollen sites were classified (Table SI. 1). We underlined 42 dry barren (DL) and 69 spruce lichen (SL) sites forming a total of 111 modern pollen sites for the LW vegetation group and 92 in the CF group.
2.5.2 Indicator pollen taxa of modern sites
LDA analysis is mainly influenced by the criteria of predefine grouping (Borcard et al., 2018). Consequently, the accuracy of the TC reconstruction is mainly dependant on the classification based on TC pixel distribution. Tree cover frequency distribution analysis (structural classes) used as the basis of classification showed three vegetation classes (DL, SL, CF) and two vegetation groups (LW, CF). Relatively similar vegetation classes were underlined in other studies (Ducruc et al., 1976; Scheffer et al., 2012). The slight difference in vegetation class determination (Appendix A2.4) could be related to the difference in methods i.e. photo reconnaissance survey vs satellite remote sensing (Montesano et al., 2016), and satellite image resolution (30m in our study against 500m in Scheffer et al., 2012).
For defining specific pollen taxa to each vegetation group (LW, CF), we choose the LDA model with the lowest classification error rate (Appendix A2.5). This model considers, as first group, the grouping of DL and SL and, as second group CF. Error
rate obtained with cross validation of classification were 15 %. The low level of error rate associated to the relatively large size of training samples (n= 203) provided a significant evidence that vegetation classes pollen percentage relationship was well modelled. We successfully showed which indicator pollen taxa of LW and CF groups.
Alnus crispa, Cyperaceae and Ericaceae pollen taxa were representative of the LW
group while Abies balsamea, Chenopodiaceae/Amaranthaceae, Corylus, Fraxinus,
Larix, Populus, Quercus, Rumex, Tsuga, Salix, were significantly associated with the
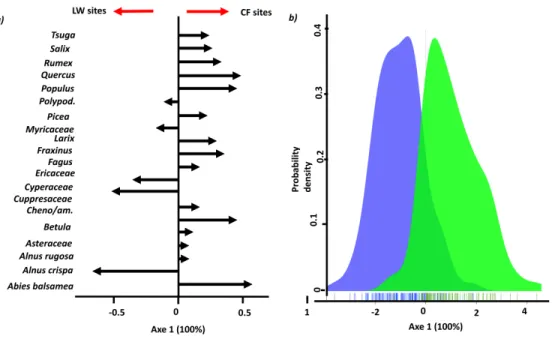
CF group (Table 2.1). Phi-coefficient of association analysis showed the same similar association between pollen taxa and vegetation group (Figure 2.2). Phi-coefficient of association analysis showed that 13 (on 20) pollen taxa were significantly associated with a specific vegetation group (10 for CF and 3 for LW). This method showed the same similar association between pollen taxa and vegetation classes (DL, SL, CF).
Figure 2.2 LDA Plots.
a) Plot of correlation. Arrows represent the original variables (taxon); longer arrows represent more discrimination. Arrows. Direction of arrows show relationship between site groups. b) plot of individuals. This plot of individuals makes it possible to identify how groups are structured (LW sites group in blue, CF sites group in green).
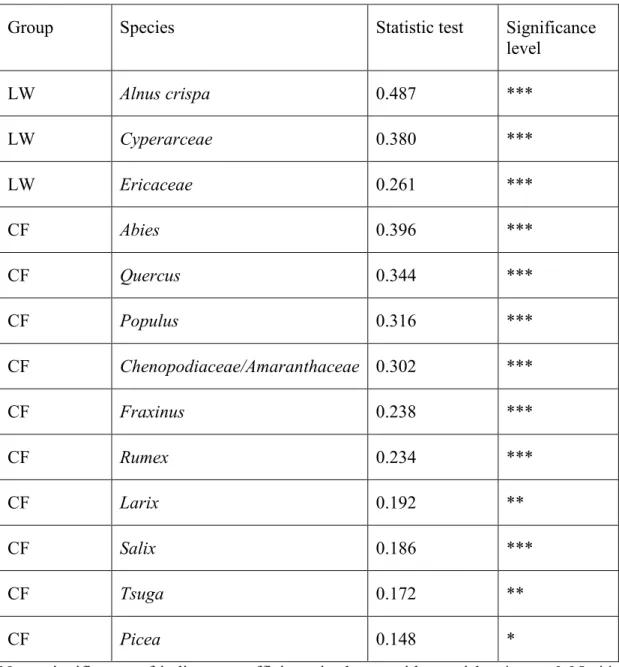
Table 2.1 Indicator pollen taxa of vegetation groups using phi-coefficient
Group Species Statistic test Significance
level LW Alnus crispa 0.487 *** LW Cyperarceae 0.380 *** LW Ericaceae 0.261 *** CF Abies 0.396 *** CF Quercus 0.344 *** CF Populus 0.316 *** CF Chenopodiaceae/Amaranthaceae 0.302 *** CF Fraxinus 0.238 *** CF Rumex 0.234 *** CF Larix 0.192 ** CF Salix 0.186 *** CF Tsuga 0.172 ** CF Picea 0.148 *
Note: significance of indicator coefficients is shown with asterisks: *, p < 0.05; **,
2.5.3 Vegetation structure and stability evolution during Holocene
Lacustrine site density in the study zone is low before 8000 BP. Thus, TC reconstruction were performed from 8000 BP until present. Between 8000 and 6000 BP, a strong cyclicity in vegetation change were underlined in the entire boreal zone with significant wavelet spectrum at periods below 500 years for several lakes (Figure 2.3 and Figure 2.4). Alnus crispa, Cyperaceae or Ericaceae pollen percentage were relatively important in this period (Appendix A2.10). However, CF class became more important or already predominant around lakes located currently in the CF zone. This increase of CF class is mainly associated to an increase in Picea pollen percentage and a decrease in Alnus crispa, Cyperaceae or Ericaceae pollen (Appendix A2.10). The increase in Picea pollen is preceded by in increase in Populus pollen at some lakes located at the actual CF zone (Schon, Geais, Pessiere, Twin, Aurelie) and around BER lake (Figure 2.3 and Figure 2.4 E) which is in the actual LW zone. For this lake, the increase in discriminant score was associated with a high increase in Populus pollen percentage and a significant decrease in Picea pollen percentage (Appendix A2.10 D).
From 6000 to 4000 BP, we observed a slight increase in CF class proportion in a landscape still dominated by open stands in the current LW zone (Figure 2.3 and Figure 2.4). However, during this period, the trend was different around Harrie, Gras and Riley lakes although these lakes are located currently in LW zone (Figure 2.3 and Figure 2.4). CF class, probably dominated by spruce moss stands with Abies balsamea and Betula
papyrifera trees (King, 1986; Frechette et al., in press), was the most important
vegetation class around these lakes. During this period, a few vegetation changes and low cyclicity was underlined by discriminant score wavelet spectrum around these lakes (Figure 2.4).
From 4000 to 0 BP, discriminant score showed gradual decrease in current CF zone and around sites located in LW zone at the eastern part of Quebec-Labrador (Figure 2.4 and Appendix A2.8). Around lakes located now in the LW zone, discriminant score underlined a relatively stability in TC with a predominance of LW class (Figure 2.4).
From 2000 to 0 BP, forest opening around Harrie, Gras and Riley was highlighted (Figure 2.4). During the same period, this trend was also highlighted for Steeve where rapid changes (significant wavelet spectrum <500 years, Figure 2.3) are recorded at c. 2000 BP and later (in the last 1000 years) around Mark pond, which are currently in CF domain in Ontario region (Figure 2.3). Around these lakes, Alnus crispa pollen percentage increase during this period (Appendix A2.10).
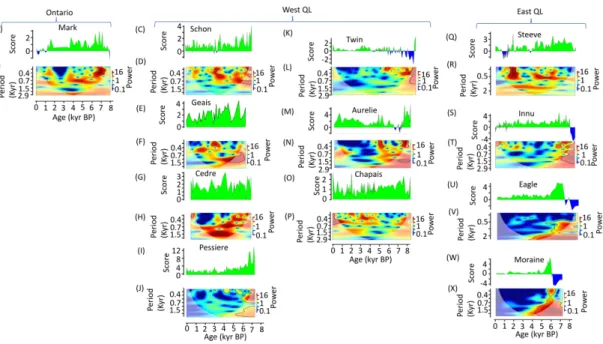
Figure 2.3 Discriminant score variation for CF region.
Discriminant score for each fossil pollen CF sites during the last 8000 years (A, C, E, G, I, K, M, O, Q, S, U, W). Sites are classified according to their region of origin. Positive value of discriminant score indicated that the fossil pollen assemblage belonged to the CF class in green and inversely to the LW class in blue. The bottom panels show the wavelet transform performed on discriminant score for the corresponding sites and periods. Statistically significant areas (p<0.05) of power are surrounded by a black line. The white shadow area indicates the ‘cone-of-influence’ in the power spectrum that should not being interpreted. *QL=Quebec-Labrador.
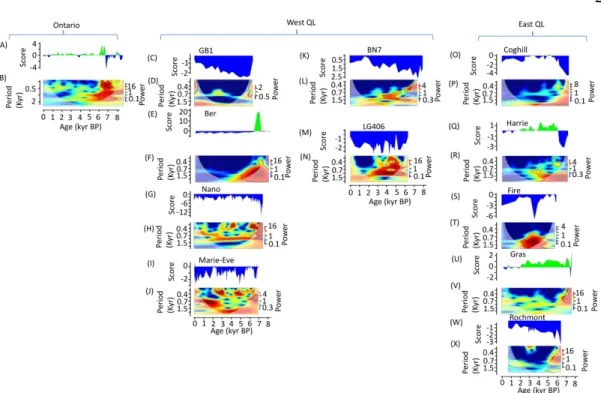
Figure 2.4 Discriminant score variation for LW region
Discriminant score for each fossil pollen LW sites during the last 8000 years (A, C, E, G, I, K, M, O, Q, S, U, W). Sites are classified according to their region origin. Positive value of discriminant score indicated that the fossil pollen assemblage belonged to the CF class in green and inversely to the LW class in blue. The bottom panels show the wavelet transform performed on discriminant score for the corresponding sites and periods. Statistically significant areas (p<0.05) of power are surrounded by a black line. The white shadow area indicates the ‘cone-of-influence’ in the power spectrum that should not being interpreted. *QL=Quebec-Labrador.
2.6 Discussion
2.6.1 Tree cover density during Holocene
Trends highlighted on past vegetation dynamics in this study was similar to that presented in previous reconstructions (Williams et al., 2000; Williams, 2002; Blarquez and Aleman, 2016). These results are also complementary to what we know about the post-glacial history of Quebec by the sole analysis of the pollen diagrams (Richard, 1995; Remy et al., 2017a, b). Between 8000 and 6000, the low stability of vegetation TC (Tree Cover) underlined in the boreal region could be linked to the pioneer stage of vegetal recolonization (Richard, 1995)after the retreat of proglacial Lake Ojibway and the Tyrell Sea in the western part (Dyke, 2004) and Laurentide ice sheet at the eastern part of the boreal zone (King, 1985). This low stability implied a syncronicity in the evolution of the TC during this period (Appendix A2.8). The 8000-6000 period correspond to Holocene Thermal Maximum (Kaufmann et al., 2004) a period with warmer climate that likely favoured the ecosystem maturation and thus appearance of vegetations belonging to the CF class. This period allowed temperate species, notably
Pinus strobus L. and Thuya occidentalis L., to ascend further north and reach the
southern portion of the study area, notably around Pessiere and Cedre lakes (Frechette et al., 2018). Variation in vegetation change underline by wavelet analysis in this period around all sites (Figure 2.3 and Figure 2.4) may be associated with several interacting factors. Indeed, factors related with the early successional character of the vegetation such as weak interaction level turnover could have favored a higher frequency in vegetation composition and structure change (Blarquez et al., 2014; Richard, 1995). The cyclicity in vegetation change could be also linked to a higher fire activity (Remy et al., 2017b) associated to lower precipitation (Ali et al., 2012; Remy et al., 2017a; Frechette et al., 2018) during this period. The low density of vegetation during this period could also be responsible for a negative feedback on fire activity (Girardin et
al., 2019). Between 6000 and 4000 BP, around Harrie, Gras lakes (at the North east of Quebec-Labrador) currently in the LW zone according to our forest classification (Figure 2.1 and Appendix A2.7). During the mid-Holocene these lakes belonged to CF group where spruce moss stands was predominant (Figure 2.4 U, Q) associated with fir and with birch (Frechette et al., 2018). This trend could have been the same around Riley lake in the Hudson Bay Lowland region (in Ontario) which is also located currently in LW zone (McAndrews et al, 1982). This agrees with the fact that Picea and Abies biomass has been much more important in this area than actually (Blarquez and Aleman, 2016). That suggested previous evidence that TC were more important and/or northern limit of CF domain would have been further north compared to the current limit on the eastern region of Quebec Labrador (Williams et al., 2000; Williams, 2002; Richard, 1995) and also in the western part of Canada boreal zone (MacDonald et al., 1993; Moser and Macdonald, 1990; Szeicz et al, 1995; Johnstone et al., 2016). This trend underlined previously across the North American boreal zone during this period would be linked to warmer conditions (Kaufmann et al., 2004). During this period, in the western part of Quebec-Labrador, particularly around Nano and Marie Eve, the fire prone species (Picea mariana and Pinus banksiana) became more abundant related to drier climate conditions associated with relatively large fires (Blarquez et al., 2015; Ali et al., 2012; Remy et al., 2017b; Remy et al., 2017a). The presence of these species associated with a relatively homogeneous flat relief, would have led to a positive feedback on the fire propagation, thus favoring their maintenance and their predominance in the landscape (Ali et al., 2012; Remy et al., 2017b; Hély et al., 2010). In the eastern part of Quebec-Labrador (particularly around Steeve, Harrie, Gras), the dominance of spruce moss stands between 6000-4000 BP would be related to fires size smaller than the western part of Quebec-Labrador (Remy et al., 2017b). In this region, the spatial heterogeneity characterized by hilly relief and more humid climate would have favored a significant proportion of unburned areas (Remy et al., 2017a). This would have allowed recolonization and a certain level of vegetation resilience during this period. From 4000 to 0 BP, increasing vegetation change around
the boreal zone particularly could be linked to many factors depending to the local environmental context (Girardin et al., 2019). Forest regeneration depends on the seedbeds quality in terms of optimum seed availability, optimum soil moisture conditions and/or nutrient availability (Pacé et al., 2018; Splawinski et al., 2019; Veilleux-Nolin and Payette, 2012). No significant change in vegetation stability at least in term of TC were underlined by wavelet spectrum since 4000 BP despite a decrease in discriminant score (Figure 2.3 and Figure 2.4), excepted around Steve and Innu, which suggested gradual vegetation change during this period. This gradual change would be related to Neoglacial period which has been identified across North America (Gavin et al., 2006; Ali et al., 2009; Viau and Gajewski, 2009; Remy et al., 2017b; Bajolle et al., 2018) as a period of declining temperatures in response to declining solar insolation (Wanner et al., 2011). These climatic conditions are known to reduce seed recruitment and tree productivity (Sirois et al., 1999; Payette et al., 2017). Ultimately, these conditions not sufficient to ensure tree regeneration led to loss of forest resilience. In the northern part zone LW (for example around Gbi1, Bn7, Ber, nano and Marie-Eve and Coghill lake) the low seed production is promoted by more colder conditions (Sirois et al., 1999) due to longitudinal temperature gradient. This may be the main causes of the loss of regeneration and the maintaining of open LW stand in around Gbi1, Bn7, Ber, nano and Marie-Eve and Coghill lakes. Further south in the CF zone, the cooler conditions increase coniferous species proportion since 2000 BP (Dyke, 2004; Carcaillet et al., 2010). This change in vegetation promoted shorter fire return interval (Girardin et al., 2013) and then lead to change in CF stand composition. In this zone, particularly around Pessiere, Cedre, Geais lakes, changes in the composition were characterized by a decrease in late successional arboreal species like Thuja occidentalis L. and Pinus strobus L., during this period. These changes underlined in previous studies (Hennebelle et al., 2018) did not necessarily lead to changes in terms of TC score (Figure 2.3). The absence of fire or the presence of low severity fire contributed to excessive accumulation of soil organic matter (known as paludification) at the west part of study area. Consequently, particularly around Riley lake and Mark pond, the
decrease in TC (Figure 2.3 and Figure 2.4) would rather be related to neoglacial cooling associated to a regional paludification (Mc Andrews et al., 1982). From 2000-0 BP, in north eastern part of Quebec-Labrador, especially around Steeve lake, predominance in LW stands would have been favored by fires which reached their largest size an instability score (Figure 2.3) (Remy et al., 2017b). Increase in LW stands would have also been associated to drier edaphic and atmospheric conditions (Magnan and Garneau, 2014; Van Belen et al., 2016; Remy et al., 2017a). We hypothesized that these environmental conditions since 2000 BP associated to loss of resilience inherited from the neoglacial period (beginning around 4000 BP) would have driven vegetation shift characterised by an increase of change of CF stand into LW stands in this region (Appendix A2.11) (Jasinski and Payette, 2005).
2.6.2 Resilience mapping and stable state mechanism hypothesis
Vegetation dynamics in the boreal biome and the resilience of forest stands has been variable over time and space. Between 8000 and 6000 BP, the pioneering phase of vegetation coincided with the period when the size of the fires was much larger in western Quebec-Labrador compared to the eastern part (Remy et al., 2017b). In addition to the influence of the continental climate characteristic of western Quebec-Labrador, the importance of fire size could explain the dominance of fire prone species (Asselin et al., 2003). Fire size also explain a higher proportion of open forest at the same latitude (around 52° N) of the sites in the west compared to the east. However, these conditions with high proportion of fire-prone species and relatively low specific diversity, could have been determinant for a greater stability of vegetation in the west compared to those in the East of Quebec-Labrador during the last 8000 years (Blarquez et al., 2014; Carcaillet et al., 2001). The resilience of spruce moss stands in the CF domain decreases with increasing latitude. This is consistent with the study realized in
central part of Quebec CF domain (Girard et al., 2008). Before 2000 BP, the resilience of forests in eastern Quebec Labrador was much greater. Our study suggests that forests have been well adapted to the range of fire frequencies since the Holocene. Thus, confirmed the results of studies carried out over a period covering the last centuries (Portier et al., 2016). However, particularly in eastern Quebec Labrador, the beginning of the neoglacial period around 4000 BP contributed to loss of resilience. This loss may have reduced the size of CF attraction basin and thus making vegetation more fragile and more able to switch (Appendix A2.11) in an LW alternative stable state. These legacies associated to change in fire dynamics, edaphic humidity and nutrient availability would have driven an increase in shift events in the direction CF towards LW stands since 2000 BP. At the landscape scale, the shift from one state to another is preferentially in the direction of CF stands towards LW stands. This confirms the trend that LW is an alternative state to CF (Jasinski and Payette, 2005).
2.7 Conclusion
Our study is one of the first to distinguished CF from LW vegetation classes by using pollen percentage. This pollen-based vegetation classification showed that boreal forest spatio-temporal dynamic underlined in this study is similar to other study (Richard, 1995; Williams et al., 2000; Williams, 2002; Blarquez and Aleman, 2016). Our reconstruction suggested that boreal TC remained relatively stable during the last 6000 BP in the boreal zone except for the north-eastern part of Quebec Labrador. In this region TC reconstruction suggested that CF domain treeline was further north than the current limit. Forest opening characterized by a loss of resilience would have started since 4000 BP. However, shift from CF to LW were particularly important since 2000 BP. These shifts would have been related to change in fire dynamic, soil humidity condition, nutrient availability associated to a loss of resilience inherited since the
beginning of neoglacial period (since ~ 4000 BP). Changes in structures within the boreal forest have implications in terms of specific diversity, productivity and carbon stock. Understanding the dynamics of vegetation in interaction with the climate and disturbances represents an important issue in relation to climate change and the current social pressure. Despite the relative stability of the boreal forest, this study suggested that in the context of global warming and increased disturbances, could lead to catastrophic loss of tree cover in certain areas of the boreal zone. Even if past change seemed gradual, vegetation legacy inherited during the last 2000 BP associated to potential increase in disturbance activity (fire size, insect outbreaks or forest clear-cuts) could lead to more abrupt changes. Furthermore, highlighting and interpreting the relationship between pollen abundance and vegetation structure remain a challenge. Similarly establishing clear links between reconstructed TC, disturbances and climate is even more complex. It seems essential to multiply analyzes on pollen sites particularly in the CF-LW ecotone in association with other indicators to better understand and define accurate vegetation trajectories in the context of global warming.
2.8 Appendices
Appendix A2.1 Selected pollen series from modern pollen data of North America (see .xls document).
Appendix A2.2 Main features of the paleosites with associated publications.
Site name Latitude Longitude Vegetation
class Region Reference Riley lake 54.322 -84.558 LW Ontario McAndrews
et al., 1982 Mark
pond 51.840 -89.616 CF Ontario Neotoma
Gb1 lake 55.111 -75.249 LW Quebec-Labrador (West) Gajewski, 1991 Ber 54.05 -76.117 LW Quebec-Labrador (West) Neotoma
Nano lake 53.024 -77.364 LW Quebec-Labrador (West)
Oris et al., 2014
Marie-Eve lake 52.030 -75.521 LW Quebec-Labrador (West)
Oris et al., 2014
Schon
lake 50.595 -77.568 CF Quebec-Labrador (West)
(Oris et al., 2014)
Continuation of Appendix A2.2
Site name Latitude Longitude Vegetation
class Region Reference Geais
lake 49.892 -78.655 CF Quebec-Labrador (West)
Ali et al., 2009
Pessiere
lake 49.503 -79.240 CF Quebec-Labrador (West)
Carcaillet et al., 2001
Cedre
lake 49.346 -79.208 CF Quebec-Labrador (West) Ali et al., 2008 BN7 lake 55.009 -73.517 LW Quebec-Labrador (West) Gajewski, 1991 LG406
lake 54.075 -72942 LW Quebec-Labrador (Centre)
Frechette et al., 2018
Twin lake 50.945 -74.564 CF Quebec-Labrador (West)
Ali et al., 2012
Aurelie
lake 50.420 -74.230 CF Quebec-Labrador (West)
Ali et al., 2012
Chapais2
lake 49.683 -74.583 CF Quebec-Labrador (West)
Garralla and Gajewski, 1992
Continuation of Appendix A2.2
Site name Latitude Longitude Vegetation
class Region Reference Rochmont
lake 56.766667 64.81-6667 LW Quebec-Labrador (East)
Neotoma
Coghill
lake 53.9 -66.767 LW Quebec-Labrador (East)
King, 1986
Harrie
lake 52.933 -66.95 LW Quebec-Labrador (East)
King, 1986
Fire lake 52.331 -67.357 LW Quebec-Labrador (East)
Neotoma
Gras lake -67.067 52.25 LW Quebec-Labrador (East)
King, 1986
Steeve
lake 51.94 68.155 CF Quebec-Labrador (East)
Remy et al., 2017a
Innu lake 50.07 -68.811 LW Quebec-Labrador (East)
Remy et al., 2017a
Eagle
lake -58.55 53.233 CF Quebec-Labrador (East)
Continuation of Appendix A2.2
Site name Latitude Longitude Vegetation
class Region Reference Moraine
lake -58.05 52.267 CF Quebec-Labrador (East)
Engstrom and Hansen, 1985
Appendix A2.3 List of pollen taxa used for classification and reconstruction
Pollen taxon Correspondent plant genera or specie
description
Abies sp Abies balsamea
Alnus crispa Alnus crispa
Alnus incana Abies incana ssp. Rugosa
Asteraceae Asteraceae
Betula spp. Mostly Betula papyrifera and at low quantity Betula glandulosa
Cheno/amx Chenopodiaceae/Amaranthaceae -
Cuppressaceae Cuppressaceae
Cyperaceae Carex type
Ericales Mainly Ericaceae
Fagus Fagus spp.
Fraxinus Fraxinus spp.
Larixpseu Larix laricina
Myrica Myricaceae
Picea Mostly Picea mariana, rarely Picea
glauca
Polypodiaceae Polypodiaceae
Continuation of Appendix A2.3
Pollen taxon Correspondent plant genera or specie
description
Quercus Quercus spp.
Rumex Rumex spp.
Salix Salix spp.
Appendix A2.4 Vegetation classes underlined in literature for North American boreal zone.
Vegetation classes References
Open forest Closed forest
]0; 20] ]20; 45] ]45; 75[ [75; 100] Scheffer et al., 2012 ]0; 25] ]25; 40] ]40; 60[ ]60; 100] Ducruc et al., 1976
Appendix A2.5 Error rate depending on the choice for predefined group.
Predefined group Error rate
DL vs (SL+CF) 25.1%
DL vs SL vs CF 30.5%
Appendix A2.8 Discriminant score median per millennium
Notes: Variation of median discriminant score over the last 8000 years. Medians were estimated for each millennium Point correspond to median. Vertical bars correspond to standard error bars. Blue color for LW sites and green for CF sites.
Appendix A2.9 Posterior probability variation over the last 8000 years around for 24 sites.
Notes: Probability (prob.) of corresponding to CF group in green or LW group in blue. Posterior probability value greater than 0.5 means TC corresponding to CF class and inversely LW class.