ÉCOLE DE TECHNOLOGIE SUPÉRIEURE UNIVERSITÉ DU QUÉBEC
MASTER THESIS PRESENTED TO ÉCOLE DE TECHNOLOGIE SUPÉRIEURE
IN PARTIAL FULFILLMENT OF THE REQUIREMENTS FOR A MASTER'S DEGREE IN MECHANICAL ENGINEERING
M. Eng.
BY
Mohammadreza MAJLESI
ICE MEASUREMENT ON THE WIND TURBINES’ BLADES BY CLOSE-RANGE PHOTOGRAMMETRY METHODS
MONTREAL, 27 JULY 2015 TO BUREAU DES CYCLES SUPÉRIEURS
This Creative Commons licence allows readers to dowload this work and share it with others as long as the author is credited. The content of this work can’t be modified in any way or used commercially.
BOARD OF EXAMINERS
THIS THESIS HAS BEEN EVALUATED BY THE FOLLOWING BOARD OF EXAMINERS
Mr. CHRISTIAN MASSON, Thesis Supervisor
Mechanical Engineering Department at École de technologie supérieure
Mr. SOUHEIL-ANTOINE TAHAN, Thesis Co-supervisor
Mechanical Engineering Department at École de technologie supérieure
Mr. MICHEL RIOUX, President of the Board of Examiners GPA Department at École de technologie supérieure
Mr. HUSSEIN IBRAHIM, Member of the jury Wind Energy Techno Center (TCE)
THIS THESIS WAS PRENSENTED AND DEFENDED
IN THE PRESENCE OF A BOARD OF EXAMINERS AND PUBLIC
2 JUNE 2015
ACKNOWLEDGMENT
I would like to express my special appreciation and thanks to my advisor Professor Dr.
Christian Masson, you have been a tremendous mentor for me. I would like to thank you for
selecting me as your student and encouraging my research and for the useful comments, remarks and engagement through the learning process of this master thesis. Your advice on both research as well as on my career have been priceless. I would also like to thank my Co-supervisor, Professor Dr.Souheil-Antoine Tahan for introducing me to the topic as well for the support on all the way. I also want to thank you for your brilliant comments and suggestions in all steps of my study, thanks to you.
A special thanks to my family. Words cannot express how grateful I am to, my mother and father for all of the sacrifices that you have made on my behalf. Your prayer for me was what sustained me thus far. I would also like to thank all of my friends who supported me in writing, and incited me to strive towards my goal. At the end I would like express appreciation to my beloved wife SAEEDE who spent sleepless nights and was always my support in the moments when there was no one to answer my queries and finally my son
MESURE DE LA GLACE SUR LES PALES DES ÉOLIENNES PAR DES MÉTHODES DE PHOTOGRAMMÉTRIE À COURTE PORTÉE
Mohammadreza MAJLESI
RESUME
La numérisation photogrammétrie pour mesurer l'épaisseur de glace est tout à fait nouvelle dans le domaine de l’énergie éolien. Lorsque les pales du rotor ont été montées sur la tour de l'éolienne, effectuer les inspections de l'épaisseur de la glace était presque impossible dans le passé, mais par les méthodes de modélisation à base de l'image, l'extraction de la géométrie des pales givrées sous la forme de modèles en maille est possible.
Dans ce mémoire de recherche, une maquette 3D des pales d'éoliennes sans glace est conçue dans le logiciel CATIA et considéré comme les données de référence de CAO. Un prototype de ce modèle CAO est construit par une machine d'impression 3D. Après la peinture, nous avons ajouté 3 modèles des cibles (retro targets) sur les surfaces des pales. Un appareil photo reflex numérique est utilisé pour capter plusieurs images des objets avec différents modes d'éclairages et d'illuminations. Une série de nuages de points est produite en utilisant la méthode de structure de mouvement (SfM) et le logiciel VisualSfM. Chaque nuage de points a un système arbitraire de coordonnées qui est mis à l'échelle et transféré au système de coordonnées global par transformation à l’aide du logiciel CATIA en se basant sur les caractéristiques similaires entre le nuage de points 3D et les données de référence de CAO. Lorsque la glace a une texture suffisante, comme du givre blanc, cette texture peut être captée dans les images et un nuage de points correspondant à la région captée sera également détecté. La position de la glace sur les pales est détectée par cibles (retro targets) codé sur la surface de la pale et à l'ordre d'acquisition des images. Le nuage de points générés et son maillage sont comparés avec les données de référence de CAO et le résultat est montré en format 3D, qui détermine la forme, l'épaisseur et la masse approximative de glace sur les pales.
Cette étude a porté sur la faisabilité de la reconstruction de modèles de maillage polygonal 3D par l'image captée d'une pale d’éolienne avec un ensemble d’appareils photo reflex numériques. L'objectif principal de cette modélisation est identifié le volume et la forme des zones de glace accumulée sur les pales de l'éolienne dans les régions arctiques. Une comparaison géométrique de ces modèles de maillage triangulaires avec les données CAO de pale non-glacé pourrait révéler la géométrie de la glace accumulée.
Mots-clés: Photogrammétrie à courte portée, Photogrammétrie rapprochée, Méthode de
détection de glace, Modélisation 3D à base d'images, Structure du mouvement, Transformation de similarité en 3D.
ICE MEASUREMENT ON THE WIND TURBINES’ BLADES BY CLOSE-RANGE PHOTOGRAMMETRY METHODS
Mohammadreza MAJLESI
ABSTRACT
Photogrammetric scanning for measuring the thickness of ice is quite new in the wind energy field. When the rotor blades were mounted on the wind turbine tower, ice thickness inspections became nearly impossible to be performed in the past but by image base modeling methods, geometry extraction of ice of frosted blades are possible in the form of mesh models.
In this research thesis, 3D model of wind turbine blades without ice is designed as reference Master CAD data. A prototype of this CAD model is made by a 3D printer machine which after painting, a pattern of retro targets is added to blades surfaces. Digital Single-Lens Reflex (SLR) camera is used to capture several images of objects with different modes of lighting and illumination. A series of point clouds is produced by using the Structure from Motion (SfM) method and VisualSfM software. Each point cloud has an arbitrary coordinate system that is scaled and transferred to Global Coordinate System by 3D transform on CATIA software based on similar features between 3D point cloud and master CAD data. When the ice has sufficient texture, such as rime ice and the texture is captured in the images, a point cloud corresponding to the captured region will also be detected. The position of ice on the blades is detected by coded retro targets on blade’s surface and the order of image acquisition. The generated point cloud and its mesh are compared with the Master CAD or reference geometric model and finally shows in 3D format, the shape, thickness and approximate mass of ice on the blades.
This study focused on the feasibility of reconstruction of 3D polygonal mesh models by images captured from a wind turbine blade with a configuration of digital SLR cameras. The main objective of this reconstruction is to identify the volume and shape of ice-accumulated areas on the wind turbine blades in arctic regions. Geometrical comparison of these triangular mesh models with the non-iced blade CAD data could reveal the geometry of accumulated ice.
Keywords: Close-Range Photogrammetry, Ice detection method, Image-based Modeling,
TABLE OF CONTENTS
Page
INTRODUCTION ...1
CHAPTER 1 ATMOSPHERIC ICING OF WIND TURBINES & ICE DETECTION SYSTEMS ...6
1.1 Introduction ...6
1.2 Main type of atmospheric ice accumulation ...8
1.2.1 In-cloud icing ... 8
1.2.2 Precipitation icing ... 9
1.3 Ice detection methods ...11
1.3.1 Direct detection ... 12
1.3.1.1 Direct detection by reflective light sensor, HoloOptics ... 12
1.3.1.2 Stereo imaging from web cameras ... 14
1.3.1.3 Reflection of polarized infrared light, IceHawk® ... 16
1.3.1.4 Infrared spectroscopy ... 17
1.3.1.5 Reflected light from inside ... 19
1.3.1.6 Fiber optic cable with special clad ... 19
1.4 Limitations or disadvantages of current ice detection systems ...20
CHAPTER 2 INTRODUCTION TO CLOSE RANGE PHOTOGRAMMETRY & IMAGE BASE MODELING ...23
2.1 The photogrammetric process ...24
2.1.1 Photogrammetry, recording and analysis procedures ... 25
2.1.2 Technical components of photogrammetric process ... 27
2.2 Introduction of image base modeling ...29
2.3 Structure from Motion ...30
2.4 Poisson surface reconstruction ...31
2.6 Image base modeling by DSLR camera comparison with laser scanners ...33
2.7 Structure from Motion & the accuracy of image base modeling ...36
CHAPTER 3 METHODOLOGY ...39
3.1 Introduction ...39
3.2 Image-based modeling & 3D object reconstruction procedures ...41
3.3.1 Targeting object ... 44
3.3.2 Light and illumination ... 45
3.3.3 Digital photography ... 49
3.3.4 Camera position & movement for 3D object ... 51
3.3.5 Camera movement for a large 3D object ... 52
3.3.6 Image orientation & camera calibration ... 53
3.4 Orientation & 3D mesh modeling ... 57
3.5 Applied software ... 57
3.5.1 VisualSfM ... 58
3.6 Process simulation of ice measurement on the wind turbines’ blades by close-range photogrammetry methods ... 61
3.6.1 Digital-mock-up of master CAD data ... 61
3.6.2 Rapid prototyping of scaled wind turbine blade by 3D printing ... 63
3.6.3 Targeting & determination of control points ... 63
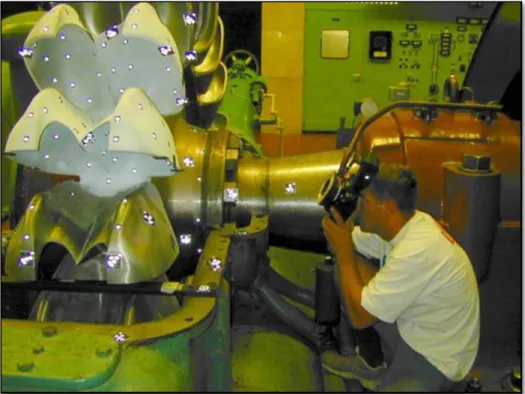
3.6.4 Prototype & photogrammetric object recording ... 64
3.7 Brief history of project case study and Wind Energy Technocentre ... 68
3.8 About Wind Energy TechnoCentre: ... 68
3.9 The methods & equipment for blades access and photography ... 69
3.9.1 Using of the crane for accessing to the blade surfaces and marking the blade ... 69
3.9.2 Using of the blade access suspended platforms ... 70
3.9.3 Using of the maintenance access man hole in the wind turbine hub ... 71
3.9.4 The photography of the objects by remote controlled drone ... 71
3.10 Recommended procedure for photogrammetric object recording via remote control drone ... 72
3.11 The equipment for marking the measuring surfaces ... 74
3.12 The economic challenges in ice measurement on the wind turbines’ blades . 74 CHAPTER 4 RESULT AND CONCLUSION ... 76
4.1 Points cloud reconstruction ... 77
4.2 Mesh generation ... 78
4.3 Scaling and alignment of the model ... 82
4.4 Measurement system analysis ... 87
4.4.1 Prototype process simulation, limitation and consideration ... 93
CONCLUSION ... 95
RECOMENDATION ... 97
ANNEX I PHOTOGRAMMETRY, RECORDING AND ANALYSIS PROCEDURES ... 101
ANNEX III CAMERA CALIBRATION PARAMETERS ...109
ANNEX IV RETRO TARGETS ...112
ANNEX V SIFT/BUNDLER/PMVS2 INPUT OUTPUT ...118
LIST OF TABLES
Page
Table 1.1 Optical ice detection system in market ...21
Table 3.1 EXIF table tags information in the jpegs images ...50
Table 4.1 Illumination effect on ice feature detection ...82
LIST OF FIGURES
Page
Figure 1.1 Prevailing strong winds. The map indicate regions of wind attractive for wind power development, with average wind speed > 5ms−1 and average generation 33% of rated power. Note the importance of marine
situations and upland sites ...7
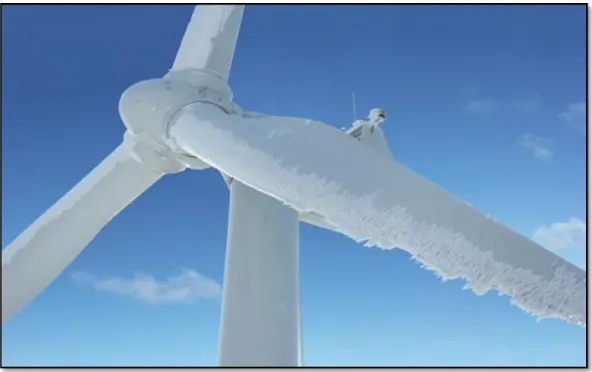
Figure 1.2 Problematic ice vanes on the windward side of the blade ...7
Figure 1.3 Aircraft Propellers with accumulation of precipitation ice on leading edge, image taken between 1969-73, in Sea-king, Wessex. Ontario Canada.
(source: www.eacott.com.au/gallery/d/3366-1/icing+4) ...9
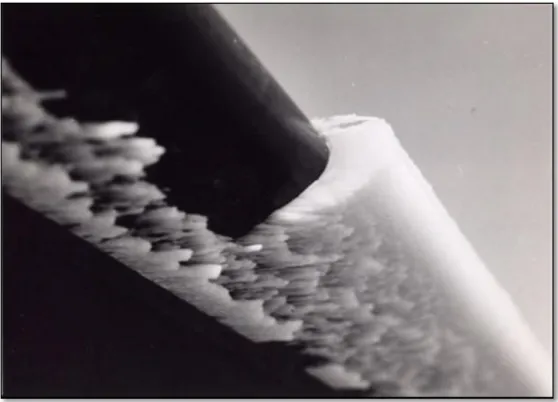
Figure 1.4 Frosted ice accumulated on the WT Blade`s shoulder ...10
Figure 1.5 (Left) T23 & T26 Icing Rate Sensor, (Right) T41 shown on the nacelle at the wind power plant in Härnösand, northern Sweden. Source: HoloOptic.net ....13
Figure 1.6 The IR-emitter & photo detector installed on the hub and reflector as retro targets stick on the blades. ...14
Figure 1.7 (Top left) Installed camera on the Nacelle, the lamp on the right is for heating purpose. (Top right) rime ice observed on the blade.
(Bottom left) rime ice after 45min heating system on, (bottom right) de-iced blade, some little trace of glazed ice remained on the leading edge. Source : (Cattin, 2015) ...15
Figure 1.8 (Left) Infralytic Sensor tip with sender/receiver, (Right top) Sketch of rotor hub, (Right down) Sensor location in the blade. Source Brochure:
Figure 2.1 The photogrammetric process: from object to model
((Luhmann, Robson et al. 2006), page 3) ... 25
Figure 2.2 Typical photogrammetric products ((Luhmann et al., 2006), page 12) ... 26
Figure 2.3 Recording and analysis procedures (red: can be automated in a
digital system) ((Luhmann et al., 2006), page 3) ... 27
Figure 2.4 Three-dimensional reconstructions by image base modeling and Structure from Motion (SfM). Left: overlapped sequential images, Middle: Camera position and Camera path & direction in image recoding, Right: Textured mesh of object. (Horning, 2012) ... 29
Figure 2.5 Right: Schematic of epipolar geometry (Musialski et al., 2013), left: Generated sparse point cloud from unordered images
(Furukawa et al., 2009) ... 33
Figure 2.6 Birefringent (double refraction) optical property. when a single light ray strikes a calcite crystal at a right angle to one face, showing two rays
emerging. (Britannica, 2015) ... 34
Figure 2.7 Customize laser scanner equipped by laser beam at wavelength
405-460 nm ... 35
Figure 3.1 "Site Nordique Experimental en Éolien CORUS" (SNEEC), Gaspé, near Rivière-au-Renard, Quebec, Photo from the top of the second wind turbine. (eolien.qc.ca, 2015) ... 40
Figure 3.2 Image base modeling and comparison for extraction of ICE on Blade
as CAD data ... 41
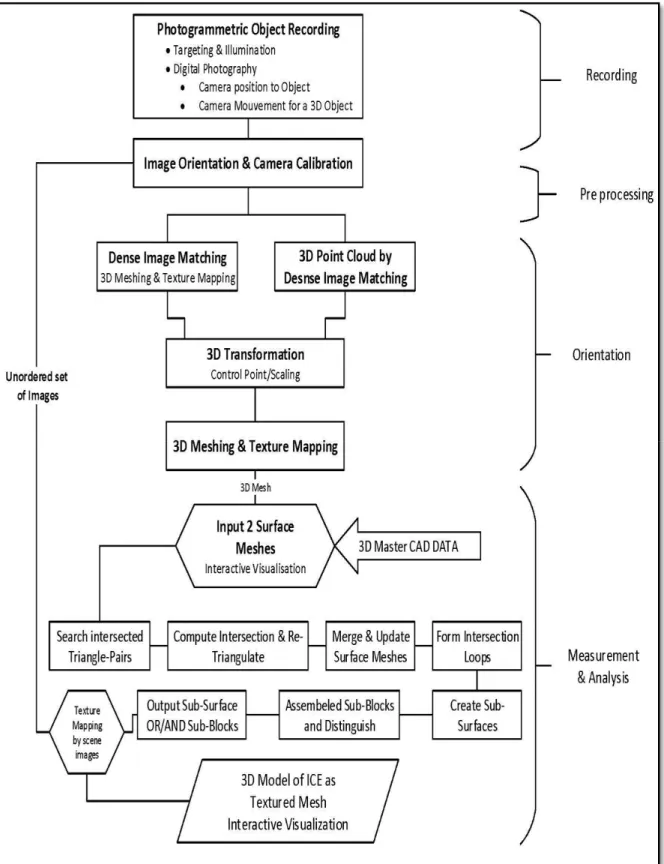
Figure 3.3 Workflow for Image-Based Modeling & 3D object reconstruction
Figure 3.4 Curved surface with rows of circular dot targets ...45
Figure 3.5 Ring flash on DSLR camera helps to illuminate from viewing direction of camera, source: www.capture3d.com ...46
Figure 3.6 Spectrum of Blue Violet light, λ between 405 nm to 460 nm ...47
Figure 3.7 Spectra software for light color extraction from wavelength λ ...48
Figure 3.8 Color block with wavelength 432 nm- Code RGB (51, 0, 255) ...48
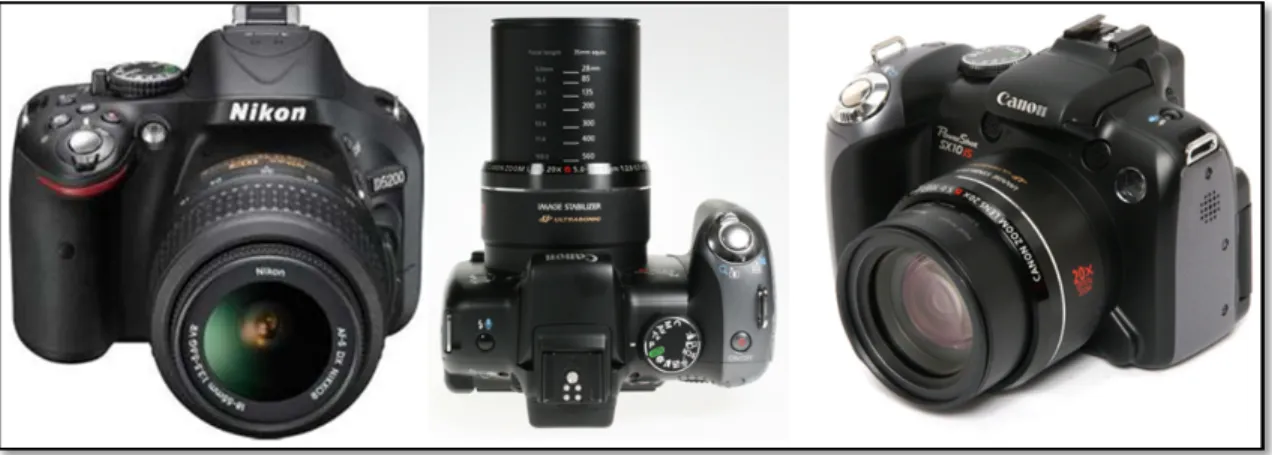
Figure 3.9 Left: Nikon D5200, Center & Right Canon PowerShot Digital Camera ...49
Figure 3.10 Camera position for large Object images recording. ...51
Figure 3.11 Tiling procedure for large object. ...52
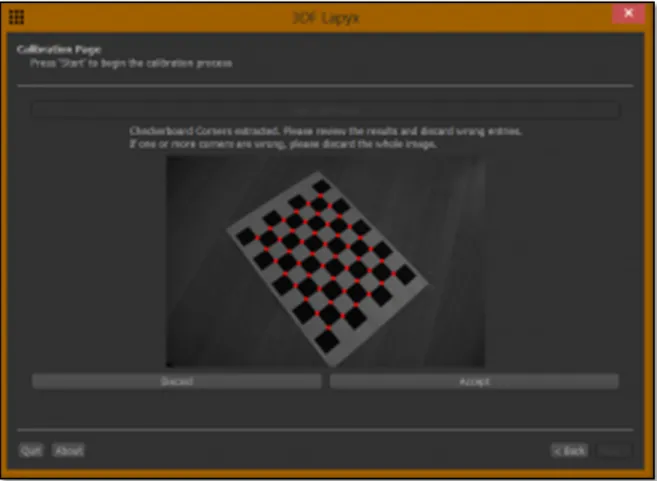
Figure 3.12 3DF Lapyx automatic camera calibration software that extracts the typical intrinsic camera parameters used in Computer Vision ...54
Figure 3.13 Top: Image distortion by simple lens, Down: Different type of Lens Distortion order from left to right; Barrel. Pincushion & Moustache Distortion (http://www.photocritic.org/articles/everything-about-camera-lenses) ...55
Figure 3.14 PTlens interface ...55
Figure 3.15 Left: Original Photo, Right: Rectified Photo from Same photograph, distortion corrected ...56
Figure 3.16 3D Reconstruction - Using the VisualSfM GUI ... 60
Figure 3.17 VisualSfM with rectified images from PTlens software ... 60
Figure 3.18 Rendered view of Master CAD data of Prototype blade ... 62
Figure 3.19 Digital Mock-Up of the Prototype of Wind Turbine blades on hub ... 62
Figure 3.20 Up: Render view of Master CAD data, Down: Prototype blades with different surface patterns and targeting layout, From top Pattern 1 to 3 ... 64
Figure 3.21 Blades with different target pattern. ... 65
Figure 3.22 Prototype blade illuminated by color light with λ=432 ... 66
Figure 3.23 Camera calibration parameter in VisualSfM ... 67
Figure 3.24 RE POWER MM 92 & Crane Withdraws (source: http://myrenaultzoe.com/index.php/2013/02/17/: image: T. Larkum) ... 69
Figure 3.25 Suspended access equipment for Wind Turbine (www.spiderstaging.com) .. 70
Figure 3.26 Access to the blades' surfaces by access man hole in the wind turbine hub (source : http://www.frontierpro.com) ... 71
Figure 3.27 Remote controlled Helicopter for WT image acquisition (Source: http://www.airfoilskycam.com) ... 72
Figure 3.29 Self-inking stamp for coded and non-coded retro target ...74
Figure 4.1 Generated point cloud of the iced blade-regular light ...77
Figure 4.2 Point cloud view from pitch angle axis ...78
Figure 4.3 Generated mesh of 1st blade (recto view). Extracted point cloud from normal lighting ...79
Figure 4.4 Generated mesh of 1st blade (verso view). Extracted point cloud from normal lighting ...79
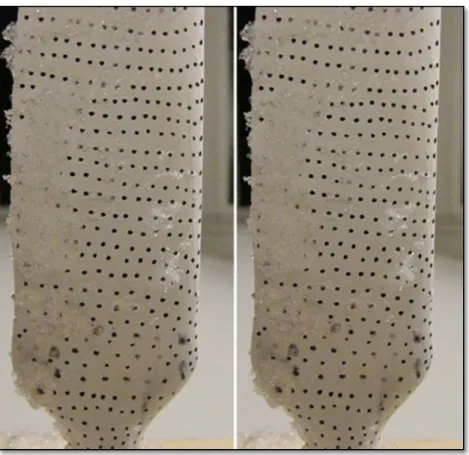
Figure 4.5 Generated mesh of 1st blade (recto view). Extracted point cloud from light with λ=432 nm ...80
Figure 4.6 Generated mesh of first blade (Verso view). Extracted point cloud from light with λ=432 nm ...80
Figure 4.7 Generated mesh of second blade (Verso view). Extracted point cloud from light with λ=432 nm ...81
Figure 4.8 Generated mesh of second blade (Verso view). Extracted point cloud from light with λ=432 nm ...81
Figure 4.9 Steel ruler as Ground Control Points (GCP). ...83
Figure 4.10 Scale Bar in the point cloud ...84
Figure 4.12 3D Similarity transform feature is positioned on the blade ... 86
Figure 4.13 CAD model aligned with the generated cloud point ... 87
Figure 4.14 Ice thickness contour of first blade (recto view). Extracted point cloud
from regular light ... 88
Figure 4.15 Ice thickness contour of first blade (verso view). Extracted point cloud
from regular light ... 88
Figure 4.16 Manual measurement of iced region. Filler gauge shows ≈2.9 mm in area .... 89
Figure 4.17 Composition of used feeler gauges in measurement ... 90
Figure 4.18 Ice thickness contour of first blade (recto view). Extracted point cloud
from light with λ=432 nm ... 90
Figure 4.19 Ice thickness contour of first blade (verso view). Extracted point cloud
from light with λ=432 nm ... 91
Figure 4.20 2D ice profile shape on the blade in different span wise of object. The hatched profile is the blade real cross section. Brown show the margin
of the ice volume on the blade ... 92
LIST OF ABREVIATIONS
AM Additive Manufacturing
ANN Approximate Nearest Neighbors
BA Bundle Adjustment
BITE Built In Test Equipment
CAD Computer Aided Design (Drafting) CAE Computer Aided Engineering CAM Computer Aided Manufacturing CAO Conception Assistée par Ordinateur CCV Cold Climat Version
CMOS Complementary Metal–Oxide–Semiconductor Sensor CRP Close Range Photogrammetry
DEM Digital Elevation Model
DSLR Digital Single-Lens Reflex camera EMI Electro Magnetic Interference EXIF Exchangeable Image File Format
FOS Fiber Optic Sensor
GCP Ground Control Points
GRP Glass-fiber-Reinforced Plastic GUI Graphic User Interface
IR Infra Red
LED Light Emitting Diodes
MP Mega Pixel
PMVS Patch-based Multi-View Stereo Algorithm
RANSAC Random Sample Consensus
RC Remote Control
RGB Red Green Blue color code
RT Retro Target
SBA Sparse Bundle Adjustment SfM Structure from Motion
SIFT Scale Invariant Feature Transform SLR Single-Lens Reflex camera
SNEEC Site Nordique Expérimental en Éolien CORUS
SO Small Object
SURF Speeded Up Robust Features
UI User Interface
UV UltraViolet
WESNet Wind Energy Strategic Network
LIST OF SYMBOLS
A Cross sectional area [m2]
ω Mass concentration of the particles [kg]
ϑ Relative velocity [ ]
α Terms of correction factors
α1 Collection efficiency (or collision efficiency)
α2 Sticking efficiency
α3 Ice builds up rate on the surface (blade)
Nanometer
INTRODUCTION
Globally, fossil fuels are the primary source of electricity with hydropower and nuclear power plants being in use to meet the demands in certain regions of the world. In recent times, concerns about the harmful effects of global warming and emissions of carbon dioxide have created new demands for an alternative and suitable energy source such as wind energy. The benefits of wind energy include an abundant source, pollution free, local power generation at site that reduces long distances transmission losses (Patel, 2012) and economic gains such as investments in rural development as well as creation of new jobs.
Wind energy in Quebec has been developed as part of the Quebec government’s 2006–2015 energy strategy, the goal of which is to install 4,000 MW of wind energy capacity in the province by 2015. This objective should be reached in 2018 with the finalization of the projects totaling 800 MW announced in May 2013.
The Quebec government must develop a new energy policy for after 2015. CanWEA recommends that the Quebec government define clear and specific objectives in its next energy policy for the installation of new wind projects totaling 500 MW of capacity per year between 2018 and 2025. This objective is in keeping with the vision of developing the sector, creating wealth and attracting investment to Gaspé, Montréal and elsewhere in the province (canwea.ca, 2013)
However, there are problems associated with wind power generation in cold climates such as Canada, most notably icing.
Background
Atmospheric icing on structures has been a known problem to industries such as aviation and operation and maintenance of power lines for a long time. It is though a fairly new problem for the wind power industry as it has expanded into more arctic and alpine regions where the wind resource is rich but the climatic conditions are more challenging. A large-scale
expansion in this type of terrain demands improved knowledge of how wind turbines perform during icing conditions and what happen to it in extremely low temperatures. Difficulties such as low temperature of gearbox oil, iced-up yaw systems and changed aerodynamics of turbine blades due to icing have to be solved if wind power in cold climates is to be profitable. Some manufacturers have already developed arctic packages for wind turbines, but the icing of the blades still require further work. There are only a few different de-icing and anti-icing solutions available on the market. There are also some problems to identify the onset of the icing event, which results in increased downtime of power production.
A clear negative aspect from ice accretion is the impact the ice load has on the different components of the wind turbines. Icing can cause problems ranging from decrease of power due to modifications in the aerodynamics of the blades’ profile (Jasinski et al., 1998), which results in increased blade vibration and fatigue of wind turbine components (Ganander et Ronsten, 2003) and to additional safety concerns to people and wildlife due to detachment of accumulated ice. Even small amounts of ice on the blades deteriorate their aerodynamic performance. For security reasons related to ice-throw and to prevent the increased wear and the consequent shortening of component lifetime, wind turbines are generally shut down during severe icing events, which in turn lead to further loss of production and therefore economic losses.
The detection of icing poses another problem. There are several ice detection instruments on the market, but none of them seem to be performing satisfactorily. However, improvements are continuously made to enhance the measurement sensitivity and accuracy. The causes and effects of icing on wind turbines are not completely understood and neither are there well proven solutions readily available to hinder icing. Therefore, this is an area of active research.
1) Objective
In many research on the icing of the blades, the ice shapes were defined to approximate the shapes obtained from analysis of the photographs from in-site full-scale wind turbines with icing and from the results of numerical simulations using an ice accretion code (Canice, 2015). The profile shape of icing are modeled based on the numerical simulation from the atmospheric conditions data during one year (Antikainen et Peuranen, 2000) & (Botta, Cavaliere et Holttinen, 1998). This combined use of in-site photographs and ice accretion code take an estimated 3D ice shapes from the blade that is far from the real shape of the ice. This method could not show the mass exact of the ice on the blades that cause unbalancing and resonance in the wind turbine.
The aim of this study is to implement a new approach for measuring ice thickness by photogrammetry and computer vision system. Photogrammetric scanning for measuring the thickness of ice is quit new in this field. In principle, photogrammetric methods can be applied in any situation where the object to be measured can be photographically recorded. When the rotor blades were mounted on the wind turbine tower, ice thickness inspections became nearly impossible to be performed in the past, now by image base modeling of iced blades, geometry extraction are possible. If we focus on the case of Image-based modeling, reconstructed outputs are largely in the form of mesh models. New methodology for measurement by photogrammetric scanning of an installed wind turbines' blades will be proposed. By this methodology the real distribution of ice's mass on the blades surfaces measured by verifying of the shape and dimension of icing rotor blades against CAD or master data of rotor blades . CAD data of master model of wind turbine blade generate by 3D reverse engineering base on the Photogrammetry measurement of clean installed blades with appropriate level of details.
The case study of this thesis is a RePOWER MM92 wind turbine “2-MegaWatt power plant with 92 meter rotor diameter” that installed in the wind farm field in Gaspésie peninsula. In this study, the different methods of access to the blades’ surfaces reviewed and suitable economical and practical photography method will be proposed.
2) Research Identification
• Research Objective
My research topic focuses on reconstruction of three dimensional polygonal mesh models by images captured from wind turbine blade with a configuration of digital SLR cameras. The main objective of this study is to identify the volume and shapes of iced accumulated areas on the wind turbine blades in arctic regions. Comparison of these polygonal mesh models with the master CAD data of clean blade without ice, could be extracted the geometry of iced regions.
The specific aims of this study are as following:
• Inspection and extraction of real air foil section in wind turbine blades (CAD data of the rotors blades in normal and icing condition);
• To find out the distribution of icing mass on the blades surfaces; • To understand the modified airfoil of the icing blades.
3) Research questions
1. What is the 2D ice profile shapes on the blades at different span-wise locations?
2. What is the ice thickness (Glaze ice & Rime ice) on the surface of the rotor blades?
4) Innovation Aimed at
Innovation of this research is to develop a new approach for measuring the ice thickness by Photogrammetry and computer vision system. This new approach can be finished to new ice detection systems, which has more advantage than existing commercial ice detection sensor. This approach can develop a new ice detection system who detects:
• Real distribution and volume of ice on the blade’s surface; • Shape & Geometry of ice on the blade;
• The real shape of Ice in time of measurement (Geometry of modified airfoil); • Estimated Mass and Thickness of Ice in measuring time.
Thesis Structure
The research work is organized as follows:
Chapter 1: Introduction, this section presents general overview about the case study, Atmospheric Icing of wind turbines & Ice detection systems available in market. It describes the basic idea of topic, motivation, problem statement, research objectives, and research questions.
Chapter 2: Introduction to Close Range Photogrammetry & image base modeling, deals with theoretical background of the study and literature review. It also explains various components of computer vision and digital photogrammetry & Technical components of photogrammetric process.
Chapter 3 Methodology, this chapter describes the complete workflow of the study and description in details, about data used, hardware and software tools used.
Chapter 4: Results and Conclusion, this chapter describe the experiments on the selected data, achieved results, its discussion and analysis and finally the answer of the research questions in concluded form and recommendations for further study.
Recommendation: This section proposed the important notice & details recommendation in Photogrammetric measuring of Ice for the real case study base on the author knowledge and the experiences from this study.
CHAPTER 1
ATMOSPHERIC ICING OF WIND TURBINES & ICE DETECTION SYSTEMS
This chapter is a brief presentation for atmospheric icing of wind turbines and the existing ice detection methods in the market. The objectives of this chapter were to review the ice detection methods of and propose an alternative system that overcomes the shortcomings of previously tested icing sensors.
1.1 Introduction
Wind energy is and will increasingly be used at cold climate sites as one of the best locations for wind turbines where are subjected to icing of blades. According to Figure 1.1 the cold climate areas are one of the major attractive areas for wind power development. Resulting out of the external conditions at these sites several effects occur that change the wind turbine behavior and in consequence the efficiency of a wind farm. The calculations show that a wind turbine can lose up to 20% of its annual production output through ice formation (Krogh-Jeppesen, 2014).
Icing of blades in wind turbine blades (Figure 1.2) be able to cause a range of problems, such as complete loss of production, reduction of power reduction by disrupt the aerodynamics airflow, overloading due to delayed stall, increased fatigue of components due to imbalance in the ice load, and damage or harm caused by uncontrolled shedding of large ice chunks.
Figure 1.1: Prevailing strong winds. The map indicate regions of wind attractive for wind power development, with average wind speed > 5ms−1 and average generation 33% of
rated power. Note the importance of marine situations and upland sites (Burton et al., 2011).
1.2 Main type of atmospheric ice accumulation
Atmospheric icing is the term used to describe the accretion of ice on structures or objects due to either freezing precipitation or freezing fog. According to ISO 12494, two main types of atmospheric ice accumulation are traditionally defined, precipitation icing and in-cloud icing (ISO 12494, 2001).
The main icing mechanisms in wind turbine application are as follows: • In-cloud icing;
• Precipitation icing.
1.2.1 In-cloud icing
In-cloud icing occurs when small, super cooled, airborne water droplets, which make up clouds and fog, freeze upon impacting a surface, which allows formation of ice. These water droplets can remain liquid in the air at temperatures down to − 35 °C due to their small size but will freeze upon striking a surface which provides a crystallization site (Mason, 2010). Rime ice is the most common type of in-cloud icing and has the three following forms:
• Hard rime; • Soft rime; • Glaze.
The different types of rime and glaze are formed depending on the droplet sizes and the energy balance of the surface in question. For small droplets with almost instantaneous freezing, Soft rime forms. With medium sized droplets and slightly slower freezing, Hard
rime forms. If the buildup of rime is such that a layer of liquid water is present on the surface
during freezing, Glaze forms.
Rime ice forms ice vanes on the windward side of the blade especially on the leading edge and tip of blades. This leads to eccentrically loading by ice. In-cloud icing also depends on
the dimensions of the object exposed, the wind speed and the air temperature (Frohboese, Steiniger et Anders, 2007). In general Rime ice grows as droplets rapidly freeze and forms brittle, opaque, and milky-textured ice.
1.2.2 Precipitation icing
Precipitation icing is due to rain or snow freezing on contact with a surface. Precipitation icing can have much higher rates of mass accumulation than in-cloud icing, with possibly greater resulting damage. Relative frequency for the two types of icing is dependent on geographic location and climate. Wet snow can stick to surfaces when in the temperature range of 0–3 °C, while freezing rain requires surface temperatures below 0 °C. Glaze icing can occur throughout most of North America, but is most prevalent along Canada’s east and west coastal regions.
Figure 1.3: Aircraft Propellers with accumulation of precipitation ice on leading edge, image taken between 1969-73, in Sea-king, Wessex. Ontario
A physical model for icing is described by Eq. (1.1), as detailed by (Makkonen, 1994) and (Frohboese, Steiniger et Anders, 2007). The variation of mass (M) is:
=α1×α2×α3×ω×ϑ×A (1.1)
Where
A
is the cross sectional area of the object with respect to the direction of the particle velocity vector, ω is the mass concentration of the particles, ϑ is the relative velocity of the particles and the terms are correction factors with values in the range 0.0–1.0. The collection efficiency (or collision efficiency), α1, represents the flux density of particles striking the surface in relation to the maximum possible. The sticking efficiency,α
2, represents the ratio of the flux density of particles sticking to the surface. The accretion efficiency, α3, represents the rate at which ice builds up on the surface in relation to the flux density of particles sticking to the surfaceFigure 1.4: Frosted ice accumulated on the WT Blade`s shoulder (photo by LM Wind Power Group) (kaupunki, 2011)
As described in Eq. (1.1) at area as close to the tip of blades, the highest velocity occurs, sweep a larger volume and collects water or ice from the entire environment. This area has the significant rate of ice accretion.
Glaze ice is transparent, hard and attaches well to surfaces. Rime ice has Greater thickness and attached more loosely to surface. The mixture of two type of icing could be occurred due to variation in ω, the mass concentration of the particles, the relative velocity of the particles,
ϑ and change the correction factors of α during the time of ice accumulation. The attachment
of ice to the surface causes the arbitrary change in shape and the mass of ice on the wind turbine in operation.1.3 Ice detection methods
Icing detection of wind turbines has different requirements than detection of icing on aircraft or for meteorological equipment purposes. This is evident when sensors considered for other purposes do not perform adequately when mounted on the wind turbines. As described in Eq. (1.1) the best position for the detection of icing on the blades on the blade itself, in area as close to the tip of blades which has the significant rate of ice accretion. The outer ends of the blades sweep a larger volume and collect water or ice from the entire volume which it is at the blade tip that the highest velocity occurs who is directly related to the relative velocity of the super-cooled water droplets. Another reason is that the blade tips can experience icing due to low clouds even though the nacelle is ice-free.
(Homola, Nicklasson et Sundsbø, 2006) reviewed 29 ice detection methods for use in the wind industry. These methods were discussed based on a set of requirements for a sensor/probe under broad operating conditions. They separated these methods into two groups: Direct method and indirect method.
The indirect methods are based upon detecting the weather conditions that lead to icing, such as humidity and temperature, or detecting the effects of icing, such as a reduction in
power production. They then use a model, either empirical or deterministic, to determine when icing is occurring (Homola, Nicklasson et Sundsbø, 2006). The indirect methods are out of scope of this research.
1.3.1 Direct detection
The direct methods detect some property change caused by the accretion of ice. These include mass, reflective properties, electrical or thermal conductivity, dielectric coefficient and inductance. The inductance change probe of (Seegmiller, 1996), the impedance change probe of (Wallace et al., 2002)and the microwave ice detector of (Magenheim, 1977) are examples of direct methods. (Homola, Nicklasson et Sundsbø, 2006) evaluated twenty-four direct methods of ice detection and all the majors of these methods are based on the change in an electrical property with ice accretion appear suitable for use in the wind industry. In the work of (Homola, Nicklasson et Sundsbø, 2006), most of the 29 methods presented were found not to be reliable for ice detection base on the study’s set of requirements. These requirements include high sensitivity and wide area detection capabilities. This research evaluates the proposed optical methods from their list separately and compares them to our proposed solution for ice detection in end of Chapter 2.
1.3.1.1 Direct detection by reflective light sensor, HoloOptics
The HoloOptics (Westerlund, 2004) detects ice by means of optical sensors. An IR-emitter sends out light that is reflected by a probe and registered by a photo detector. It makes use of the fact that the probe’s optical properties change with an ice coating. Ice is indicated when 95% of the probe is covered with a 50μm thick layer of clear ice or a 90μm thick layer of any other type of ice. (Heimo et al., 2006)
When the photo detector detects ice, the internal heating is turned on without time delay to de-ice the surface. The time it takes to de-ice the probe depends on several factors, such as icing rate, air and surface temperature and ice type (Montgomerie, 2014). As soon as the ice
is melted, the heating is turned off and ice can accrete on the probe again. Thus, the frequency of ice detections gives the intensity of the ice accretion since build-up and melting of ice on the probe continues for the duration of the icing event.(Persson, 2009) & (Fikke et al., 2006)
The HoloOptics T26 measures ice independently of wind direction by using the four sensors, one for each cardinal direction (north, south, east and west) while the T23 only has one sensor and therefore only detects ice accretion in one direction. This is useful when wind direction is known, as for example when mounted on a nacelle. (Andersen et al., 2011)
Figure 1.5: (Left) T23 & T26 Icing Rate Sensor, (Right) T41 shown on the nacelle at the wind power plant in Härnösand, northern Sweden. Source: HoloOptic.net
The HoloOptic sensors should be mounted on the nacelle of the turbine, and have therefore limited applicability. If the Ice detected on the sensor there is a great probability that ice is accumulated on the blade.
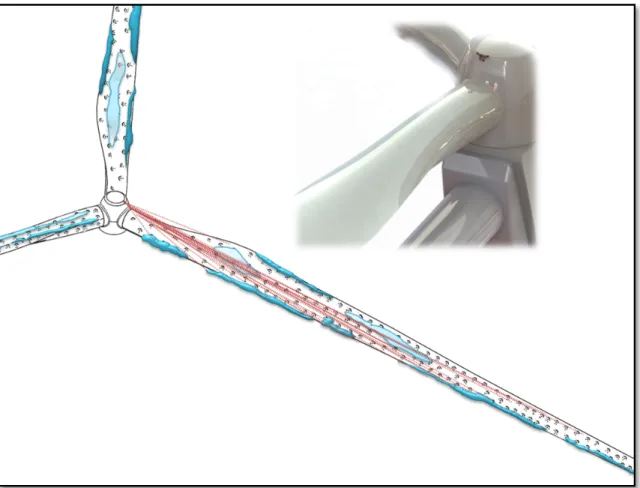
The principal of detection by infrared light could be applicable on the blade, in the event that they are modified such that an IR-emitter & photo detector can be mounted on hub of wind turbine and reflector retro targets sticks on the blades. Figure 1.6 shows IR-emitter & photo detector installed on the hub and reflector retro targets stick on the blades. Accumulated ice shown on the blade surfaces. The field of view of optical instruments (IR-emitter & photo detector) shown in red.
Figure 1.6 : The IR-emitter & photo detector installed on the hub and reflector as retro targets stick on the blades.
1.3.1.2 Stereo imaging from web cameras
For observation of wind turbine blades, two Webcams were installed on the nacelle of the wind turbine. One camera is taking a picture of the blade every 15 minutes (blade detection by video motion detection). The second camera is taking regular pictures of the Ultrasonic anemometer mounted on the nacelle of the wind turbine. With these cameras images, ice accretion on the blades of the wind turbine can be observed and analyzed. (Seifert, Westerhellweg et Kröning, 2003)
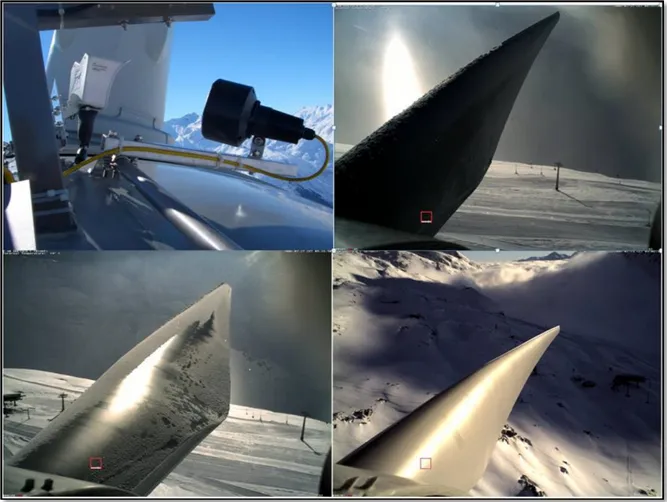
Figure 1.7 : (Top left) Installed camera on the Nacelle, the lamp on the right is for heating purpose. (Top right) rime ice observed on the blade. (Bottom left) rime ice after 45min heating system on, (bottom right) de-iced blade, some little trace of glazed ice remained
on the leading edge. Source : (Cattin, 2015)
Web cameras can be useful during testing of various sensors, and to record the conditions at the wind turbine, but have not yet been demonstrated to be suitable for ice detection for several reasons. In arctic regions there is little light during much of the winter, which requires artificial lighting. This artificial lighting, if in the visible spectrum, can be negative for the visual environmental impact of the wind turbine installation. The second, and perhaps more important reason is the lack of suitable automated image analysis tools, but image analysis is an area in rapid change, which may make this system viable in the near future. The images of web cameras on the nacelle could be used as input for image base modeling which is the subject of this research.
1.3.1.3 Reflection of polarized infrared light, IceHawk®
The IceHawk® system (Jamieson et Ray, 2004) scans a surface by sending a beam of polarized infrared light. It detects ice by analyzing the polarization of the reflected signal. When ice is present, the returned infrared signal is un-polarized. A picture of the scanned surface is computed and shown on the IceHawk display with patches of contamination highlighted in red. The system has the ability to "see through" materials such as de/anti-icing fluid, hydraulic fluid and fuel to detect frozen contaminant build-up underneath. The system can detect any frozen contaminant including snow, frost, slush or ice.
A presence of a polarization altering substance on a specular surface is detected by transmitting light from a single strobe light source to the surface over a transmitting path and receiving the transmitted light from the surface. An intensity of the light is measured in both an optical isolator state and an isolator state by a same detector by delaying the non-isolated return light for a definite period of time before measuring it with the detector. The measured isolated and non-isolated intensities are converted to logarithmic form, range corrected, and compared to reference data established for the specific specular surface being investigated to detect the presence or absence of the polarization altering substance. Attenuation and backscattering effects of scattering and/or absorbing interference in the transmitted light are compensated so that the reference table is entered at the correct point. Using different intensities of transmitted light increases the dynamic range of the system. (Stern, Schaefer et Maali, 2000)
The proposed system designed for aerospace application & could be interesting as wind turbine icing sensor since it could perhaps examine the blades from a distance. The mounting of the sensor such that the pressure side of the blade is seen requires more study, as current systems using polarized light ice detection have a range limitation of less than 30 m that are less than the regular blade length in wind turbine size in cold climate area.
1.3.1.4 Infrared spectroscopy
Ice detection is performed current less at the end of a fiber optic cable, which points out of the blade near the tip, where icing starts. The signals are transferred to the sender/receiver, which is located in the hub. From there, the results may be sent to the installation control and used as ice-warnings. Measurement principle is infrared signals, produced by LEDs (Light Emitting Diodes) (Figure 1.8). The signals are sent through the fiber to the tip, where they are partially reflected, and in the case of icing, characteristically absorbed. Lab results with 50m sensor fibers show a clear recognition of ice and indicate that dirt on the fiber tips leads only to weaker signals but seems to be no problem for ice detection so far. The measurement range is between a few micrometers and a few centimeters (depending on the type of ice). Due to varying signal scattering in different types of ice, the result is always an estimate of a layer thickness mean. Measurements can be made every few seconds and hence provide real-time information of the actual icing status of the blade and allow a fast reaction after initial icing or a completed de-icing procedure. Every sensor unit can be equipped with up to three fibers, monitoring three blades or different spots in one blade (Homola, Nicklasson et Sundsbø, 2006)
Figure 1.8: (Left) Infralytic Sensor tip with sender/receiver, (Right top) Sketch of rotor hub, (Right down) Sensor location in the blade. Source Brochure: IcesensorInfralytic_EN.pdf
The system using infrared spectroscopy has an advantage in that all electronics and serviceable components are mounted in the hub of the turbine, not on the blades. There are no extra conductors out to the blades, so no additional lightning risk is generated. The point detection is a slight disadvantage, but this can be corrected by having more points under observation. The greatest disadvantage is the difficulty in installing the system in existing blades. This is because the fiber optic cables must be installed during the construction of the blade. This system has already been built by Infralytic. It has been independently tested in an icing wind tunnel with good results (S. Kimura, T. Sato et al., 2005). In addition, the sensor is included in the Swiss Project ‘Alpine Test Site Gütsch: Meteorological measurements and wind turbine performance analysis’ which runs within the COST 727 Action ‘measuring and
forecasting atmospheric icing on structures’, which will test a variety of sensors over a three year period .
1.3.1.5 Reflected light from inside
The ice detector system utilizes a light source, light detector and temperature sensor coupled together for providing signals representative of icing which may be utilized to provide an alarm to the cockpit of the aircraft. Built In Test Equipment (BITE) is also included in the detector system for system failure indication to the pilot of the aircraft.(Federow et Silverman, 1994)
Using reflected light from an ice covered window out from the blade is a very simple idea that would probably work well for rime ice, but is expected to have difficulties with very thin layers of clear ice, for example freezing rain. This is due to the fact that thin layers of clear ice need not disturb the optical path.
1.3.1.6 Fiber optic cable with special clad
Finally the last optical ice detection system which we found in the market is an ice sensor for the remote rapid indication of ice formation or the presence of ice is a fiber optic "switch", activated by ice but not by water, and based on the difference in optical properties between water and ice. The approach is to construct a "fiber optic" which itself is the ice sensor. The fiber optic sensor (FOS) is designed so that no light is transmitted when water is present but as soon as ice begins to form, light is relayed. Thus ice switches on the light- In addition, limited quantitative information can be made available on the rate of ice formation. Alternatively the sensor can be formed of another type optical waveguide instead of an optical fiber. The ice sensor is formed by placing spaced stripes of a clad material on a fiber optic core, or other waveguide structure, where the clad has a refractive index close to ice and the core has an index greater than the clad but less than water. It is best to index match the core to the clad for optimal transmission when ice forms in the gaps between the clad stripes. The advantages of the ice sensor include: specific, sensitive, real-time response,
small, lightweight, inexpensive, requires no line-of-sight, EMI immune, rugged and flexible.(Klainer et Milanovich, 1990)
The Fiber optic cable with special clad as Infrared spectroscopy has disadvantage such is the difficulty on installation the sensor in existing blades. This is because the fiber optic cables must be installed during the construction of the blade.
1.4 Limitations or disadvantages of current ice detection systems
Icing detection of wind turbines has different requirements than detection of icing on aircraft or for meteorological equipment purposes. Many of detection methods developed for icing detection on aircrafts and this is evident when sensors considered for other purposes do not perform adequately when mounted on wind turbines.
The all mentioned sensors could detect ice formation within an area or on the point just if there was a sensor installed in the area. The sensing elements/electrodes have the difficulty in installing on existing blades. This is because the sensor or the communication cables must be installed during the construction of the blade. In addition mounting of icing sensor on the Blades requires several points should be considered during the design phase. Such as:
• Sensor Installation during turbine’s blades manufacturing; • Lightning protection;
• Difficult access to the failed sensor;
• Problems of mounting a sensor on the flexing blade’s material.
By the previous reviews about the icing sensor for the wind turbine any of the proposed
methods
could not
detect:• Real distribution and volume of ice on the blade’s surface; • Shape & Geometry of ice on the blade;
• The real shape of Ice in time of measurement (Geometry of modified airfoil); • Estimated Mass and Thickness of Ice in measuring time.
Thus installing the ice detection sensors for an existing wind turbine is impossible or more
costly if applied.
Table 1-1 shows the brief review from the studied ice detection systems
Table 1.1: Optical ice detection system in market Existing Optical ice detection system System to be integrate in WT design and make Thin ice detection Sensor on the blade surface Ice distribution on the blade’s surface Geometry of modified blade’s airfoil Direct detection by Reflective Light Sensor, HoloOptics No. Can be installed on exiting WT yes No. to be .installed on the nacelle No no Stereo imaging from web cameras No. Can be installed on exiting WT Depend on the camera optical resolution and field of view, (Artificial light is needed) No. to be .installed on the nacelle No No Reflection of polarized infrared light, IceHawk® Yes. Costly or impossible to integrate for existing WT Yes-range limitation of
less than 30 m yes No No
Infrared spectroscopy Yes. Costly or impossible to integrate for existing WT Yes-in sensor position Yes No No Reflected light from inside Yes. Costly or impossible to integrate for existing WT Yes-in sensor position Yes No No Fiber optic cable with special clad Yes. Costly or impossible to integrate for existing WT Yes-in sensor position Yes No No
Chapters 2 is a literature review from related research on our proposed method and chapter 3 reviews a new methodology for measurement by photogrammetric scanning of an installed wind turbines' blades. By this methodology the real distribution of ice's mass on the blades surfaces measured by verifying of the shape and dimension of iced rotor blades against CAD or master data of rotor blades . CAD data of master model of wind turbine blade generate by 3D reverse engineering base on the photogrammetry measurement of clean installed blades with appropriate level of details.
This new approach, once completed, can be considered as new ice detection system which has more advantages than all previous systems such as:
• A cost effective way for ice measurement that can be applied on any size of wind turbine.
• Extraction of real shape of ice in time of measurement (Geometry of modified airfoil); • In the proposed method, the required retro targets (printed patterns) could be added any
time to existing wind turbine’s blades and no sensors need to be installed on flexible blade’s material.
• Regarding the shape of blades and the measurement area, the photogrammetric object recording could be applied by dynamic camera (Camera on RC Drone) which is the proposed methods in Chapter 3 for measurement the thickness of ice on all cross section of wind turbine blade. If the object recording is applied by fixed Camera Sensor on wind turbine hub or nacelle, the overlapped photos content limited information and the results cover a small region of WT’s blade. This option is out of scope of this study.
CHAPTER 2
INTRODUCTION TO CLOSE RANGE PHOTOGRAMMETRY & IMAGE BASE MODELING
Three-dimensional models are being actively used in various fields like CAD/CAM/CAE, quality inspection, urban planning, emergency response systems and cultural heritage documentation, as a handful tools. In reconstructing of these 3D models, a large variety of data from different sources is utilized such as aerial and terrestrial laser scanning, stereo image pairs, range images and set of overlapping images. The basic of all these methods is
Photogrammetry.
Photogrammetry is the science of making measurements from photographs. 'photo' – light;
'gram' – drawing; 'metry' – measurement.
The output of photogrammetry is typically a map, drawing, measurement, or a 3D model of some real-world object or scene. Many of the maps we use today are created with photogrammetry and photographs taken from aircraft (Aerial Photogrammetry). (Wikipedia, 2015)
In Close-range Photogrammetry, the camera is close to the subject and the output is drawings, 3D models, measurements and point clouds. Nowadays cameras are used to model and measure buildings, engineering structures, forensic and accident scenes, mines, earth-works, stockpiles, archaeological artifacts, film sets, etc. This type of photogrammetry (CRP for short) is also sometimes called Image-Based Modeling.
Image-Based 3D modeling has been described by (Remondino et El‐Hakim, 2006) as a photogrammetry process that begins with data collection and finally results in 3D models capable of being visualized and analyzed interactively on a computer for various operations. Our research on “Ice Measurement on the Wind Turbines’ blades by Close-Range
Photogrammetry Methods” focuses on the ice modeling process using point clouds obtained through structure from motion to reconstruct the shape of ice on the blades as a polygonal mesh model. This is a new topic of research in ice detection methods of the wind turbine generators and computer but now because of operational complexity for accessing to the real case study, there is still a long way to go in making the process completely free from user interaction. Here there is a brief review of the photogrammetry process and the technical requirements for photogrammetric process.
2.1 The photogrammetric process
Photogrammetry encompasses methods of image measurement and interpretation in order to derive the shape and location of an object from one or more photographs of that object. In principle, photogrammetric methods can be applied in any situation where the object to be measured can be photographically recorded. The primary purpose of a photogrammetric measurement is the three dimensional reconstruction of an object in digital form (coordinates and derived geometric elements) or graphical form (images, drawings, maps). The photograph or image represents a store of information that can be re-accessed at any time. It is therefore necessary to describe the optical process by which an image is created. This includes all elements that contribute to this process, such as light sources, properties of the surface of the object, the medium through which the light travels sensor and camera technology, image processing and further processing.
Figure 2.1 simplify and summarizes this sequence. The left hand side indicates the principal instrumentation used whilst the right hand side indicates the methods involved. Together with the physical and mathematical models, human knowledge, experience and skill play a significant role. They determine the extent to which the reconstructed model corresponds to the imaged object or fulfills the task objectives.
Figure 2.1: The photogrammetric process: from object to model ((Luhmann, Robson et al. 2006), page 3)
The photogrammetric procedure has changed fundamentally with the development of digital imaging systems and processing. By utilizing appropriately targeted object points and digital line image recording, complex photogrammetric tasks can be executed within minutes on-site. A fully automatic analysis of the targeted points replaces the manual procedures for orientation and the special photogrammetric measuring instruments are no longer required and are replaced by standard computing equipment. The high degree of automation also enables non-specialist users to carry out the photogrammetric recording and data evaluation.
Close range photogrammetry based on digital image processing of the scanned imagery, offered the potential of measurement precision to 1:500,000 with respect to the largest object dimension. Particularly for outsized volume objects (e.g. >10 m diameter) with a high number of object points, photogrammetry could became a standard method for complex 3D measurement tasks (Luhmann, 2010).
2.1.1 Photogrammetry, recording and analysis procedures
In general, photogrammetric systems supply three dimensional object coordinates derived from image measurements. From these, further elements and dimensions can be derived, for
example lines, distances, areas and surface definitions, as well as quality information such as comparisons against nominal design dimensions (master CAD data) and machine control data (measured data). In addition, the recorded image is an objective data store, which documents the state of the object at the time of recording. The visual data can be provided as corrected camera images or graphical overlays (Figure 2.2).
Figure 2.2: Typical photogrammetric products ((Luhmann et al., 2006), page 12)
(Luhmann et al., 2006) show the principal procedures in close range photogrammetry for both Digital & Analogue photography in Figure 2.3 which the four step of this process (Recording, Preprocessing, Orientation & Measurement & Analysis) are briefly summarized in the Annex I.
Figure 2.3: Recording and analysis procedures (red: can be automated in a digital system) ((Luhmann et al., 2006), page 3)
2.1.2 Technical components of photogrammetric process
The successful use of photogrammetry in industry requires a number of technical components that form an efficient and economic system. The following list summarizes these components and related technical issues (Luhmann, 2010):
• imaging sensor: resolution (number of pixels), available lenses, acquisition and data transfer speed, camera stability, synchronization, data compression, etc;
• targeting and illumination: representation of interesting object features, target shape and size, wave length of light sources, restrictions to object access, illumination power and measurement volume;
• imaging configuration: number of camera stations, desired measurement accuracy, network design, redundancy, robustness, self-calibration ability, datum definition and object control, self-control of orientation and calibration;
• image processing: automation of target recognition and identification, sub-pixel measurement of target center, multi-image matching approaches, feature tracking, and handling of outliers and scene artifacts;
• 3D reconstruction: methods for determination of 3D coordinates (e.g. spatial intersection, bundle adjustment) and error statistics; • data interfaces: integration into CAD/CAM environments, machine and data interfaces, user interaction and displays, etc; and
• Verification of accuracy: reference bodies, reference data, standards and guidelines, and acceptance tests.
The above listed topics show that appropriate design, setup and operation of close-range industrial photogrammetry systems form a complex task. The feasibility of a solution is not only a question of technical issues but also a function of required cost-performance ratio, system support, documentation, quality assurance and interdisciplinary skills. In the following, the image base modeling and structure from motion as chosen photogrammetry methods for our project are reviewed.
2.2 Introduction of image base modeling
Image based modeling is an off-line Photogrammetry process by which information from two or more images is extracted to produce a three dimensional model for an object. Image based modeling provides flexibility in terms of different viewing angles and positions while being very economic. Color and texture information is also captured in the data. Images can be acquired using complex cameras or sensors applied in photogrammetry or using consumer cameras.
Three-dimensional reconstructions are commonly visualized as mesh models. These models may have roughed boundaries in case of sparse point cloud, resulting in a model that is difficult to edit. Figure 2.4 show the sample of three-dimensional reconstructions of a complex object in form and surfaces.
Figure 2.4:Three-dimensional reconstructions by image base modeling and Structure from Motion (SfM). Left: overlapped sequential images, Middle: Camera position and Camera
2.3 Structure from Motion
The Structure from Motion (SfM) is described with the recovery of the three dimensional geometry of the scene (the structure) when observed through a moving camera (the motion). Sensor data is either a video or a set of pictures; additional information, such as the calibration parameters, can be used if available. The result is generally an unstructured 3D point cloud, consisting of the key points, which were identified and tracked, in the scene and a set of camera matrices, identifying position and direction of each picture with respect to an arbitrary reference frame. In image base modeling by Structure from Motion (SfM), the point clouds could have the properties of color and texture may be increased the accuracy of the results which are not available in laser scanning.
In traditional photogrammetric approach, 3D location and camera position were required as a priori information. SfM solves this problem by using key points in the images for estimating scene geometry, camera position and orientation. The key points are the common features invariant to scale and illumination that could be identified in the image pairs by applying a method called “Scale Invariant Feature Transform” SIFT (Lowe, 2004). However, generally SfM results are as point cloud in an optional coordinate system with no scale information. Hence, transformation to absolute coordinate system is achieved by 3D similarity transform using the primitive features in the blade (Cylinder axis in base of blade as pitch axis) and the coded retro targets in place of transformation constraint points as Ground Control Points (GCP).
The reconstruction of surfaces from oriented points has a number of difficulties in practice because of non-uniform sampling points in positions and normal are generally noisy due to sampling inaccuracy and scan misregistration.(Kazhdan, Bolitho et Hoppe, 2006)have shown that surface reconstruction can be expressed as a Poisson problem, which search for the indicator function that best fits with a set of noisy, non-uniform observations as accreted ice, and have demonstrated that this approach can robustly recover fine detail from noisy real-world scans.
2.4 Poisson surface reconstruction
The reconstruction of a point cloud, with oriented points, to generate its mesh is well-studied problem that has multiple approaches. The main problems when we have a point set and we want to reconstruct the mesh are:
• The vertices on the point set are not uniformly distributed over the model surface. • The position of the vertices and its normal are generally noisy because of the
Inaccuracy of the tools or inherited errors during the scanning.
• There are parts of the model surface that can be empty of data. Typically, when the tool can get that information because it is not accessible.
One of existing approaches that tries to deal with these difficulties is the Poisson Surface Reconstruction. (Kazhdan, Bolitho et Hoppe, 2006) express the Poisson Surface Reconstruction can also infers the topology of the unknown surface, fits the noise on the data accurately and fills the holes that are not holes in the initial model. The results of a Poisson Surface Reconstruction tend to be smooth and watertight. In contrast, of other approaches, the Poisson Surface Reconstruction is a global solution that considers all the data at once without using heuristic techniques or blending.
(Chauve, Labatut et Pons, 2010) showed that in 3D reconstruction, most often the three-dimensional model, the point cloud index or render efficiently by Poisson Surface Reconstruction. Therefore, if simplified geometry is derived from the mesh models, we risk increasing the already existent error on further processing. Moreover, mesh models for the iced zone tend to look unpleasant when input point cloud has high noise level (Schindler, Worstner et Frahm, 2011). Our case study is the iced blades, which the shape of blades as master data are invariant but the accumulated iced on the surface, have arbitrary and random shape due the position and climate condition.
2.5 Point cloud reconstruction
Point Cloud data is used as input in our research to reconstruct the ice geometry on the blades. This Point cloud is obtained through a sequence of images. In this section, we talk about the process of generating point cloud from sequence of images.
A sparse 3D scene structure is derived from a sequence of overlapping images through Structure from Motion (SfM). (Westoby et al., 2012) have described in their paper implementation of SfM in geosciences applications for generating Digital Elevation Model (DEM) from overlapping images. Traditionally, 3D location and camera position were required as a priori information for scene reconstruction. SfM solves this problem by automatically estimating scene geometry, camera position and orientation. This is achieved by identifying common features across image pairs. These features, also called key points, are detected by applying robust feature-point detection algorithms, like Scale Invariant Feature Transform (SIFT) (Lowe, 2004) and Speeded Up Robust Features (SURF) (Bay et al., 2008). Both algorithms can detect features without being affected by variation in scale, rotation, translation and illumination. The detected features are matched in image pairs using Approximate Nearest Neighbors (ANN) algorithm and Random Sample Consensus (RANSAC) algorithm removes the outliers (Schnabel, Wahl et Klein, 2007) . Using these detected features in image pairs; image or camera orientation is recovered by applying Epipolar geometry (Figure 2.5 (a)). This relationship between the two views is represented in matrix form, referred as Fundamental matrix. Fundamental matrix can be computed by 8-point correspondence algorithm (linear solution) or 7-8-point correspondence algorithm (non-linear solution). Using fundamental matrix we can compute relative projection (rotation and translation) matrix for each camera pose. The location of common features after applying the projection matrix is triangulated which results in a sparse 3D scene reconstruction (Musialski et al., 2013).
The described process could be scaled to generate sparse cloud for multiple photographs, as shown in the figure 2.5 (b). This is referred as Structure from Motion from 3D scene