Performance evaluation of equipment used for volumetric water content
measurements
ABDELKABIR MAQSOUD
1*, PHILIPPE GERVAIS
1, BRUNO BUSSIÈRE
1,
VINCENT LE BORGNE
21
Research Institute on Mines and Environment
University of Quebec in Abitibi-Temiscamingue
675, 1
stAvenue, Val-d’Or (Québec) J9P 1Y3
CANADA
2
GKM Consultants
2141 Nobel· Suite 101 · Sainte-Julie (Québec) J3E 1Z9
CANADA
*Abdelkabir.maqsoud@uqat.ca
Abstract: Various methods can be used to evaluate in situ volumetric water content; however, when continuous
measurements are required, only dielectric methods can be used. For equipment based on these methods, in the mining environment and particularly in environments having high sulfide contents (or acid-generating minerals), the accuracy of measurements can be affected by the chemistry of the solid and liquid phases. To evaluate the real impact of water chemistry and mineralization on volumetric water content measurement, three instruments were tested on five materials with varying sulphur contents and two types of water mineralization. The results of these investigations show that: i) increasing sulfur content of mine tailings increases the response output of the tested probes; ii) the obtained volumetric water contents are systematically higher than the real volumetric water contents obtained gravimetrically; iii), time-domain reflectometry probes are able to provide measurements in materials with high sulphur contents; and iv) 5TM and GS3 probes are not suitable for use in reactive materials with higher sulphur contents.
Keywords: volumetric water content, sulphur content, dielectric method
1 Introduction
The extraction of mineral resources plays an important role in the Canadian economy. However, ore extraction generates large amounts of waste. These wastes include overburden soil, waste rocks extracted to reach the ore body, and fine-grained mill tailings produced by the ore processing plant [1]. Mine wastes have the potential to adversely impact the environment if not properly managed. Special attention is required when mine wastes contain iron sulfide minerals such as pyrite and pyrrhotite. The oxidation of sulfides by atmospheric oxygen tends to acidify meteoric waters; this phenomenon is known as acid mine drainage (AMD) or acid rock drainage (ARD). In these situations, actions must be taken at the mine site to prevent environmental impacts caused by AMD
[e.g., 1, 2, 3]. In a humid climate, monolayer cover with an elevated water table (EWT) and cover with capillary barrier effect can be used for mine site reclamation. Performance evaluations of such engineered covers are largely based on their ability to limit the flux of oxygen reaching the reactive tailings. When the degree of water saturation is high (in the moisture retaining layer in the case of CCBE or in the reactive tailings in the case of the EWT), the oxygen flux can be considered as negligible, and consequently, the production of the acid mine drainage is inhibited.
For these reasons, the volumetric water content constitutes a key parameter which should be evaluated as accurately as possible.
This paper provides a brief description of volumetric water content measurement techniques. This is followed by a presentation of the materials
and methods used in this study, the measurement results, and the implications of the data presented in this study.
2
Volumetric
water
content
measurements
The in situ performance of large-scale mono and/or multi-layer covers constructed on tailings impoundments can be monitored using instruments aimed at obtaining key characteristics [e.g., 4, 5], including volumetric water content (VWC) and matrix suction in the cover layers, and oxygen flux (and/or oxygen concentration) beneath the cover. There are a variety of methods for evaluating in situ volumetric water content [6], which can be divided into three categories: 1) gravimetric methods, which are mainly used for sensor calibration [7]; 2) methods based on high-energy ray sensors produced by a radiation source [8, 9]; and 3) dielectric methods [10] through which volumetric water content is estimated by measuring the soil permittivity (Kab; electromagnetic property). When
continuous measurements are required for the evaluation of cover performance, only dielectric methods can be used. The equipment based on dielectric methods are designed for natural environments; however, in mining environments, especially those with high sulfide contents (or acid-generating minerals), the measurement accuracy can be affected by the chemistry of the solid and liquid phases [11, 12, 13, 14, 15], as well as by temperature [16, 17, 18, 19, 20, 21, 22].
In this case, it is important to evaluate the real impact of water chemistry and mineralization on the measurement of volumetric water content, and furthermore, to a find a way to correct these measurements. Additionally, the equipment used for VWC measurements should be evaluated for these specific conditions with the objective of selecting the best methods.
3
Materials and experimental
setup
3.1 Materials properties
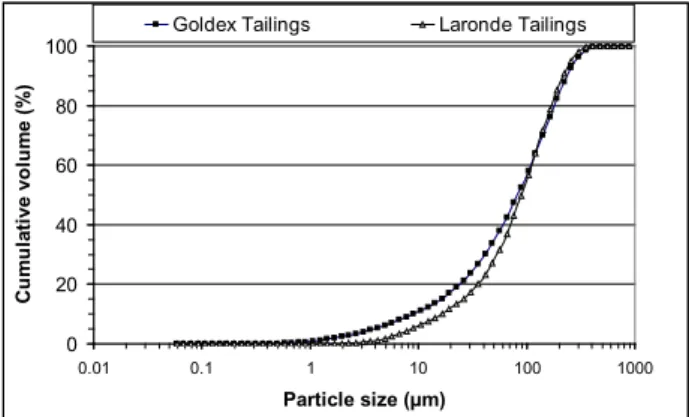
Two tailings materials, taken from the Goldex and Laronde mine sites, were used in this study. Their grain size distributions were determined using a Malvern Mastersizer S 2000 laser particle size
analyser, and are presented in Fig. 1.
The grain size distributions for both materials are typical of hard rock tailings [1]. A slight difference
can be observed in the lower part of the grain size distribution. This difference can be characterized by the parameters: D10 (diameter of particles at 10%
passing), D60 (diameter of particles at 60% passing),
and Cu (coefficient of uniformity; see Table 1).
Fig. 1: Grain size distributions of the Goldex and Laronde tailings
Table1. Main characteristics of granulometry of two studied tailings
Goldex
tailings Laronde tailings D10 (µm) 9.0 16.3
D60 (µm) 109.1 111.3
Cu (D60/D10) 12.2 6.8
The specific gravity, Gs, was determined using a
helium pycnometer, 1330 AccuPyc from Micromeritics, in accordance with the ASTM
C128 standard. Gs was determined to be 3.1 for the
Laronde tailings and 2.7 for the Goldex tailings. The tailings’ sulphur contents were determined using an ELTRA carbon / sulphur analyzer, and corresponded to 0.1% and 16.4% for the Goldex and Laronde tailings, respectively.
Based on the sulphur content, the Goldex tailings are considered a non-reactive material. These two materials were used to prepare three tailings mixtures at sulphur contents of 5.4%, 7.9%, and 10.7%.
3.2 Experimental setup
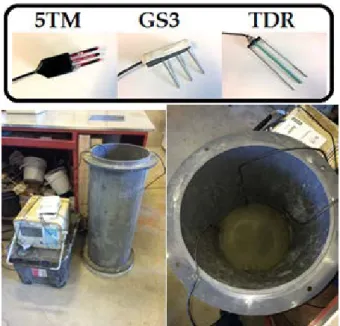
Experimental column tests were built and instrumented for VWC measurements. Three types of sensors were selected: the 5TM and GS3 frequency domain (FD) probes manufactured by Decagon Devices, and time-domain reflectometer (TDR) probes manufactured by Campbell Scientific (see Fig. 2). These probes were installed at the same level in each column, which were 30 cm in diameter
0 20 40 60 80 100 0.01 0.1 1 10 100 1000 Particle size (µm) Cu mu lat ive vo lu me (%)
and 30 cm in height. Each column was equipped with a porous plate at the base for the control of suction (see Fig. 2).
Fig. 2: (Top) tested probes, and (Bottom)
experimental setup
Five columns were filled with tailings with known sulphur contents (0.1%, 5.4%, 7.9%, 10.7%, and 16.4%). Each column was then subjected to varying degrees of saturation: 30%, 50%, 70%, 85%, and 100%. For each degree of saturation, material was sampled around the sensors for gravimetric water content evaluation.
Two types of water were also tested; i.e., demineralized water and process water from Laronde mine. Their electrical conductivities were 6 and 5900 µS/cm, respectively.
4 Investigation results
In this section, the results are presented with the objective of evaluating the effect of sulphur content and water mineralization on volumetric water content measurement using the tested equipment.
4.1 Sulphur content effect
Results are presented individually for the GS3, 5TM, and TDR probes for each of the five tested sulphur (S) contents. Fig. 3, 4, and 5 show the output signal and the volumetric water content obtained directly using the manufactured calibration curve. Porosity is illustrated using a dashed line.
4.1.1 5TM probe
Measurement results obtained using 5TM probes for various water contents and sulphur contents are presented in Fig. 3. This figure shows that, for the same VWC, instrument output increases with increasing sulphur content.
At the highest sulphur content, 16.4%, a stabilisation of the output signal, despite increasing volumetric water content, was observed. Finally, the volumetric water contents obtained using manufacture’s equipment calibration are systematically higher than the real volumetric water contents, which were obtained using gravimetric method.
Fig.3: Volumetric water contents obtained using 5TM probes (dashed line corresponds to the porosity of the material)
4.1.2 GS3 probe
The data obtained using GS3 probes at various water and sulphur contents are presented in Fig. 4. This figure shows that the GS3 probes had a behaviour similar to the 5TM probes.
Fig.4: Volumetric water contents obtained using GS3 probes 0 0.1 0.2 0.3 0.4 0.5 0.6 0.7 0.8 0.9 1 0 1 2 3 4 5 6 7 8 9 10 V W C us ing ins trum ent Ins trum en t out put (V )
Volumetric Water Content Using Gravimetric Method 5TM Instrument signal (V) VWC using instrument (5TM)
0,1 % S 5,4 % S 7,9 % S 10,7 % S 16,4 % S 0 0.1 0.2 0.3 0.4 0.5 0.6 0.7 0.8 0.9 1 0 1 2 3 4 5 6 7 8 9 10 Vol um et ri c w at er con ten t u sin g in st ru m en t Ins tr ume nt o ut put (V )
Volumetric Water Content Using Gravimetric Method
GS3 instrument signal (V) VWC using instrument (GS3)
Additionally, the VWC data obtained using the manufacture’s equipment calibrations are higher than those given by the 5TM probes.
4.1.3 TDR probe
Measurement results obtained using TDR probes for various water and sulphur contents are presented in Fig. 5. This figure shows that, at the same VWC, instrument output increases when the sulphur content increases. As with the other instruments (5TM and GS3), the VWCs obtained using manufacture’s equipment calibrations are systematically higher than the real volumetric water contents obtained using gravimetric method. VWCs obtained using the TDR probes are in the same range than those obtained using the GS3 probes. Finally, the output signal was observed to increase with increasing VWC at the different sulphur contents.
Fig.5: Volumetric water content measurements obtained using TDR probes
4.2. Water mineralization effects
To evaluate the effect of water mineralization on the VWC measurements, tests were performed using demineralised water (6 µS/cm) and water with high electrical conductivity (5900 µS/cm). Two materials were tested; i.e., tailings from the Goldex and Laronde mine sites with sulphur contents of 0.1% and 16.4%, respectively.
The results of these tests are presented in Fig. 6, 7 and 8 for the 5TM, GS3, and TDR probes, respectively. In the Goldex tailings (0.1% S), the effect of water mineralization was very limited in its effect on all tested probes. However, in the Laronde tailings (16.4% S), the impact of water mineralization was observable for measurements performed using 5TM and GS3 probes, but limited for the TDR probes.
Fig.6: The effect of water mineralization on the measurement of VWC using 5TM probes
Fig.7: The effect of water mineralization on the measurement of VWC using GS5 probes
Fig.8: The effect of water mineralization on the measurement of VWC using GS3 probes
5 Conclusion
Evaluation of the performance of three instruments ability to accurately measure VWC at varying sulphur contents allowed for the following conclusions:
• As the sulphur content of mine tailings increases, the response of the output of all tested VWC probes increased. However, for the 5TM and GS3 probes, no variation in instrument response was observed in the column with 16.4% S, for VWCs higher than 0.22 (stabilization). Based on these results, the 5TM and GS3 probes are likely
0 0.1 0.2 0.3 0.4 0.5 0.6 0.7 0.8 0.9 1 0 1 2 3 4 5 6 7 8 9 10 V W C us ing ins trum ent Ins trum en t out put (V )
Volumetric Water Content Using Gravimetric Method 5TM Instrument signal (V) VWC using instrument (5TM)
0.1 % S 5.4 % S 7.9 % S 10.7 % S 16.4 % S 0 1 2 3 4 5 0.10 0.15 0.20 0.25 0.30 0.35 0.40 Volumetric Water Content Using Gravimetric Method
5TM Ins tr um ent out put (V
) Laronde 6 µS/cmGoldex 6 µS/cm Laronde 5900 µS/cmGoldex 5900 µS/cm
0 1 2 3 4 5 0.10 0.15 0.20 0.25 0.30 0.35 0.40 Volumetric Water Content Using Gravimetric Method
G S3 Ins tr um ent out put (V
) Laronde 6 µS/cmGoldex 6 µS/cm Laronde 5900 µS/cmGoldex 5900 µS/cm
0 10 20 30 40 50 0.10 0.15 0.20 0.25 0.30 0.35 0.40 Volumetric Water Content Using Gravimetric Method
TD R Ins tr um ent out put (k A ) Laronde 6 µS/cm Laronde 5900 µS/cm Goldex 6 µS/cm Goldex 5900 µS/cm
not suitable for use in reactive materials with such high S contents.
• When using the manufacture’s calibration equipment, the obtained VWCs were systematically higher than the real VWCs, which were obtained gravimetrically. Thus, this overestimation of VWCs could result in the overestimation of cover performance. • Despite the overestimation of VWCs, the
TDR probes did provide measurements in materials with high sulphur contents.
• The impact of water mineralization on the VWC measurements was similar to that of sulphur content, although, more limited. The data obtained during this study will be used to build a calibration curve for each of the tested probes, in which the S content will be considered. This calibration curve will have practical application, both in the field as well as in the laboratory, and will allow for a better estimation of volumetric water contents.
Acknowledgments
This study was funded by the Natural Sciences and Engineering Research Council of Canada and by the industrial partners of the Research Institute on Mines and Environment (RIME) - University of Québec in Abitibi-Témiscamingue (UQAT) - Polytechnique Montréal, including: Agnico Eagle Limited, Canadian Malartic Mine, Iamgold Corporation, Raglan Mine-Glencore, and Rio Tinto Fer and Titane Inc.
References:
[1] M. Aubertin, B. Bussière, L. Bernier,
Environnement et gestion des résidus miniers,
CD-ROM, Les Presses internationales Polytechnique, 2002, Montréal
[2] GM. Ritcey, Tailings Management, Problems
and Solutions in the Mining Industry, 1989,
Amsterdam: ELSEVIER.
[3] Steffen, Robertson and Kirsten Inc. (SRK)
Draft acid rock drainage technical guide, Volume I. Report prepared for British Columbia Acid Mine Drainage Task Force,
1989, Bi-Tech Publishers Ltd., Vancouver, B.C.
[4] A. Maqsoud, B. Bussière, M. Mbonimpa, M. Aubertin, WG. Wilson, Instrumentation and monitoring of covers used to control Acid Mine drainage. Proceeding of the Mining Industry
Conference, 2007, CIM, Montréal CD-rom.
[5] M. Aubertin, T. Pabst, B. Bussière, M. James, M. Mbonimpa, M. Benzaazoua, A. Maqsoud,
A critical review of reclamation techniques for mine wastes disposal sites producing acidic effluents, Compte rendu de symposium, 2015, Rouyn-Noranda, Canada.
[6] Muñoz-Carpena R (2015). University Florida http://citeseerx.ist.psu.edu/viewdoc/download? doi=10.1.1.514.6862&rep=rep1&type=pdf. [7] WH. Gardner, Water content, In: Klute, A.
(Ed.), Methods of Soil Analysis, Part 1, 2nd Edition, 1986, ASA and SSSA, Madison, WI,
pp. 494–544
[8] SR. Evett, L K Heng P, Moutonnet, M.L. Nguyen, In: S.R. Evett, L.K. Heng, P. Moutonnet, and M.L. Nguyen (eds.). Field estimation of soil water content: A practical guide to methods, instrumentation, and sensor technology, IAEA-TCS-30. Intl. Atomic Energy Agency, Vienna, Austria, 2008, 123– 129.
[9] AL. Ward, R. Witman, http://www.pnl.gov/main/publications/external/ technical_reports/PNNL, 2009, -18539.pdf [10] G C. Topp, JL. Davis, AP. Annan,.
Electromagneticd etermination of soil water content: Measurements in coaxial transmission lines, Water Resour. Res., 6(3), 1980, 574-582. [11] DA. Robinson, JP. Bell, C.H Batchelor, The influence of iron minerals on the determination of soil water content using dielectric techniques. J. Hydrol (Amsterdam) 161, 1994, 169–180.
[12] OH. Jacobsen, P. Schjonning, A laboratory calibration of time domain reflectometry for soil water measurement including effects of bulk density and texture, Journal of Hydrology
151, 1993, 147-157.
[13] C. Dirksen, S. Dasberg 1993. Improved calibration of time domain reflectometry soil water content measurements, Soil Sci. Soc. Am.
J,57, 1993, 660- 667.
[14] RL. Van Dam, W. Schlager, MJ. Dekkers, A. Huisman, Iron oxides as a cause of GPR reflections, Geophysics 67, 2002, 536–545. [15] S.P Friedman, Soil properties influencing
apparent electrical conductivity: a review.
Computers and Electronics in Agriculture, 46,
2005, 45–70
[16] RL, Baumhardt, RJ. Lascano, SR Evett, Soil material temperature and salinity effects on calibration of multisensor capacitance probes,
Soil Sci. Soc. Amer. J. 64, 2000, 1940-1946
[17] B. McMichael, RJ. Lascano, Laboratory evaluation of a commercial dielectric soil water sensor, Vadose Zone J, 2, 2003, 650–654.
[18] HR. Bogena, J.A. Huisman, C. Oberdörster, H. Vereecken, Evaluation of a low-cost soil water content sensor, J. Hydrol, 2007, 344:32–42. [19] F. Kizito, CS. Cambell, GS. Cambell, DR
Cobos, BL. Teare, B. Carter, JW. Hopmans, Frequency, electrical conductivity and temperature analysis of low-cost moisture sensor. J. Hydrology, 352, 2008, 367-378. [20] A. Fares, M. Saffeq, DM. Jenkin, Adjusting
Temperature and Salinity Effects on Single Capacitance Sensors, Pedosphere 19, 2009, 588–596.
[21] U. Rosenbaum, JA. Huisman, A. Weuthen, H. Vereecken, HR Bogena, Sensor-to-sensor vari-ability of the ECH2O EC-5, TE, and 5TE sensors in dielectric liquids. Vadose Zone
Journal, 9, 2010, 181–186.
[22] W. Qu, HR. Bogena, JA. Huisman, H. Vereecken, 2013. Calibration of a novel low-cost soil water content sensor based on a ring oscillator, Vadose Zone J., 12, 2013.