Jan Horst KEPPLER and Michel CRUCIANI Centre de Géopolitique de l'Energie et des Matières Premières (CGEMP) Université Paris – Dauphine
Pôle « Economie de l’énergie » (CGEMP )
08
Autom
ne
L a b o r a t o i r e d ’ E c o n o m i e d e D a u p h i n e ( L E D a )
WP n°4
09
Document de travail
RENTS IN THE EUROPEAN POWER SECTOR
DUE TO CARBON TRADING
Abstract:
With the introduction of CO2 allowances, the European Union Carbon Trading Scheme (EU ETS) has
imposed a price on the CO2 emissions of power generating companies. In line with economic theory,
these companies pass on the costs of allowances and integrate it into the price of electricity. Due to the specific remuneration of electricity supplied at different periods due to fluctuating demand this affects the infra-marginal rents gained by different technologies. This paper provides a methodology for determining the specific interaction of the imposition of such a CO2 constraint on the price-setting
mechanism in the power generation sector, given the context of marginal cost pricing in a liberalized European electricity market. As nearly 100 % of these allowances are allocated for free between 2005 and 2012, previous marginal and inframarginal rents have been profoundly modified since 2005. Building on the proposed methodology, the article provides an empirical estimation of the rents of power producers during Phase I of the EU-ETS (2005 – 2007) according to the different technologies. Finally, the paper assesses the impact on rents of the upcoming switch from free allocation of allowances to auctioning by 2013.
1. Introduction
The European Carbon Trading System (EU ETS) has had enormous impacts on the European power sector, both in terms of electricity prices, as well as in terms of the profits that were earned by both electricity producers and electricity consumers. This paper will analyze the issue of rents or surplus profits for electricity producers generated by the EU ETS as well as the impact on electricity consumers. In particular it shows how European power producers earned over €19 billion of annual carbon rents due to the introduction of the EU ETS. As a closely related question it also treats the impact of switching from a costless allocation of carbon permits to electricity producers (“grandfathering”) to the auctioning of permits as envisioned by the European Commission for 2013 and beyond and planned in legislation recently adopted the Council and the European Parliament.1 In
both cases we will provide empirical estimates on the basis of the best available information on the structure of the European power sector and the costs of generating electricity.
At the heart of the matter is the fact that the introduction of carbon pricing increases the marginal cost of electricity producers and thus increases electricity prices. In the absence of corresponding average cost increases (due to the fact that during Phase I and II allowances were allocated for free), this implies necessarily higher profits per unit of output and increased total profits.2 These increased
profits correspond to a transfer from electricity consumers to electricity producers. Due to the peculiar production structure of the electricity sector, where different sources are ranked in a merit curve according to their variable costs, the extent to which different power generating technologies are affected differs widely. This article provides to our knowledge for the first time a methodology for determining the specific interaction of the imposition of a carbon constraint and the price-setting mechanism in the power generation sector in a comprehensive manner. It also provides empirical estimates of the rents that the creation of the EU ETS engendered for European producers during Phase I and will partly continue to engender after the switch to auctioning in Phase III.
Matters for electricity producers are bound to change dramatically, however, once they will have to pay for their allowances under an auctioning scheme. Again, the impact of auctioning will affect some technologies more than others. With auctioning, coal-fired power producers will be absolutely worse off than before the introduction of the EU ETS. Gas-fired power producers will, of course, be worse off than with a free allocation of permits but will remain better off than before the EU ETS. Oil-fired power generators will neither win or loose compared to the situation ex ante, while nuclear and renewable energies will continue to be far better off than before the introduction of the EU ETS. Contrary to a widely circulated misconception, however, electricity prices will remain unchanged. In the absence of additional compensation mechanisms, electricity consumers will thus neither gain, nor loose from the introduction of auctioning.
1 See “Le ‘paquet énergie et climat’ du 23 janvier 2008 : un tournant pour l’Europe de l’énergie”, by Jan H.
Keppler, Michel Cruciani and Cécile Kérébel, Note de l’Ifri, May 2008.
2 Due to the low price elasticity of electricity demand, the demand response from consumers to higher
electricity prices is equally very low. Any impact on profits from lower outputs can thus be assumed 2nd order.
Chapter 2 will set the general theory of rent transfer between producers and consumers due to an environmental trading scheme for emissions quotas. Chapter 3 will explore the impact of the EU ETS on rents in the European power sector during Phase I in the context of marginal cost pricing in a liberalised European electricity market. Chapter 4 will estimate the impact on the rents of power producers due to switching from a free allocation of quotas to auctioning during Phase III and briefly compare that situation to the introduction of a carbon tax. Chapter 5 will conclude.
2. The General Model of Rent Creation through Carbon Trading: Producers vs. Consumers
The basic model for price and rent formation in emission markets to internalize externalities (such as climate change causing carbon emissions) is succinctly captured in the graph below. In the optimal case with costless allocation of carbon emissions, the political decision-makers will fix the total amount of allowances at point q* where marginal social cost (the cost of global warming) and the marginal cost of abatement (the cost of carbon reductions) are equalized, which will result after trading at the optimal price pc* for a tonne of carbon emissions.
Graph 1: The Situation in the Carbon Market
Euros Optimal
Allocation
Marginal Social Cost
Marginal Cost of (MSC) Control (MCC) A E pc* B 0 q* q tCO2
In equilibrium, this model implies the following impacts on price, quantity, social cost and producer/consumer surplus:
B
Prices: once the price for carbon pc* has been set, prices of the underlying good (electricity produced
by technology i) will increase by pc* multiplied by the carbon emission intensity of technology I (EIi) of a
MWh of electricity, minus a decrease in marginal cost of production due to reduced quantities of production:
∆pi = pi * EIi * pc* -- ∂mci/∂qi*∆qi.3
Quantity (emissions): the quantity of emissions will be reduced from q to q*.
Quantity (electricity): the quantity qi of the electricity produced by technology I will be reduced by the
increase in price times the elasticity of price:
∆qi = qi * є i * ∆pi
Social Costs: social cost will be reduced from area C + D + E to area C.
Joint Producer/Consumer Surplus: the producer/consumer surplus will be reduced from area A + B + C + D to area A + B+ C.
The question of producer and consumer surplus
The preceding exposition is straightforward and well known. What is less well known is how the joint producer/consumer surplus divides into producer surplus (for the marginal producer in an electricity market) and consumer surplus.4 In order to perform this analysis one needs to look at the goods
(electricity) market. Before the introduction of a trading system, producers and consumers benefited from a costless natural rent. This can be thought of as nature providing CO2 absorption services at no
cost. This means that electricity cost less to produce.5 In the graph below, this corresponds to
quantity (qe) and price (pe).
Producers had thus their maximum producer surplus with
3 In the future, we will neglect the second term, which is likely to be small due to the small size of quantity
adjustments with inelastic demand.
4 It is important to recall that the analysis in this subchapter only applies to the marginal producer, i.e., the
producer with the highest variable cost of production who will set the price. The rent for inframarginal base-load producers based on coal or nuclear will be determined in a different fashion (see below in the next sub-chapter for a detailed exposition). The impact on electricity consumers, however, will remain unaffected by these considerations given that the latter only ever face the price determined by the marginal producer.
5 In our analysis we focus on price effects only. In principle, a complete analysis would need to include
quantity effects which are transmitted by the demand function. People usually buy less when prices rise. Not so, however, in the electricity sector where demand elasticities are extremely low. A preliminary analysis of European power consumption between 2005 and 2007 showed stable consumption even in the face of considerable price rises. This inelasticity of demand also implies that the efficiency losses Dc and Dp (see below) will be fairly small.
PS= Ap + BCp + Dp.
Consumers correspondingly had the maximum consumer surplus with
CS= Ac + BCc + Dc.
Graph 2: The Situation in the Electricity Market
Price
New Consumer
Price pe + ∆pi Old Price pe New Producer
Price (net of CO2)
0 qe* qe Electricity (MWh)
Things change with introduction of a carbon market and a carbon price. The price of carbon drives a wedge between what producers receive and what customers pay for electricity. The producer surplus then reduces to Ap and the consumer surplus to Ac. This happens independently of whether (1) allowances are given out for free or (2) allowances are auctioned off or (3) a carbon tax is introduced.
What changes according to the allocation mechanism is the ownership of the monetary rents BCc and BCp, which actually correspond to the areas B and C in the previous graph. It is worthwhile to consider these three cases separately.
Carbon trading with costless allocation of allowances: In this case, BCc and BCp will go to the marginal electricity producers. The new producer surplus is thus:
AC
AP
DC BCC
Producer surplus with carbon trading and grandfathering:
PSCT, G = Ap + BCp + BCc.
The gain (windfall profit) of producers is thus:
WFPCT, G = PSCT, G – PS = Ap + BCp + BCc – Ap – BCp – Dp = BCc – Dp
The new consumer surplus with carbon trading and grandfathering would be:
CSCT, G = Ac.
The loss to consumers is thus:
LCCT, G = CSCT, G – CS = – BCc – Dc
Carbon trading with auctioning or carbon tax: Full auctioning of allowances or, equivalently, a carbon tax would imply that the rents BCc and BCp will go to the State:
WFGCT, A = BCp + BCc.
The producer surplus of the marginal producer would thus reduce to
PSCT, A = Ap.
And the loss to the marginal producer would be
LPCT, A = PSCT, A – PS = Ap – Ap – BCp – Dp = – BCp – Dp.
For consumers, the situation would not change at all. The new consumer surplus with carbon trading and grandfathering would be:
CSCT, A = Ac.
And the loss to consumers is thus:
LCCT, A = CSCT, A – CS = – BCc – Dc
Thus while the situation of electricity consumers would be unaffected, the change between grandfathering and auctioning affects exclusively the distribution of rents between States and producers.
Electricity consumers and price-setting in the electricity sector
One of the key impacts of the EU ETS was breaking the historic alliance based on shared interests (such as avoiding a European carbon tax) between electricity producers and consumers. Electricity producers profited substantially from the introduction of the EU ETS most with free allocation of allowances and, on the whole, will continue to do so under auctioning (see below for empirical estimates). Electricity consumers instead financed these additional rents with neither (a) the possibility of substituting given the high inelasticity of demand nor (b) any compensation such as the allocation of free allowances taken from the contingent of power producers (see below for a detailed discussion of this proposal).6
Given the peculiar price formation mechanism in the electricity sector (see next chapter) producers gained far beyond the monetized resource rents predicted in the general model outlined above. In particular, carbon-free producers gained heavily due to higher prices for electricity. Conversely, electricity consumers paid for more than the cost of internalizing the environmental impact. In other words, in an optimally and efficiently regulated system that would minimize the costs to achieve a given amount of carbon reductions, the amounts required would be far less than the current surplus costs to electricity consumers generated by the EU ETS. During Phase I, given that there was over-allocation of allowances, the true cost of carbon reductions was zero. Instead electricity consumers transferred more than €12 billion per year to electricity producers due to the EU ETS (see assessment in Table 2 below).
One can also approach the issue in another manner. Before introduction of the EU ETS, the environmental rent embodied in costless carbon emissions profited electricity consumers in the form of low electricity prices. It is obvious, that the imposition of a quantitative constraint on these emissions should raise prices and thus reduce the implicit rent of electricity consumers. What planners of the EU ETS did not address is the particular price-setting mechanism of the electricity sector, which needs roughly half of the allowances emitted under the EU ETS.
6 The issue of producer and consumer surplus was first detailed by Sven Bode (2004), however without
including the impact of the specific price formation in the electricity sector. He also concluded that the electricity sector as a whole is to benefit from the introduction of the trading scheme as long as the allowances are distributed free of charge.
In normal industrial sectors, technologies are by and large homogenous. Except in times of extreme capacity constraints marginal costs can be considered as constant in a first approximation. Any inframarginal rents due to higher carbon prices are thus limited. This is not the case in the electricity sector, where different technologies with widely differing marginal costs operate together at the same time. Prices for the output from all will be equalized for all technologies. And, of course, following the introduction of a carbon constraint the prices for all the electricity produced by all technologies, base-load or peak-base-load, carbon-intensive or carbon-free, will increase.7 Transfer from electricity consumers
to electricity producers are thus far higher than the amounts warranted to finance the cost of satisfying the carbon constraint.
As has been said before, the auctioning of quotas will in no way change the situation for electricity consumers but will, of course, lower the amount of environmental rents received by producers since they will have to transfer a substantial amount of these rents to their respective governments (see Chapter 4). Chapters 3 and 4 will provide empirical estimates for the additional rents gained by electricity producers due to the EU ETS under free-allocation in Phase I and under auctioning in Phase III respectively. As general guidelines throughout the following discussion it should be kept in mind that:
a.
With free allocation, all technologies, except carbon intensive peak-load technologies will gain additional carbon rents8.b.
Even with full auctioning, the electricity sector as a whole will be better off than before the introduction of the trading system due to the rent transfer from power consumers to carbon-free electricity producers.9c. With auctioning, however, impacts will vary widely. Carbon-free technologies will have identical benefits as under free allocation, while certain highly carbon-intensive producers can be distinctly worse off than before the introduction of the system.
The following two chapters will analyze the impact on different technologies step-by-step.
7 A counter-example might render this fact more intuitive. If the marginal, price-setting technologies (those
with the highest marginal or variable costs) were carbon-free, the introduction of the EU ETS would not have had any
impact on either prices or inframarginal rents while maintaining its impact on the environmental performance of
lower-cost carbon-intensive producers. Many of the peculiar issues surrounding the EU ETS would have just disappeared. Alas, high marginal costs are due to the high costs of carbon-emitting fossil fuels, while carbon-free technologies such as nuclear or renewables have very low marginal costs. Prices in the electricity sector will thus continue to be set by the combined impact of the price of fossil fuels and carbon allowances.
8 This conclusion applies not only to the main continental European market, but also to specific electricity
markets. For instance assessing the impact of the EU ETS Phase 1 (2005-2007) on the Iberian electricity market, Javier Reneses and Efraim Centeno (2008) draw the conclusion that higher CO2-emission prices lead to higher profits for utilities in all scenarios. The increase in marginal costs when raising CO2-emission prices has a direct impact on the price, making infra-marginal technologies more profitable.
9 Carbon-intensive electricity producers will pass on these rents to their respective States through the auction
mechanism.
3. The Specific Sources of Rent in the Electricity Sector due to Carbon Pricing: Base-load
Producers Gain10
There exist in fact two important types of rent that electricity producers obtained during Phase I of
the EU ETS. The first kind of rent, Type I, is by far the most important one and concerns the
additional profits earned by power producers due to higher prices once the cost of allowances has been integrated into electricity prices. This affects the “inframarginal” rents habitually earned by base-load technologies with low marginal costs during the operation of higher cost peak-load technologies, which set the price. It is important to recall that such inframarginal rents are a sign for correctly working electricity markets since they are essential to finance the fixed costs of base-load power generation in the long-run.
Base-load power producers thus gain large rents due to carbon pricing once the price of allowances has been included in the price of electricity (see the discussion on pass-through and opportunity costs below). If allowances are allocated freely, such rents are obtained both in carbon-free (nuclear and renewables) and in carbon intensive (coal and gas) base-load power production. This is due to the fact that neither group experiences any cost increases with the price increase of their output: carbon-free producers do not need to buy allowances and carbon-intensive producers can satisfy their commitment by means of the costless allowances they have received. With full auctioning, carbon-intensive producers would lose the "windfall profits" from carbon pricing, while the carbon-free producers would continue to enjoy them.
A second kind of “windfall profit” consists of the informational rent earned by the recipients of large quantities of allowances in a market with imperfect information. It is potentially large but empirically difficult to determine and it has received some attention in public discussions. Last but not least, the gains from asymmetric information are likely to remain confined to the peculiar price dynamics of Phase I and should disappear once the major actors in the market have engaged in the necessary learning processes.
Graph 3: Rent Creation with Asymmetric Information and Over-allocation
Euros
Marginal Social Cost Marginal Cost of
Control
10 An earlier version of sub-chapter was published as part of “The Interaction between the EU ETS Carbon
Market and European Electricity Markets” in Denny Ellerman, Christian de Perthuis and Frank Convery (2009), The
European Union Emissions Trading Scheme, Cambridge University Press, Cambridge, UK.
11 WP-LEDa n°4-2009
D
B C
p = € 12
0 q tCO2
These Type II rents are due to the double facts of (a) costless and over-generous allocation of
allowances during Phase I and (b) an average price of 12 Euros which is considerably higher than the zero price over-allocation should have produced in a situation where all market participants disposed of the same information. Graph 3 shows the different elements of this constellation. Costless and over-generous allocation of allowances implied that electricity producers disposed of their full environmental rent (A + B + C + D) without any reductions compared to the situation ex
ante. In addition average (and not conform to theory) EUA prices during 2005 – 2007 were around
€12 per tonne. Recipients of allowances would thus, at least in principle, have been able to make large trading profits from first selling their allowances to financial players and speculators without allocations of their own and then covering their own real needs at the end of Phase I at prices close to zero. This hypothesis, for which there is some anecdotal evidence but no proof, is based on the argument that recipients of allowances, especially large power companies, had an informational advantage over the whole of the market which allowed them to reap such one-off trading profits. Relevant information does not only regard electricity consumption, primary fuel prices, etc., but also good anticipation on climate related policy events. As was shown by Eva Benz and Stefan Trück (2009) such events are driving factors on the CO2 allowance price. The numbers we report below for the Type II rents are an upper bound under the (highly unrealistic) assumption that all electricity companies were able to engage fully profitably in such inter-temporal arbitrage, real trading profits were certainly much smaller, but cannot be assessed due to the private nature of this information.11
Table 1: Types of Rent under Free Allocation and Auctioning
Free Allocation Auctioning
Type I: Changes in infra-marginal rents due to carbon pricing (estimated)
Applies to both carbon-intensive and carbon-free base-load producers
No longer applies to carbon-intensive base-load producers; still applies to carbon-free
base-11
A third type of “rent” was discussed during Phase I but is of limited practical pertinence and applies only to free allocation. It is due to the fact that carbon-intensive emitters receive large amounts of allowances at the beginning of the production period that constitute financial assets until they are used during routine electricity production. Until their use in production, these allowances constitute “capital”. Although seductive in theory, there are fundamental limits to this argument. First, inter-temporal arbitrage of the value of allowances is not costless (given that allocation comes in spikes at the beginning of each year and runs out throughout the year). Second, so far no cases have been reported that banks would accept such a volatile asset as carbon credits as collateral. Third, the asset of a carbon allowance is a non interest-bearing financial asset, which further reduces its attractiveness.
load producers.
Type II: Inter-temporal trading profits due to asymmetric information (estimated)
Significant during Phase I, will decrease with better overall information
Will fade away in Phase II with better knowledge.
Below we provide a calculation of the order of magnitude of the annual Type I and Type II rents obtained by different power producers in the European electricity sector during Phase I of the EU ETS. Clearly, the calculations for type I rents (changes in infra-marginal rents due to carbon pricing) are relatively important (most notably to the extent that they will continue to exist in Phase II) and are, despite the remaining uncertainties, empirically more reliable.12
Calculating Type I rents
In order to understand the nature of the Type I rents due to changes in relative costs after the introduction of carbon pricing obtained by power producers, one needs to be aware that electricity produced by installations that have marginal costs lower than the technology with the highest marginal costs always earns rents even without carbon pricing. For decades such inevitable rents existed, they were well understood by experts and attracted little public attention. Such inframarginal rents are also necessary to finance the fixed costs of base-load power generation in the long-run. The key issue pertaining to the introduction of the EU ETS, however, is that carbon pricing alters the relative marginal costs of different technologies and thus impacts (usually raises) the inframarginal rents. The difference between inframarginal rents before and after carbon pricing will provide our Type I rents – the additional gains of power producers due to carbon pricing.
The following graph provides an indication of the marginal costs with and without taking into account the cost of CO2 emissions for coal-fired, gas-fired and nuclear power generation (all numbers are calculated on the basis of IEA (2007), World Energy Outlook 2007, and by IEA/NEA (2005), The Cost of Generating Electricity as well as on the basis of the average carbon spot price of €12 of an EUA during the 2005-2007 period according to the French carbon exchange Bluenext.) The model assumes full “pass-through” of the carbon cost for the marginal producer, in other words, carbon costs are always fully included in the price of electricity by the marginal producer.13
12 Nevertheless, the calculations of type I rents were possible only by taking a number of assumptions, the
most heroic of which is that the European Union constitutes a single unified power market. This is obviously not yet the case, given that interconnection capacities between different regions can be limited. However, this does not limit the pertinence of the exercise. Our calculations constitute, in fact, a lower bound of the real rents obtained by operators. During Phase I, prices for the year-long power contract (calendar), the most liquid future contract, were around 55 Euros per MWh on the German EEX power exchange. This is considerably higher than the marginal cost (inclusive of CO2) for natural gas-based electricity at 38 Euros that is driving the bulk of the
results in our calculation.
13 For a discussion of the notion of pass-through and its impact on electricity prices see “The “Pass-through” of
Carbon to Electricity Prices” in “The Interaction between the EU ETS Carbon Market and European Electricity Markets” in Denny Ellerman, Christian de Perthuis and Frank Convery (2009), Pricing Carbon: The European Union Emissions Trading Scheme,, Cambridge University Press, Cambridge, UK. Suffice it to say here that the principle of opportunity cost requires the holders of a valuable allowance to include the value of the latter into the price of electricity independently of the fact whether they received the allowance for free or paid for it.
The Pass Through Assumption
The assumption of full pass through is based on the consideration that there is no theoretical foundation for pass-through rates lower than one in a competitive market. The principle of opportunity cost ensures that the holder of a carbon allowance will always try to recuperate its full market value, independently of the fact whether he uses it in electricity production or sells it separately.
Several economic teams have analysed the relationship between market structure and cost pass through. According to the models run by Sijm et al (2006) the rate of cost pass-through depends on the country, market structure, demand elasticity, load period and the CO2 price. In most cases the rate
is less than 100 per cent. Liliya Chernyavs'ka and Francesco Gullì estimate that the increase in price
can be either lower or higher than the marginal CO2 cost. In their analytical model Monica Bonacina
and Francesco Gullı`(2006) consider a dominant firm facing a competitive fringe. They conclude that "the marginal CO2 opportunity costs are fully included in energy prices when the electricity market is
perfectly competitive." Finally, Georg Zachmann and Christian von Hirschhausen (2008) also conclude
that asymmetric cost pass-through could indicate the exercise of market power by German electricity generators.
Rationales for the alternative view that cost pass-through under competition might be less than 100 % are based on arguments concerning (a) voluntary constraints and sub-optimal behaviour and (b) changes in the merit order due to fuel switching. This argument is notably made by Reinaud (2003).
The first argument cuts both ways and in absence of any firmer evidence, the 100 per cent hypothesis remains the most reasonable. The second argument would only apply to the limited amount of fuel switching observed by Meghan McGuinness and Denny Ellerman (2008) in the United Kingdom. This rationale remains consistent with the assessment made by Erik Delarue and William D’haeseleer (2007) of the fuel switching potential. In their conclusion, they underline that for the switching to occur, an important condition has to be fulfilled: a sufficiently high allowance price together with a sufficiently low natural gas price. In addition, the question of the counter-factual (what would electricity prices have been in the absence of carbon pricing?) is not addressed. Increases due to carbon pricing are thus indistinguishable from increases due to changes in market power, weather, demand or other factors. In the absence of massive fuel switching, the 100 per cent pass-through hypothesis under competition remains by far the most solid one.
One thing is certain, however, pass-through rates lower than one – if we were able to measure them with confidence – are no sign of “competitive pressures” but quite to the contrary, a sign of the exercise of monopoly power. The assumption of full pass through is therefore consistent with the aim of our assessment. In other words, the Type I rent which appears in Table 2 below may include a small part of profit which is not purely linked to the ETS but derives from market power.
Graph 4: A Stylised European Load-Curve for the Year 2005
(2005, IEA 2007 and IEA/NEA 2005)
MC €/MWh 0 100 500 1 000 TWh Understanding Load-Curves
The load-curve above provides a crude approximation of the production profile of the European electricity sector in 2005, which produced a total 3 276 TWh. The horizontal axis provides the total amounts of electricity produced by each technology and the vertical axis its marginal cost both excluding and including (where applicable) the cost of carbon emissions. The cost of carbon emissions is equal to the average allowance price of €12 during Phase I. In this exercise, we assume competition and a one-hundred per cent pass-through of carbon allowances into the electricity price. Thus this exercise does not include scarcity rents from the exercise of monopoly power
The generating technologies with the lowest marginal costs (wind, nuclear and hydro) are technologies that best run in an uninterrupted manner and referred to as base-load technologies (bottom row). Coal and biomass (and in some European market, such as the UK, gas) can be considered mid-load technologies (second row), whereas gas and oil are originally peak-load technologies (third and fourth row). The latter are characterized by low fixed costs and high variable costs. The height of the marginal costs determines the “merit order”, i.e., the order in which different technologies are switched on in times of need.
Merit order curves, or load-curves, are usually depicted in terms of hours-of-operation per year on the horizontal axis with a maximum of 8760 hours per year. In order to calculate total rents in the electricity sector however, which are a function of hours-of-operation multiplied by capacity multiplied by the hourly rent, it is easier to work with the total electricity produced
(hours-of-Nuclear 11.7 Hydro 8.9
Coal w/ CO2 31.1 Coal and biomass w/o CO2 21.5 Gas w/o CO2 34.3 Gas w/ CO2: 38.6 Wind 12.8 Oil w/ CO2: 69.4 Oil w/o CO2: 60
operation multiplied by capacity) rather than to convert the data into hours-of-operation by dividing it through capacity.
Once marginal costs with and without CO2 allowances as well as respective production volumes are known one can calculate the total amount of rents. A rent in this context is the difference between the market price (set by the fuel with the highest marginal cost) and the marginal cost of each fuel. Of course, the marginal fuel does not earn any rent. Total rents for each fuel are obtained by integrating the respective areas for each fuel under the load-curve.
One remark of caution is of order: rents are nothing intrinsically bad. They are part and parcel of the working of a well-functioning electricity sector. Remember that power plants need to earn rents above their marginal costs in order to finance their past fixed costs and their future investments. What is of interest in our discussion is the amount of additional rent gained by European power producers due to the introduction of carbon pricing. The table below provides the results of the following calculations:
a)
Inframarginal rent w/o CO2: the normal rents generated by the electricity system in the absence of any carbon pricing; oil as the marginal fuel does not earn any rents in this calculation since it assumes the absence of market power.b)
Inframarginal rent w/ CO2 (free allocation): the total rents generated by the electricity system with carbon pricing under the assumption of free allocation of allowances.c)
Type I rent due to EU ETS: this is the additional rent due to the increase in the price ofelectricity; it is equal to the difference between a) and b); see text for the explanations concerning the different types of rent; this the most important result of the table.
d)
Type II rent (one-off): power producers received allowances for free in an oversuppliedsystem where allowances commanded an average price of 12 Euros; in practice much less; it is also a one-off limited to Phase I.
e)
Sum of type I and type II rents: the theoretical maximum power producers might havegained during Phase I; due to the overestimation of type II rents, the total amounts might be substantially less.14
14 It should also be noted, however, that the average price for electricity on the German EEX power exchange
during Phase I was 42 Euros per MWh, whereas with marginal cost pricing on the basis of our load-curve an average price of 33 Euros per MWh would have resulted. Both higher fuel costs during 2006 and 2007 and scarcity pricing are responsible for this difference.
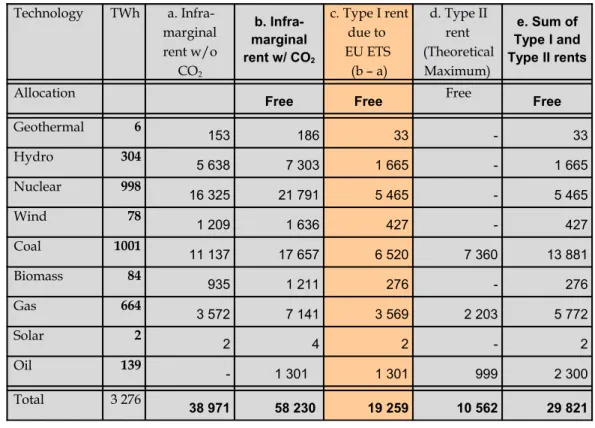
Table 2: Rents in the European Power Sector Due to Carbon Pricing during Phase I
(Million Euros of annual rents, average Phase I price of €12 per tonne of CO2)
Technology TWh a. Infra-marginal rent w/o CO2 b. Infra-marginal rent w/ CO2 c. Type I rent due to EU ETS (b – a) d. Type II rent (Theoretical Maximum) e. Sum of Type I and Type II rents
Allocation Free Free Free Free Geothermal 6 153 186 33 - 33 Hydro 304 5 638 7 303 1 665 - 1 665 Nuclear 998 16 325 21 791 5 465 - 5 465 Wind 78 1 209 1 636 427 - 427 Coal 1001 11 137 17 657 6 520 7 360 13 881 Biomass 84 935 1 211 276 - 276 Gas 664 3 572 7 141 3 569 2 203 5 772 Solar 2 2 4 2 - 2 Oil 139 - 1 301 1 301 999 2 300 Total 3 276 38 971 58 230 19 259 10 562 29 821
From Table 2 emerges that the sums in play were substantial even with a relatively modest carbon
price of €12. Total Type 1 rents are more than €1915 billion without including scarcity rents from
temporary pricing power. Especially carbon-intensive power producers gained due to the free allocation of allowances. The sum total of Type I and Type II rents of €30 billion should not be quoted without the necessary caveats surrounding the uncertainty of the precise amount of Type II rents. During Phase I with free allocation, all technologies, whether free or carbon-intensive, gained. We will show below that this will change since carbon-intensive producers will suffer to different degrees from an introduction of full auctioning as envisioned by the
Commission for 2013 and beyond in its 2nd Climate and Energy Package of 23 January 2008 (see
Chapter 4).
These rents do not translate automatically in an equivalent amount of profit for the utilities. In several countries a regulated tariff is imposed by the government on the sales to households and to small and medium industry. In economical words, the rent is then shared between the utility and its customers. Nevertheless most European utilities performed rather well on the stock exchanges
15 Our results are logically much higher than the estimation given by Point Carbon (2008) which focuses only
on the profit of thermal generators. This survey assesses the potential for profit of generation utilities in 5 countries (Germany, Italy, Poland, Spain and United Kingdom). Assuming an average price of CO2 of 21 €/t, the estimated "windfall profit" for the whole period 2008 – 2012 ranges between 23 and 47 Billion Euros.
during the period 2005 – 2008 with a premium to the average market valuation and a generous policy of dividend distribution which reflected comfortable profit margin.
4. How Auctioning Would Reshape the European Electricity Sector: Carbon-free vs. Carbon-intensive Producers
According to the same methodology one can estimate the impact of the new rules under the European package on energy and climate change which was adopted by the European Parliament on 17 December 2008.
Within this package, a new directive amends directive 2003/87/EC in such a way that full auctioning shall be the rule from 2013 for the power sector. A transitional system is nevertheless authorized for power producers of new member States. In these States free allocation is allowed but the total quantity given for free shall not exceed a fixed ceiling in 2013 (roughly 70% of emissions) and shall gradually decrease resulting in no free allocation in 2020. In all other States power producers will have to buy all the allowances they need from 2013.
As has been said above, the auctioning of quotas will in no way change the situation for electricity consumers but will, of course, lower the amount of environmental rents received by producers, since they will have to transfer a significant amount of these rents to their respective governments.16 For the
reasons given above, the majority of producers will continue to gain from carbon trading under the EU ETS. To understand this one needs to distinguish three different effects:
• Carbon-intensive producers will now need to pay for their allowances but will be compensated for this in the form of higher prices (compared to a situation without a trading system; compared to free allocation, prices will not change); they thus have neither benefits nor costs from an introduction of a trading system with auctioning.
• Carbon-free producers will continue to benefit from the increases in inframarginal rents due to higher prices without any concomitant increases in cost; they thus continue to benefit from the EU ETS even with auctioning.
•
Certain highly carbon-intensive producers such as coal will see their inframarginal rents reduced due to the fact that the increase in prices (set for instance by gas) is less than their own increase in cost; they thus will thus loose from an EU ETS with auctioning.In the present composition of the European power supply, the three effects together amount to a continuing substantial profit for European power producers as a whole. This continuing additional inframarginal rent due to carbon pricing would still amount to roughly €10 billion at an auction price of €20 per tonne of CO2. Table 2 below that summarizes the empirical estimations shows that
carbon-intensive producers based on coal, oil and gas would be adversely affected by a switch from free allocation to auctioning. More significantly, coal producers would be absolutely worse off. Auctioning would leave them with a total of approximately seven billion of inframarginal rents, which constitutes roughly a 40 per cent reduction from their previous inframarginal rents of slightly over €11 billion Euros before the introduction of the EU ETS. The additional inframarginal rents due to carbon pricing of producers based on nuclear and renewables, however, would remain unaffected by the switch from free allocation to auctioning.
16 On the basis of the analysis in Chapter 2, we can be more precise: carbon-intensive producers will transfer
to governments the carbon rents they earned as marginal producers as well as the part of their inframarginal rents that corresponds to their own increased cost due to carbon pricing. To the extent that the marginal producer has even higher marginal costs and thus sets a higher price, even carbon-intensive producers can keep part of their infra-marginal rents. According to our calculations, coal-based producers will loose in this readjustment compared to the absence of carbon-trading, gas-based producers will gain slightly even with auctioning and oil-based producers will be unchanged.
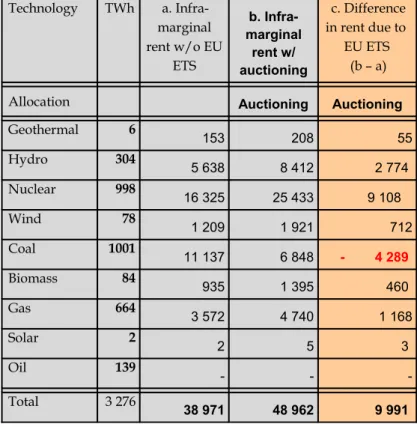
Table 3: Estimated Rents during Phase III with Auctioning (Million Euros of annual rents, prospective auction price of €20 per tonne of CO2)
Technology TWh a. Infra-marginal rent w/o EU ETS b. Infra-marginal rent w/ auctioning c. Difference in rent due to EU ETS (b – a) Allocation Auctioning Auctioning
Geothermal 6 153 208 55 Hydro 304 5 638 8 412 2 774 Nuclear 998 16 325 25 433 9 108 Wind 78 1 209 1 921 712 Coal 1001 11 137 6 848 - 4 289 Biomass 84 935 1 395 460 Gas 664 3 572 4 740 1 168 Solar 2 2 5 3 Oil 139 - - -Total 3 276 38 971 48 962 9 991
One can now also assess the difference between an EU ETS with free allocation and with auctioning and thus calculate the cost of auctioning (see Table 4). This corresponds to a scenario, in which the EU ETS is now a reality for the European power industry and only the method of allocation differs. As has already been pointed out the cost of switching to auctioning will not affect carbon-free producers (since prices do not change). At €20 per tonne of CO2, the switch to auctioning will significantly impact
gas-based producers (which are still slightly better off under auctioning than in the absence of the EU ETS) but will loose roughly €5 billion compared with a free allocation. The switch to auctioning will heavily impact oil- and coal-based power producers who will loose roughly €2 billion and €15 billion respectively in the process. Oil-based producers will even loose the totality of their rent compared to free allocation due to the fact that they will always operate as a marginal producer and thus have no infra-marginal rents to fall back on.17
Table 4: Difference between Free Allocation and Auctioning in Phase III (Million Euros of annual rents, prospective auction price of €20 per tonne of CO2)
17 The auction revenues that should accrue to European governments correspond to the difference between
rents under free allocation and rents under auctioning.
Technology TWh a. Infra-marginal rent w/ auctioning b. Hypothetical rent w/ free allocation c. Cost of auctioning (a – b)
Allocation Auctioning Free
Geothermal 6 208 208 0 Hydro 304 8 412 8 412 0 Nuclear 998 25 433 25 433 0 Wind 78 1 921 1 921 0 Coal 1001 6 848 22 003 - 15 156 Biomass 84 1 395 1 395 0 Gas 664 4 740 9 521 - 4 781 Solar 2 5 5 0 Oil 139 - 2 168 - 2 168 Total 3 276 48 962 71 067 - 22 105
The comfortable increase of the infra-marginal rent might in the future make investments in peak-power generation even less attractive than today, thus exacerbating the issue of the "missing money" pointed out by Paul Joskow (2006). In other words, for power producers capable to play the whole of the load-curve, carbon pricing increases the opportunity costs for investment in peak-load capacity. This risk gives more weight to the proposal by Dieter Helm (2003) to design an energy agency designed to monitor both CO2 emission reductions and security of supply in order to complement the
Commission’s institutional set-up to supervise carbon markets. A final key point is that introducing auctioning or changing the mode of allocation in any other way has no impact on either the price of electricity, or the amount of rents needed to be paid by electricity consumers.
Conversely, auctioning might question the rationale for a quota trading system over a carbon tax18:
1.
In principle, the first advantage of a quota trading system over auctioning is the ability to leave environmental rents with producers (this corresponds to the historic distribution when environmental rents were not internalised) rather than with the State. With auctioning, this option disappears as in distributional terms a carbon market becomes identical with a carbon tax. By switching to auctioning, European policymakers thus risk alienating a constituency that has so far been supporting the EU ETS, namely fossil-fuel based power producers.2.
The second advantage of a quota system is, of course, the certainty that it induces concerning the stringency of the environmental objective, namely the amount of carbon emissions. The flipside is, of course, that the economic impacts, i.e. the stringency of the carbon constraint cannot be assessed with certainty in advance. The peculiar pricing mechanism of the electricity sector dramatically magnifies this uncertainty. Instead of affecting only marginal costs, as it would in a normal market, the carbon constraint now also affects heavily the inframarginal rents thus increasing uncertainty about the economic performance of European power utilities.19It seems that the European legislator did not neglect these questions. The new directive allows participants to use "Kyoto credits" (i.e. credits stemming from CDM and JI) up to a level of 50 % of the requested emission reductions for the period 2008 – 2020. The directive also includes a provision enabling the European Commission to monitor the carbon market and allowing Members States to bring forward auctioning of allowances in case of excessive price increases. In this sense, the European legislator was able to go further than consider auctioning as a pure matter of justice. 20
However, whether a market with explicit provisions for ex post tampering can provide the transparency and visibility participants are craving for is open to question.
One final effect of auctioning is that it will make electricity production on the basis of carbon-free technologies such as nuclear and renewables more attractive compared to the production of fossil fuels. This is clearly a welcome side-effect of auctioning. In this sense, auctioning has the power to reshape the European electricity sector, but in a different way that would do a carbon tax. This corresponds to the results obtained by Richard Green (2008)
It is no coincidence that a large and well-capitalized utility such as Germany’s coal-based RWE was repeatedly mentioned as a takeover target before it decided to merge with Essent21. While there are
thus costs and benefits of switching to full auctioning, very few of the underlying issues have actually been thought through coherently. This article may be considered a first systematic attempt.
5. Conclusion
19 A drop in electricity demand would not only affect quantities, prices and marginal costs but also reduce
inframarginal rents considerably, which in return would affect a company’s ability to invest. Higher demand instead might lead quickly to politically unsustainable surplus rents.
20 Answering the question why allowances should be auctioned, Cameron Hepburn et al. (2006) clearly show
that auctioning enlarges the options to address the distributional consequences of the EU ETS between the various sectors (participating or not).
21 The merger is sometime interpreted as an attempt to become too big to be an attractive prey. RWE
managers would probably say that the merger enlarges access to natural gas – extending the scope to switch from coal to gas in new plants.
This article had a triple objective. Its first objective was to propose a coherent methodology to assess the impact of monetising environmental rents on the inframarginal rents and thus profits of European power producers in the context of the EU ETS. The second objective was to estimate empirically these rents during Phase I of the EU ETS distinguishing between inframarginal rents and rents due to asymmetric information about the availability of allowances (and hence their price). Clearly, such estimations can be and should be refined in further work, ideally on a plant-by-plant basis. The third objective was to assess the differentiated impacts of a switch from free allocation to auctioning on different types of power producers.
Whatever the detailed short-comings of such empirical work, it is clear that carbon pricing even at the relatively low price of € 12 per tonne is having a transformative impact on the European power sector. With the creation of the EU ETS European policymakers have subjected electricity producers and consumers to a sizeable shock, which due to its effect on inframarginal values has far larger impacts than foreseen. While the authors are concerned that so far only very limited theoretical or empirical work has been undertaken on this interface between carbon and electricity markets, they remain convinced that this exciting field of research will receive a large increase in interest in the years to come.
References
Benz E., Trück S., 2009. Modeling the price dynamics of CO2 emission allowances. Energy Economics 31, 4–15
Bode S., 2004. Multi-period emissions trading in the electricity sector — winners and losers. Energy Policy 34, 680–691.
Bonacina M., Gullı`F., 2007. Electricity pricing under ‘‘carbon emissions trading’’: A dominant firm with competitive fringe model. Energy Policy 35, 4200–4220.
Chernyavs'ka L., Gullì F., 2008. Marginal CO2 cost pass-through under imperfect competition in power
markets. Ecological Economics 68, 408 – 421.
Convery F., Ellerman D., de Perthuis C. (2009, forthcoming), Pricing Carbon: The European Union Emissions Trading Scheme, Cambridge University Press, Cambridge, UK.
Delarue E., D’haeseleer W., 2008. Greenhouse gas emission reduction by means of fuel switching in electricity generation: Addressing the potentials. Energy Conversion and Management 49, 843–853.
Green R., 2008. Carbon Tax or Carbon Permits: The Impact on Generators Risks. Energy Journal – Volume 29 N° 3.
Helm D., Hepburn C., Mash R. 2003. Credible carbon policy. Oxford Review of Economic Policy, Vol 19, NO 3.
Hepburn C., Grubb M., Neuhoff K., Matthes F. and Tse M., 2006. Auctioning of EU ETS Phase II Allowances: how and why? Cambridge – CWPE 0644 and EPRG 0621.
Joskow P., 2007. Competitive electricity markets and investment in new generating capacity, in The
New Energy Paradigm(Dieter Helm, Editor), Oxford University Press http://econ-www.mit.edu/files/1190
Keppler, J.H., 2007, “We do not yet have the answers, but we know the right questions: Lessons learned from the 2005-2007 trial phase of the EU ETS” in Lesourne, J. and Keppler, J. H. (2007), Abatement of CO2 Emissions in the European Union, 137 – 156, IFRI – Paris
Keppler J. H., Cruciani M., Kérébel C., 2008. “Le ‘paquet énergie et climat’ du 23
janvier 2008 : un tournant pour l’Europe de l’énergie”, Note de l’Ifri, May 2008, Paris.
Keppler, J. H., 2009, forthcoming. “The Interaction Between the EU ETS Carbon Market and European Electricity Markets”, in Convery F., Ellerman D., de Perthuis C. (2009, forthcoming), Pricing Carbon: The European Union Emissions Trading Scheme, Cambridge University Press, Cambridge, UK.
Lesourne, J. and Keppler, J. H., 2007, Abatement of CO2 Emissions in the European Union, Etudes de l’Ifri, IFRI – Paris (2007).
McGuinness M., Ellerman A. D., 2008. CO2 Abatement in the UK Power Sector: Evidence from the EU
ETS Trial Period, MIT-CEEPR Working Paper WP-2008-010, August 2008.
Point Carbon, 2008. EU ETS Phase II – The potential and scale of windfall profits in the power sector, a report for WWF. Point Carbon Advisory Services , March 2008
Position of the European Parliament adopted at first reading on 17 December 2008 with a view to the adoption of Directive 2009/.../EC of the European Parliament and of the Council amending Directive 2003/87/EC so as to improve and extend the greenhouse gas emission allowance trading system of
the Community P6_TC1-COD(2008)0013
Reinaud J., 2003. “Emission Trading and its Possible Impacts on Investment Decisions in the Power Sector”, IEA Information Paper, Paris, 2003
Reneses J., Centeno E., 2008. Impact of the Kyoto Protocol on the Iberian Electricity Market: A scenario analysis. Energy Policy 36, p. 2376–2384.
Sijm J., Neuhoff K. and Chen Y., 2006. CO2 Cost Pass Through and Windfall Profits in the Power
Sector. Climate Policy (Earthscan), 2006(6), p. 49-72.
Zachmann G., von Hirschhausen C., 2008, "First evidence of asymmetric cost pass-through of EU emissions allowances: Examining wholesale electricity prices in Germany. Economics Letters 99, 465–469