EURIsCO, Université Paris Dauphine
cahier n° 2005-07
par
J.-F. Jacques & E. Walkowiak
Low wages and high unemployment :
The role of social interaction in the hiring discriminations
LOW WAGE AND HIGH UNEMPLOYMENT: THE ROLE OF SOCIAL INTERACTIONS IN THE HIRING DISCRIMINATIONS
____________________________________________
Jean-François Jacques
EURiSCO, Univeristy Paris IX-Dauphine jacques@dauphine.fr
Emmanuelle Walkowiak
Department of Economics, Princeton University
ewalkowi@princeton.edu
(Preliminary version)
The proposed model provides an explanation of why, for a given skill level, the workers with lowest wages have the highest unemployment rates. We assume that workers are both in productive interdependency and in social interaction in the firm. Each worker is identified by its social group (gender, age, nationality). The intergroup and intragroup interactions determine the worker productivity. Frictions on the labour market limit the hiring of the most productive workers. Consequently externalities within the firm and on the labour market can lead to a higher rate of unemployment of the low wage group of workers. The model is simulated using French occupational data.
Introduction
The aim of this paper is to bring an explanation for dualism of the labour market. Our approach is based on segregation and we show that work organization of firms and frictions on the labour market generate this segregation mechanism.
There is recent theoretical and empirical literature that concerns segregation. On the one hand, traditional literature on organization points out segregation by skills. The seminal work of Kremer (1993) who introduces the O-Ring production function shows that the firms should segregate the workers by skills. Many theoretical papers complete this analysis (Thesmar and Thoenig (2000) or Caroli, Greenan and Guellec (2001)). The common point of their analysis is to model complementaries between tasks that imply that quality cannot substitute to quantity. Some empirical works highlight this segregation effect based on skills (see Kremer and Maskin (1996) for example). On the other hand, to our knowledge, there is no theoretical paper which links work organization to segregation based on personal characteristics of workers, yet there is strong empirical evidence of this phenomenon. For example Dolado, Felguerson and Jimeno (2001, 2002) test for gender segregation as Bayard, Hellerstein, Neumark and Troske (2003) do. Hellerstein and Neumark (2002) study racial and ethnic segregation and find evidence of such behaviour within the firms.
Moreover, different theoretical approaches show the dualism on the labour market. Doeringer and Piore (1971) point out the internal labour market which necessitates a specific organization for minimizing the turnover costs. In other analysis, the imperfection of labour market explains this duality such as efficiency wage or imperfect competition (Zajdela (1990)). Saint -Paul (1996 a) adopts another point of view. The frictions on the labour market could explain why the same posts can be filled indifferently by skilled and unskilled workers. Because it is difficult to find skilled workers firms may not manage to hire the most productive workers.
In this paper we try to conciliate these two fields of research to explain the dualism in the labour market and segregation within the firms. The segregation mechanisms we study, are based on personal characteristics of workers. We analyse jointly the externalities on the labour market arising from the search activity and the externalities within the firm between workers. Assuming that social interactions affect the workers productivity, we show that firms have an interest in optimising their workforce composition. More precisely, we consider that competence of workers is the joint product of their skills and organizational environment. Moreover, the interaction structure integrates peer group effects between workers that affect efficiency of communication. In this configuration, we model the matching inside the firm and on the labour market to explain dualism and segregation. The paper is organized as follows. We begin, in a first part, by presenting the general features of the model, and then, we focus on some comparative statics in the second part. In the third part, we introduce some simulations of our model using French occupational gender data.
1 General presentation of the model
Let us suppose an economy with N agents indexed by i. Every agent is characterized by his level of qualification a and by his community of membership noted g. For the sake of simplification we suppose that there are two communities g = 1 , 2. Every agent belongs to only one of the two communities that indicate his type. A community defines a “social”
proximity between workers that can result from a social categorization as in Fryer and Jackson (2003).
1.1 Competence to solve problems and “social” interdependence
We consider that every individual develops a competence to solve problems that he encounters in his job. This individual competence constitutes a specific knowledge on the production of the firm. This knowledge depends positively on the skill, noted a, and on a knowledge externality noted b, which depends on the average skill of the other employees with whom the individual i is in contact. Formally, the individual knowledge of the individual i of type g can be expressed as:
(1) g i g i g i a b m = * where g =1,2 Where g i
b is the knowledge externality which the individual i of type g benefits from.
This formalization of the competence to solve problems takes into account the influence of social interaction through an individual production function. It is based on the structure of social interactions models in which the utility of one individual depends on its own action and on the average action of the group of reference to which he belongs (Glaeser and Scheinkman (2002)). We suggest interpreting the spillover b, by referring to the concept of
social capital as Glaeser, Laibson and Sacerdote (2000) do. They use such a specification to identify the determinants of social capital and to understand how it accumulates at the community level. Our approach is similar to the latter but our analysis is at the firm level rather than at the individual level.
The social capital within the firm is defined as the social structure of organization that exists through the complex networks of formal and informal relations between workers (Adler et Kwon (1999)). The social capital is an asset for both the workers and the firm. Goshal and Nahapiet (1998) show that social capital is value creating in firms. Indeed, by improving the exchange and the combination of pieces of information, it favours intellectual capital accumulation. In our model the competence to solve problems is a form of intellectual capital. Moreover, Leana and Van Burren (1999) distinguish two components of social capital: an affective component and a skill based component.
The externality b integrates these two components. Considering that interactions among
workers are limited to their communication, we assume that communications between workers of the same type and those of a different type can differ in terms of efficiency. This assumption allows discussing two arguments presented in the social capital literature:
- According to Bourdieu (1986) and Coleman (1990), closed social networks, with high social proximity between workers, favor social capital development. This configuration of social networks improves the transmission of information and favors confidence. In this perspective, intra-group communication should be better than inter-group communication. For example, if the type of the worker is characterized by his native language and if there are two languages spoken within a firm, it is likely that communication between two workers with the same native language is easier than communication between two workers with different native languages.
- But the reverse can also be true. “Social” proximity between workers of the same type can lead to the exchange of redundant information. It disfavors the efficiency of communication and limits the invention of innovative solution for solving problems. Indeed, as Burt (1992) argues, social capital is higher for individuals who
are on structural holes, who play a role of intermediary between different communities. Interactions between heterogeneous workers can favor social capital development.
We formalize these two assumptions as a peer group effect, using the parameter S, which
we suppose for simplification to be the same for both peer groups. All agents are interacting in the firm. Under this perspective, besides being influenced by the skills of other workers, b depends on the peer group effect, and consequently, on the choice of the social composition of the workforce. By noting N1 the number of workers of type 1, and N2
the number of workers of type 2, we have:
2 1 2 1 1 2 1 * N N a a S b N j j N i k k i + + =
∑
≠∑
for every worker i of type 1 (2) 2 1 1 2 2 1 2 * N N a a S b N i i N j k k j + + =
∑
≠∑
for every worker j of type 2
If S>1, for a given skill, the exchange and combination of information are better for workers of the same type. The communication between workers of homogenous type is more efficient than the communication between workers of different types. If S<1, inter-group exchanges are more efficient than intra-inter-group ones. Besides, given the “social” composition of the workforce of the firm, i.e. the proportion of each type of workers, communication becomes more efficient as skills increase.
1.2 The production process
Recent empirical and theoretical work shows that innovative organization practices reinforce horizontal interdependencies of tasks carried out by workers (Kremer (1993), Kremer and Maskin (1996), Crifo-Tillet, Diaye and Greenan (2002)). This reinforced horizontal interdependency is reflected in the delegation of autonomy to workers (Caroli, Greenan and Guellec (2001)), the development of multi-tasking (Lindbeck and Snower (1996, 2000), Carmichael and Mac Leod (1993)), the growth of collective work (Capelli and al (1997), Gittleman and al (1998)), the implementation of quality and just-in-time procedures. To model this new form of work organization, we use an O-Ring function of Kremer (1993). In this perspective, interdependencies of tasks are modeled as strategic complementarities. So, at the firm level, every task requires a worker although one worker can carry out several tasks. By noting E, an organizational externality, we have:
(3) N N j j N i i N k k m m m E 1 1 2 1 1 1 ) . ( ) ( 2 1
∏
∏
∏
= = = = = , with N=N1+N2As in Kremer (1993), this work organization specification prevents the substitution between labor quantity and labor quality in a production process. Whereas in Kremer the quality of workers is exogenous, in our model, this quality is endogenous. Indeed, if the distribution of skills (ai) is exogenous, the distribution of competences to solve problems is
endogenous. This individual competence is the variable of the O-Ring function we use. Moreover, in the Kremer specification of the O-Ring function, skills completely
differentiate workers. Here the competence to solve problems integrates two sources of labor heterogeneity: the skill and the type of the worker.
Furthermore, the quality of the worker cannot be dissociated from its productive context when peer group effects exist (S ≠1). In this case, the “social” composition of the workforce influences the competence to solve problems.
In the formalization of hierarchical work organization of Rosen (1982), the quality of the manager induces the same externality on the productivity of each worker. As in Rosen (1982), we consider that organizational externality influences identically the productivity of each worker. Whereas in Rosen’s model the economy of scale related to hierarchical work organization comes from managers, in our model, it results from horizontal interdependencies of tasks. The individual productivity of each worker, noted y, is given by:
(4) y mgE
i g i =
The production function of the firm is the sum of individual outputs.
(5) =
∑
1 1+∑
N2 2 i i N i i tot y y Y1.3 The implications of the homogeneity of skills and social heterogeneity on production
Let us consider that the size of every “social” community (the workers of every type) can vary, and let us put aside the question of difference in the average skill of every social group. N workers are matched according to their skill, which are strictly identical. Therefore, the average skill of every group is the same, and a worker alone has no impact on the average skill of its social group. In other words, the average skill of the social group 1 is equal to the average skill of the social group 2.
(6) 1 2 1 2 1 1 2 1 1 2 N N i i i i a a a a a N N = = =
∑
= =∑
=Let us put p the proportion of workers of type 1 and (1-p) the proportion of workers of type 2. (7) 1 2 1 N N N p + = (8) 1 2 2 ) 1 ( N N N p + = −
According (1) and (3), the externality function can be written as:
(9) N N j j j N i i ib a b a E 1 2 2 1 1 * ) ( 2 1
∏
∏
=On the one hand, all the workers of the community 1 (respectively of the community 2) take advantage of the same externality, so the index of workers can be omitted. On the
other hand, workers of different communities do not receive the same average competence because of the peer group effect. Indeed,
)) 1 ( ( 1 1 b a Sp p
bi = = + − , for each worker i of type 1 ) ) 1 (( 2 2 b a p S p
bj = = − + , for each worker j of type 2
By substituting in equation (1), we observe that individual competence to solve problem depends on the skill of the worker and on the proportion of workers of its type within the firm. For each worker, the competence to solve problem is:
)) 1 ( ( 1 1 a Sp p
mi = i + − , for each worker i of type 1 ) ) 1 (( 2 2 a p S p
mj = j − + , for each worker j of type 2 To simplify our presentation, we define
(11)
∏
∏
= = 2 1 2 1 N j j N i i a B a AAB describes the productive complementarities of skills of workers defined in the space of tasks. Two types of complementarities conjugate: the complementarities in the space of tasks, and the complementarities in the space of types.
Equation ( 9 ) can be rewritten as:
(12)
[
]
[
]
N p p N N j j N N N i N i N N AB b b E a p p S a a p Sp a E 1 1 2 1 1 2 1 1 ) ( ) ( ) ( ) ( * ) 1 ( * ) ( * ) 1 ( ( 2 2 1 1 − = + − − + =∏
∏
By replacing in (4) and (5) we obtain the output of each worker, which allows us to express the total production, as a function of the composition of the workforce within the firm according to skills and types:
(13)
(
)
(
)
⎥ ⎦ ⎤ ⎢ ⎣ ⎡ + − + − + =∑
∑
1 2 ) ) 1 ( ( ) 1 ( ( 2 1 N i N j j i tot E a a Sp p a a S p p YWe turn to analyze the peer group effect on production. The graph 1 gives a representation of the production function according to the proportion p of workers of type 1, when there is a peer group effect.
When S>1, intra-group communication is more effective than inter-group communication. In the same community, the higher the number of workers, the higher is social capital. In other words, as p, the proportion of type 1, grows, the social capital b1 which influences competence to solve problems of every worker of the community 1 increases, because of the peer group effect. This marginal gain is even more important as the proportion of worker of type 1 is important, because the additional individual will interact with even more workers. Conversely, the social capital favoring competence to solve problems of every worker of the community 2 decreases because their number decreases relatively to that of the others. The productivity of the community 2 is therefore decreasing with p.
However, the loss in productivity decreases as the proportion of the workers of type 1 increases.
Graph 1: Shape of the production function for different values of S
0 0.1 0.2 0.3 0.4 0.5 0.6 0.7 0.8 0.9 1
p Y
S<1 S>1 S=1
These two effects counterbalance each other and explain the level of output of the firm. Indeed, the horizontal interdependences of jobs, formalized as complementarities in the competence to solve problems of all the workers, generate an economy of scale E on the individual productivity of every worker. When the workers of the community 1 are in minority (p<0,5), the increase in social capital of the workers of the community 1 (b1),
associated to the increase in their proportion within the firm, concerns only a weak proportion of workers. It is consequently weaker than the loss of social capital affecting the category 2 workers (b2). The economy of scale E related to the horizontal organization of work depends both of b1 and of b2. So, E decreases with the proportion of worker of type 1. On the other hand, when the workers of type 1 are in majority (p>0,5), the increase in b1 is superior to the decline in b2. The economy of scale is then increasing with p. It explains that the production function is not monotonous in the proportion of worker of a given type. Terms A and B, which influence E, vary also as the “social” composition of the firm changes. However, the combination of these two terms, which reflects the complementarities of skills, is not modified by the social composition of the workforce, when skills are identically distributed within two communities. Indeed, in that case,
(13) =
∏
∏
=∏
N k k N j j N i i a a a B A 2 1 2 1* * .On the one hand, because of the presence of the peer group effect, if S> 1, it is always better for the firm to increase the proportion of workers belonging to the majority community. On the other hand, increasing the proportion of workers who have the minority type is counterproductive because it weakens the gain resulting from the peer group effect. Conversely, if S<1, inter-group communication is more effective than intra-group communication. The firm finds interest in inciting workers to communicate outside its group by favoring the heterogeneity of types. In this case, the social capital of each worker belonging to the same community decreases when its size grows. The social capital of the minority group is higher than that of the majority group, because it leads to communicate more frequently with workers of the other community. When the workers of the community 1 are in minority (p<0,5), increasing their proportion reduces their social capital. But this loss concerns only the minority category. The counterpart is an increase in the social capital of the workers coming from the majority community. These last ones are
so more numerous to benefit from an improvement of their competence to solve problems. When the homogeneity of types decreases so does the economy of scale related to the organization of the work and it is counterproductive. The firm always has interest to increase the proportion of workers sub-represented within the firm.
Finally, when there is no peer group effect (S=1), production does not depend on p. The “social” composition of the workforce has no importance. Membership in one or other one of the communities does not affect either the social capital, or the economy of scale E. The social capital is identical within the two communities of worker (b1=b2), whatever the “social” composition of the firm.
1.4 Equilibrium on the market of labor force
We turn now to study the macroeconomic equilibrium of this economy. We assume the presence of frictions on the labor market because the search activity is time consuming. This is represented by a matching function (Pissarides (2002)). We consider that all firms have the same production technology given by (13). The model is a continuous time matching model with one non-storable homogenous good.
There are two separate job markets: one for workers of type 1 and the other for type 2 workers. Our model is in line with that of Saint Paul (1996 b): there are two separate labour markets with two specific matching functions explaining the number of hiring. As Saint Paul, we assume that the total number of jobs is fixed at K. By fixing K, we introduce decreasing returns between the labor markets of both communities. Each matching function positively depends on the number of unemployed and vacancies. The matching activity has two marginal returns: for a given number of vacancies the higher number of unemployed, the more it is difficult for workers to find a job. Workers of type 1 and 2 search for a job in their specific labour market ignoring in which market they search for. In contrast firms know exactly who they search for: a worker of type 1 or type 2. Consequently they direct each worker to their specific labour market; this screening activity involves no cost because firms receive a free signal (a CV for example). The choice of posting a vacancy in a specific segment depends on the respective productivity of workers of type 1 or type 2. If one group is more productive than the other group, the firm will post more vacancies for it. Because of the decreasing marginal return to scale of the matching activity, the probability to find a worker decreases when the number of vacancies increases.
1.4.1 Determination of the curve of vacancies: arbitrage between the two types of vacant job
We will determine under which conditions firms offer the two types of vacancies. We will also determine the shape of the vacancy supply curve in function of the probability of filling these vacancies. More formally, λ1t is the probability by unit of time of filling a
vacancy of type 1 by an unemployed of type 1, and λ2t the rate of arrival of type 2 applicants. Let J1t denote the discounted value of a job held by a type 1 worker, r the
discount rate, and dt a small interval of time. The value to the firm of a vacancy of type 1 is consequently:
(14) VAC1t =(1−rdt)
[
λ1tdtJ1t+dt +(1−λ1tdt)VAC1t+dt]
Noting that (dt)2≈ 0, and J1t+dt ≈ J1t and VAC1t ≈VAC1t+dtthis equation can be rewritten
as:
Similarly, for type 2 workers, we have:
(16) 0=−(r+λ2t)VAC2t+λ2tJ2t +dVAC2t/dt
Provided that the type 2 workers are not all unemployed at equilibrium, firms must be indifferent between either type of vacancies.
(17) VAC1t = VAC2t = VACt
By equalizing ((13 and 14), this condition rewrites (18) λ1(J1−VAC)=λ2(J2−VAC)
We suppose that wages of every category of workers are exogenous: w1 for type 1 workers, w2 for type 2 the workers. The average wage in the economy is w= pw1+(1− p)w2.
Moreover, we assume that wages is a fixed part of the product1. Assuming exogenous wage is very common in problems of matching on the labor market (Saint Paul (1996 b)). However in our case, the gain obtained by the firm depends endogenously on the “social” composition of the firm. Therefore, the value of a type-g job, depends on the profit obtained when the firm hires a worker of this type. For every type of worker, this gain Gg is :
g g g y w
G = − , for g= 1, 2.
Making endogenous the gain obtained when the firm hires a type-g worker allows connecting matching on the labor market to interactions within the firm. Indeed, individual productivity (yg) depends on the organizational externality E which results from the “social” composition of the workforce within the firm.
Assuming an exogenous departure rate q for workers leaving their firm, the value for the firm of a job held by a type 1 worker is:
(19) J1t =G1t+(1−rdt)
[
qdtVAC1t+dt+(1−qdt)J1t+dt]
This can be expressed as
(20) 0=G1−(r+q)J1+dJ1dt+qVAC
Similarly for type 2 workers
(21) 0=G2−(r+q)J2+dJ2dt+qVAC
At equilibrium, by equalizing (20) and (15), one obtains for the workers of type 1: (22) ) ( 1 1 1 1 q r r G VAC + + = λ λ
Symmetrically for the workers of type 2, by equalizing (21) and (16) we have: (23) ) ( 2 2 2 2 q r r G VAC + + = λ λ
1 This assumption is not necessary at this stage of the model. However it is necessary to identify all parameters when we
By equalizing (22) and (23), as condition (17) suggests, we obtain the arbitrage condition in terms of the arrival rate denoted by AA. By noting R the ratio of gains, we have:
(24) 1 1 1 1 2 2 1 1 1 1 2 1 1 1 1 2 ) ( ) ( ) ( ) ( ) ( ) ( λ λ λ λ λ λ λ λ λ λ − + + − − + = − + + + = − + + + = q r w y w y q r q r G G q r q r R q r
This relation is illustrated by the graph 2. On the one hand when the ratio of earnings
G2/G1=1, AA is a 45 ° straight line. On the other hand, when G2/G1<1, this curve is above
the 45° line.
Graph 2: The arbitrage condition of the firm between two types of vacant jobs
When G2/G1=1, AA is a 45 straight line°. Because gains obtained by hiring one or the other
type of workers are identical, the type of posted vacancy depends only on the ease with which the firm can provide this vacancy. If the probability to provide a job of type 1 increases, it is necessary that the probability to provide a job of type 2 increases in the same proportion so that the firm remains indifferent to the type of posted vacancies.
When G2/G1<1 (respectively G2/G1>1), this curve is above (resp. below) the 45° line. Because the gain obtained on a worker of type 2 (resp. of type 1) is lower than the gain obtained with a worker of type 1 (resp. of type 2), it is necessary that the probability of providing a vacancy of type 2 (resp. of type 1) compensates for this differential of gain, so that the firm is indifferent between the two kinds of vacancies. It must be easier for the firm to find workers of type 2 (resp. of type 1) that workers of type 1 (resp. of type 2). In our model, even though the wage cost would be exactly identical for the two types of workers, it is possible that gains associated to every type of worker differ, due to social composition of the firm (.y1 ≠ y2)
1.4.2 The matching function
We assume that the number of matching by unit time is determined by a matching function
m(Vi, Ui), identical for the two types of job, where Ui is the number of unemployed of type
i and Vi, the number of vacancies. This is a concave function. By definition the probability
to provide a vacant job of type i is the ratio of the number of matching on the number of vacancies:
λ
1λ
2 1 1 G2 > G1 G2 < G1 G2 = G1 0(25) λi =m(Vi,Ui)/Vi =m(1,Ui/Vi)
This function can be inverted as h = m (1,.)-1 , which is a convex and increasing function :
(26) Ui =Vih(λi)
In our application, m(V,U)=zVαU1−α, where z is a scale parameter.
1.4.3 The job flow
The job flow is the difference between the number of posts left by workers and the posts filled. So the variation from one period of time to another of the number of workers within the firm is:
(29) i qNi iVi
dt
dN =− +λ
Similarly the variation of the unemployed is
Ut+1 – Ut = s Nt – m (Vt, Ut) = s (Lt – Ut) - m (Vt, Ut)
This is equivalent to in terms of rate: ) , 1 ( ) 1 ( 1 i i i i i i i t i t i t V U m U V L U u q u u+ − = − −
The stationary equilibrium of unemployment rate does not vary, we therefore deduce: ) ( ) 1 ( 0 i i t i h u u q λ λ − − = So, (30) q h h qh qh u i i i i i i i / ) ( ) ( ) ( ) ( λ λ λ λ λ λ + = + = (31) q h vi i i / ) ( 1 λ λ + =
ui is increasing in λi and vi is decreasing in λi : a higher number of unemployed means a larger arrival rate of applicants for a given number of vacancies. On the contrary, larger application arrival rates mean fewer vacancies for a given level of unemployment.
1.4.4 The BB curve
K, the total number of post is either vacant or filled: V1 + N1 + V2 +N2 = (V1 + L1 –U1) + (V2 + L2 – U2) = K
Let L1 (resp. L2) be the supply of type 1 (resp. type 2) workers, we have:
(33) L1 ( 1 + v1 – u1 ) + L2 (1 + v2 –u2) = K
According to (30) and (31), we obtain, by setting
q h q i i i i ) ( ) ( λ λ λ λ φ + + = (32) xφ(λ1)+(1−x)φ(λ2)=L
This relation between λ1 and λ2 is the BB curve illustrated by the graphic 3, which relates the equilibrium of job flows between the two segments of the labor market.
Graph 3: The equilibrium of job flows between the two segments of the labor market
1.4.5 The equilibrium
The equilibrium of this economy is represented by the intersection of the curve AA and the curve BB. We can observe that the choice of social composition of the firm is closely related to the conditions on the labor force market.
Indeed, we know that: (U1+N1)+(U2 +N2)= K. This equation can be rewritten: K p N N U p N N U N N + − = + + + + + )( (1 )) ( 1 2 1 1 2 1 2 2 . By dividing by L, we obtain: (27) 1 1 1 1 ) 1 ( ⎢⎣⎡ 1 2⎥⎦⎤ = − − + − − u p u p u
Let x be the proportion of workers of type 1 in the economy and (1-x) the proportion of workers of type 2, we have:
2 1 (1 x)u xu u= + − ,
[
1 2]
2 1 1 (1 ) 1 1 1 1 u xu xu p u p − + − = − − + − (28)[
1 2]
1 ) 1 ( 1 ) 1 ( u x xu x u p − + − − =In the next section we will carry out some comparative statics changing one parameter to analyze some shocks on the equilibrium. Such an exercise can give unambiguous results, unfortunately others results are obtained by using simulations. For example the effects of an increase in wage when the labor supply is endogenous are illustrated in the next section.
λ
1λ
21
1 0
1.5 The effects of shocks on the AA curve
In this section, we study the shocks which affect the arbitrage condition of the firm between the two types of vacancies, represented by the relation AA. Equation (24) shows that AA is parameterized by the interest rate r, the quit rate q, and by the ratio of gains. We focus on the determinants of relative gains. We observe that any increase in R implies a movement of the curve AA downward (see the graphic 4). Indeed, when gains associated to the hiring of a type-2 worker are relatively higher than those associated to the hiring of a type 1 worker, the firm prefers to post vacancies of type 2. It is necessary that the probability to fill a vacancy of type 1 increases, to compensate for this differential of gains. At equilibrium, the firm remains indifferent between the two types of vacancies.
What are the determinants of R ? Three parameters influence the value of R: the wages, the peer group effect and the variance of skills. We analyze the influence of each of these variables on unemployment and segregation within the firm.
When the labor supply and wages are exogenous, any evolution of the relative wages implies a modification of R. For example, if the type 2 wage decreases (dw2 < 0), it increases the gain obtained by the firm on a type 2 worker relative to a type 1 worker. Firms then post more type 2 vacancies and less type 1 vacancies. The labor supply remaining unchanged, the probability to provide a type 2 vacancy and the unemployment rate of this category decrease. A contrario, the scarcity of type 1 vacancies implies an increase in the unemployment rate of these workers and an increase in the probability to provide this type of vacancy.
Graph 4: Shocks on AA
Shocks affecting individual productivity y1 and y2 also lead to a modification of the ratio of
earnings R. The individual productivity of a worker depends both on its competence to solve problems and on the externality due to the organization of the work E (equation (4)). On the one hand, we assume that the workers of both type have an identical average level of skill. On the other hand, the variance of the skills of both categories can be different. This variance of skills directly affects the value of the organizational externality. Indeed, according to (13) we have:
[
a Sp p] [
p aS p p]
p AB N E= ( +(1− ) (1− )+ (1− )( )1/ AA λ1 BB λ2Where p p N p N j j N p N i i N a a a a AB − − = ⎟⎟ ⎠ ⎞ ⎜⎜ ⎝ ⎛ ⎟⎟ ⎠ ⎞ ⎜⎜ ⎝ ⎛ =
∏
∏
1 2 1 / ) 1 ( 2 / 1 / 1 ( ) ( ) ) ( 2 2 1 1This last term reflects the complementarities between the skills of the workers. It corresponds mathematically to the product of two series of numbers. Let a1 (resp. a2) be
the geometrical average of the skills of the workers of type 1 (resp. of type 2). These two geometrical averages are (inverted) indicators of the variance of skills within each category of workers.
By assuming that when it engages a worker, the employer considers that the worker has the average level of skills, it is then easy to calculate, according to the equation (4), the individual productivity of every category of workers:
[
] [
p]
p p p a a p p S a p Sp a y1 = ( +(1− ) +1 (1− )+ (1− )( 1) ( 2)1−[
] [
p]
p p p a a p p S a p Sp a y2 = ( +(1− ) (1− )+ (2− )( 1) ( 2)1−By replacing y1and y2 by their expression in R, we have:
[
] [
]
[
] [
1]
(1 ) 1 2 1 1 2 1 2 1 ) 2 ( ) ( ) ( ) 1 ( ) 1 ( ( ) ( ) ( ) 1 ( ) 1 ( ( w a a p p S a p Sp a w a a p p S a p Sp a R p p pp pp p p − + − − + − + − − + = + − −− −It is then possible to study the effect of a shock on S, on a1 or a2.
If the workers of type 1 are majority (p > 0,5), an intensification of the peer group effect increases the productivity of two workers' types (y1 and y2 increase) because the organizational externality E is strengthened. Nevertheless the increase in y1 is superior to that of y2. Indeed, as the social capital of type 1 workers develops more than the social capital of type 2 workers, this increases more the competence of type 1 workers to solve problems relatively to type 2 workers. Consequently, R decreases and formally AA moves upward. Companies post then more type 1 vacancies. Unemployment rate of type 1 workers decreases and the probability to provide a type 1 vacancy decreases. A contrario, the probability to provide type 2 vacancy increases, and the unemployment rate of type 2 workers increases. A similar reasoning can be applied when p<0,5.
When the variance of the skills of type 1 workers (respectively of type 2) increases, a1
(resp. a2) decreases. In this case, the strategic complementarities between tasks imply a
reduction in the organizational externality E, which has for consequence an increase in the level of unemployment in the economy. The unemployment rates of the two categories of workers do not however evolve necessarily in the same direction and depend on the distance between differentials in productivity and in wages. One notes indeed that
E w m E w m w y w y R / / 1 1 2 2 1 1 2 2 − − = − −
= . An increase in the variance of skills (decline in a ) is g
equivalent to an increase in wage costs because ( ( )>0
E w d
g
). However, the increase in this cost is not identical for two workers types. If 1
2 1 2 w w y y > then 0 ( ) ( ) 1 2 E w d E w d < < . Wage
costs weighted by E increase faster for type 1 workers than for type 2 workers. Consequently R increases. Firms post then more vacant jobs of type 2. The unemployment rate of type 2 workers decreases and the type 1 unemployment rate increases. Finally,
unemployment in the economy increases. On the contrary if 1 2 1 2 w w y y < , then ) ( ) ( 0 2 1 E w d E w d <
< and the results are in the opposite. 1.6 Shocks on the BB curve
In this section, we study the effects of shocks on the balance of the job flows between the two segments of the labor market (curve BB).
First of all, K, the number of posts in the economy, parameterizes BB. By leaving unchanged the labor supply, the effects of an increase in K is unambiguous. When the number of posts in the economy increases, the vacancies are more numerous. The labor supply remaining constant, the probability to provide these vacancies decreases. The curve BB moves downwards. Consequently, the unemployment rates of two workers types fall. This shock is illustrated on the graph 5.
Graph 5: Effect of the increase in the number of posts in the economy (movement of the curve BB)
Besides, the “social” composition of labor supply implies a rotation of BB. By leaving unchanged total labor supply, increasing the proportion of type 1 workers increase the slope of BB. It becomes more difficult to provide a type 2 vacancy, because the workers of this type are less numerous. This case is illustrated on the graph 6 on the next page.
AA
λ1 BB
λ2
Graph 6 : Change in the composition of the working offer (rotation of the curve BB)
1.7 Simultaneous shocks on AA and BB curves: Shocks on wage with endogenous labour supply
We are now going to study the effect of simultaneous shocks on the curve AA and on the curve BB. To do this, we make endogenous the labor supply of each category. Let us assume that labor supply of type 1 workers is decreasing with wage, whereas labor supply of type 2 is increasing. In theory when w2 increases, it entails three effects:
- The first is a relative decline in profit obtained by the firm on type 2 jobs. It is translated diagrammatically by an upward shift of the curve AA.
- Second and third effects are associated to a modification of the labor supply of type 2 workers. An increase in the wage entails a stronger participation of the type 2 workers in the labor market and consequently the rate of post by worker decreases. We can see diagrammatically an upward shift of the curve BB. It easier for the firm to provide a vacant job and the probabilities associated to it therefore increase. Besides, the composition of the workforce is modified with a stronger proportion of type 2 workers. It is translated graphically by a rotation of the curve BB around the axis of 45 degrees anticlockwise. To understand this movement let us keep λ1 constant. On the one hand an increase in the participation of the type 2
workers raises their unemployment rate since immediate gains realized by the firm is weaker for this category of worker than for type 1 workers. On the other hand, if the gain of the type 2 workers is higher (due to an improvement in productivity), an increase in the participation of type 2 workers implies a decline in their unemployment rate.
The graph 7 illustrates this shock. The dimension of the two movements of the curve BB (rotation and translation) depends not only on the elasticity of labor supply (as regards the translation) but also on the difference between unemployment rates and vacancy rates (as regards the rotation). As a consequence it is not possible to determine analytically the direction of movement of the equilibrium. But, this reasoning will help us to interpret our simulations.
AA
λ1 BB
Graph 7: Increases in wages with endogenous labor supply
In theory when w1 increases, movements are different from those analyzed above. Indeed, an increase in w1 implies a decline in type 1 labor supply. This leads to three effects. The
curve AA moves downwards. As a consequence probability for a firm to employ a worker of type 2 has to fall. The movements of the curve BB are in the opposite direction when w2
increases. This entails a downward movement of BB, which rotates clockwise. Results at equilibrium are not tractable analytically but the results of simulations are interpretable. We now turn to the interpretations of simulations realized using various social and occupational groups.
2 Some simulations: the segregation of female on labor
market
In this part, we consider that the type of the individuals is given by their gender. Although this criterion seems limited for defining the community membership of the workers, segregation by the gender is a striking characteristic of the labor market (Groshen (1991), Bayard, Hellerstein, Neumark and Troske (2003)). Furthermore, gender is a socio-demographical characteristic of workers, which is very well informed in statistical surveys, and this enables the simulation of the model. The women situation on the labor market is paradoxical. For the same level of skill, although their wage is weaker than that of men, their unemployment rate remains higher. In what follows, we are going to consider that the workers of type 1 are men and the workers of type 2 are women. We begin by calibrating the model. Our data are extracted from the “Enquête Emploi” of 2002, which gives details on French labor market characteristics.
Simulations were led within four groups of skills: the executives, the intermediate occupations, the blue collars and the white collars. In order to control the heterogeneity of skills, we also led these simulations on finer groups of skills: the administrative and commercial executives, the engineers and the technical executives, the engineers, the intermediate occupations of the health, the skilled and unskilled blue collars of industry and the administrative employees of private firms. The “Enquête-Emploi” distinguishes between the employees of the private sector and those of public sector. Except for health intermediate occupations for which no distinction is made for the sector (private or public), we concentrated our attention on the workers of the private sector. These simulations show,
AA
λ1 BB
for every occupation, the existence of a unique equilibrium and allow an estimation of the value of the peer group effect S.
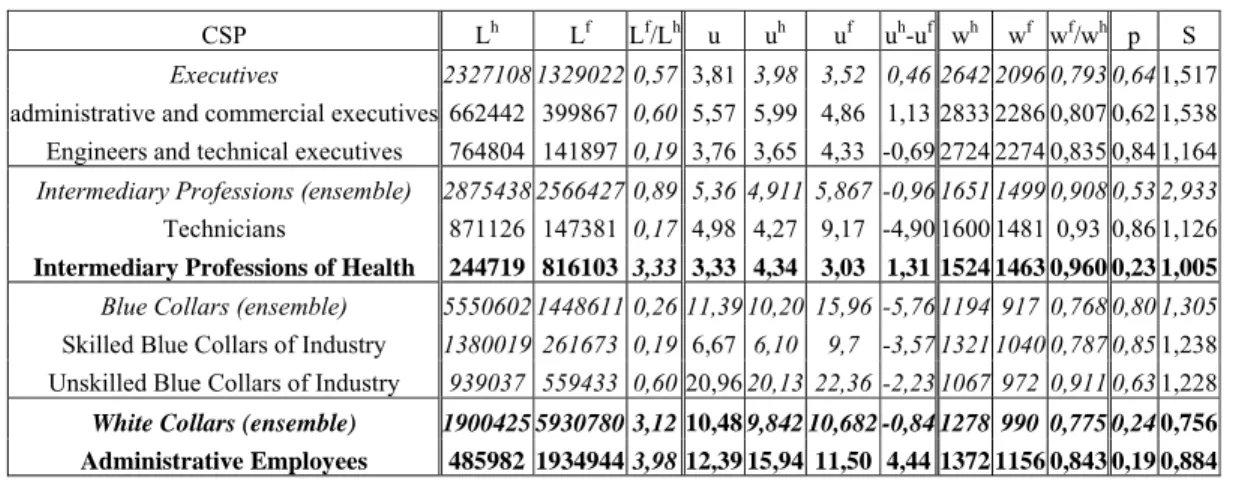
The table 1 sums up the characteristics of the equilibrium on the French labor market in 2002. For every occupation, it indicates the unemployment rates, the wages and the labor supply of male and female workers. For calibrating the model we fix some parameters. Interest rate r is fixed to 2 %. Following Fève and Langot (1994), we fix the elasticity of substitution of the matching function to 0,58. We assume a quit rate q of 10 %. To be able to identify the parameters of the model, we assume that the wage costs amounts for 52,8 % of the firm output (INSEE (2003))2. With this specification, all parameters of the model
can be identified.
The table 1 allows splitting the groups of skills into two categories: occupations with male predominance and those with female predominance. The women are overrepresented at the employee's and the intermediate occupations of the health, while they are very strongly minority in the other studied groups of skills. This distinction by gender of occupations is associated to differentiated peer group effects:
Table 1: Simulation of the peer group effect within occupations
CSP Lh Lf Lf/Lh u uh uf uh-uf wh wf wf/wh p S
Executives 2327108 1329022 0,57 3,81 3,98 3,52 0,46 2642 2096 0,793 0,64 1,517
administrative and commercial executives 662442 399867 0,60 5,57 5,99 4,86 1,13 2833 2286 0,807 0,62 1,538 Engineers and technical executives 764804 141897 0,19 3,76 3,65 4,33 -0,69 2724 2274 0,835 0,84 1,164
Intermediary Professions (ensemble) 2875438 2566427 0,89 5,36 4,911 5,867 -0,96 1651 1499 0,908 0,53 2,933
Technicians 871126 147381 0,17 4,98 4,27 9,17 -4,90 1600 1481 0,93 0,86 1,126 Intermediary Professions of Health 244719 816103 3,33 3,33 4,34 3,03 1,31 1524 1463 0,960 0,23 1,005
Blue Collars (ensemble) 5550602 1448611 0,26 11,39 10,20 15,96 -5,76 1194 917 0,768 0,80 1,305
Skilled Blue Collars of Industry 1380019 261673 0,19 6,67 6,10 9,7 -3,57 1321 1040 0,787 0,85 1,238
Unskilled Blue Collars of Industry 939037 559433 0,60 20,96 20,13 22,36 -2,23 1067 972 0,911 0,63 1,228
White Collars (ensemble) 1900425 5930780 3,12 10,48 9,842 10,682 -0,84 1278 990 0,775 0,24 0,756
Administrative Employees 485982 1934944 3,98 12,39 15,94 11,50 4,44 1372 1156 0,843 0,19 0,884 Source: Enquête Emploi (2002).
Lecture: h indicates male data and f female ones.
- In predominantly male occupations S is always superior to unity. If one refers to the concept of social capital, it would seem that male solidarity favors the cohesion, which supports the efficiency of communications within occupations where men dominate in number. Consequently, firms can try to keep a homogeneous workforce in gender to facilitate the development of social capital. It would be difficult for women to integrate predominantly male occupations.
- In predominantly female occupations, either there is no peer group effect (S=1) as in the case of the intermediate occupations of the health, or S is lower than the unity as in the case of the employees. In this case, the social capital is developed by the interaction of heterogeneous workers in gender, which would favor creative exchanges and innovation. Consequently, firms can try to integrate more men into predominantly female occupations.
These results cover up partially intuitions presented in the model of Goldin (2002). According to her, when women penetrate into occupations with male predominance, the women would be victim of the male “hostility”. Goldin models this hostility as a loss in prestige undergone by the men when their profession feminizes. Within the framework of our formalization, a high value of the peer group effect in predominantly male occupations could also be interpreted as a hostility of men against women.
The research of sociology and management in organizational demography also feeds the results of our simulations. The review of the literature made by Williams and O’Reilly (1998) on the effect of the “social” heterogeneity in organizations includes numerous works which show that men inserted into organizations where the women are majority do not feel hostility from their female colleagues while the women are treated with hostility in the reverse case.
From these calibrations of the model, we are going to illustrate the impact of an increase in wage when the labor supply is endogenous. There is not, to our knowledge, an estimation of the elasticity of the labor supply according to gender on French data. We fixed the elasticity of male labor supply by calculating the average of estimations obtained by Hassman (1981) and Ashworth and Ulph (1986). It amounts to -0,15. For women, this elasticity is fixed +0,5, this value is the average of estimations obtained by Hassman (1981) and Arrufat and Zalbalza (1986). For each occupation, we are going successively to interpret results obtained by increasing the wage of women and men.
The engineers and the technical executives
When the female wage of engineers increases, the female and male unemployment rates respectively increase and decrease. It implies weak movements of the curve BB relative to those of curve AA. The cost effects dominate the labor supply effects.
When the male wage increases, the participation of men in the labor market falls, and nevertheless the unemployment rate of men increases, whereas the female one decreases. It would indicate that effects of relative costs counterbalance the labor supply effects. Women's proportion increases in the firm.
Simulation of an increase in wages for the engineers and the technical executives
Increase in female wage
wf wh uf uh yf yh R K/L p
2274 2724 .0433 .0365 4599 5105 .97 1.153 .8444 2296 2724 .0462 .0362 4596 5102 .96 1.152 .8442 2319 2724 .0496 .0360 4594 5099 .95 1.1513 .8440 2342 2724 .0534 .0357 4593 5097 .94 1.1504 .8439
Increase in male wage
wf wh uf uh yf yh R K/L p
2274 2724 .0433 .0365 4599 5105 .97 1.153 .8444 2274 2751 .0399 .0366 4603 5108 .988 1.1546 .8437 2274 2778 .0369 .0368 4607 5112 .999 1.1560 .8431 2274 2805 .0342 .03706 4611 5116 1.011 1.1575 .8425
The administrative and commercial executives
For administrative and commercial executives, the ratio of gains R is higher than unity contrarily to the case of engineers. It means that the firm would like to hire more women. But frictions on the market prevent it. When female wage increases the female unemployment rate increases too, the cost effects dominate the labor supply effects. The
evolution of unemployment occurring after an increase in male wage is analogous to the case of engineers and technical executives.
Simulation of an increase in wages for the administrative and commercial executives
Increase in female wage
wf wh uf uh yf yh R K/L p
2286 2833 .0486 .0598 4661 5164 1.018 1.0462 .6207 2288 2833 .0489 .0597 4660 5163 1.017 1.0460 .6207 2290 2833 .04937 .05959 4659 5163 1.0168 1.0458 .6208 2292 2833 .0497 .0594 4659 5162 1.015 1.0456 .6208
Increase in male wage
wf wh uf uh yf yh R K/L p
2286 2833 .0486 .0598 4661 5164 1.018 1.0462 .6207 2286 2836 .04801 .06028 4662 5164 1.0205 1.0463 .6205 2286 2839 .04743 .06066 4663 5164 1.0222 1.0464 .6202
The technicians
This profession is a strongly predominantly male and relative earning R is lower than unity. Following an increase in the female wage, the unemployment rate of women increases and that of men decreases. The productivity of all workers increases because the proportion of men in the firm increases. With an increase in the male wage, the male unemployment rate does not evolve while the feminine unemployment rate decreases a lot. The proportion of men decreases but individual productivity which that is sex increases.
Simulation of an increase in wages for the technicians
Increase in female wage
wf wh uf uh yf yh R K/L p
1481 1600 .0917 .0427 2784 3034 .9083 1.1420 .8616 1488 1600 .0964 .0424 2784 3035 .9030 1.1416 .8620 1495 1600 .1016 .0421 2785 3036 .8977 1.1412 .8624 1503 1600 .1072 .0419 2786 3037 .8923 1.1408 .8629
Increase in male wage
wf wh uf uh yf yh R K/L p
1481 1600 .0917 .0427 2784 3034 .9083 1.1420 .8616 1481 1616 .0825 .0430 2784 3034 .9192 1.1435 .8602 1481 1632 .0747 .0433 2785 3034 .9303 1.1449 .8590
The intermediate occupations of health
The ratio of gains R is grater than unity as in the previous case. An increase in the female wage leads to a decline in women's proportion in this predominantly female occupation. The unemployment rate of the women increases whereas that of the men decreases. As the women are proportionally less numerous in the firm the productivity of all the workers falls. Following an increase in the male wage, the male unemployment rate increases and that of the women decreases. The cost effects, combined with the effect of composition of labor supply dominates once again the decline in labor supply. As her productivity increases, the female employment rate increases.
Simulation of an increase in wages for the intermediate occupations of the health
Increase in female wage
wf wh uf uh yf yh R K/L p
1463 1524 .03030 .04340 2799 2791 1.0544 1.1790 .2283 1478 1524 .03031 .04194 2790 2782 1.0431 1.1745 .2279 1492 1524 .03273 .04048 2781 2773 1.0317 1.1700 .2275 1507 1524 .03406 .03900 2773 2765 1.0201 1.1655 .2272
Increase in male wage wf wh uf uh yf yh R K/L p 1463 1524 .03030 .04340 2799 2791 1.0544 1.1790 .2283 1463 1539 .02970 .04643 2801 2793 1.0671 1.1794 .2274 1463 1554 .02911 .04982 2803 2795 1.0802 1.1798 .2264 1463 1570 .02853 .05363 2805 2797 1.0935 1.1802 .2253 The employees
In this predominantly female occupation, R greater than 1. The female unemployment rate increases when the wage of the women increases; the male unemployment rate decreases. Productivity decreases because man's proportion increases. The effects of an increase in the male wage are similar to those obtained with the intermediate profession of the health.
Simulation of an increase in wages for the white collars
Increase in female wage
wf wh uf uh yf yh R K/L p
1156 1372 .1150 .1594 2235 2411 1.0386 1.0039 .1926
1168 1372 .1189 .15168 2231 2406 1.0287 1.0000 .1940 1179 1372 .1230 .14409 2228 2401 1.0186 .9960 .1953 1191 1372 .12726 .13667 2224 2397 1.0084 .9921 .1966
Increase in male wage
wf wh uf uh yf yh R K/L p
1156 1372 .1150 .1594 2235 2411 1.0386 1.0039 .1926
1156 1379 .1135 .1659 2235 2412 1.0445 1.0041 .1910
1156 1386 .11230 .1729 2235 2413 1.0505 1.0043 .1894 1156 1393 .11092 .1801 2235 2414 1.0565 1.0044 .1877
Skilled blue collars
Following an increase in female wage, the unemployment of the women increases and that of men decreases. The productivity of the two groups of workers increases as the proportion of men increases. When the wages of men increase, the unemployment of the women decreases heavily while that of the men increases weakly. In that case the effect of labor supply is strong as it compensates almost for the cost effect. This case contrasts with the previous cases.
Simulation of an increase in salaries for the skilled blue collars
Increase in female wage
wf wh uf uh yf yh R K/L p
1040 1321 .09707 .06100 2134 2473 .9498 1.0790 .8458 1045 1321 .10153 .06062 2134 2473 .9450 1.0786 .8462 1050 1321 .10644 .06022 2134 2474 .9401 1.0782 .8466 1056 1321 .11177 .05979 2135 2475 .9351 1.0777 .8471
Increase in male wage
wf wh uf uh yf yh R K/L p
1040 1321 .09707 .06100 2134 2473 .9498 1.0790 .8458 1040 1334 .08640 .06181 2134 2471 .9625 1.0804 .8439 1040 1347 .07748 .06255 2135 2470 .9752 1.0817 .8423 1040 1361 .06991 .06322 2136 2470 .9879 1.0831 .8410
Unskilled blue collars
This occupation faces a strong unemployment rate. When the female wage increases, the female unemployment rate increases and the male unemployment rate decreases. Male productivity increases as proportion of men in the firm increases.
When male wage increases, the female unemployment rate decreases very strongly. The productivity of the women increases whereas that of the men decreases. The ratio of gains increases in favor of women, and as a consequence proportion of men in the firm falls.
Simulation of an increase in salaries for the unskilled blue collars
Increase in female wage
wf wh uf uh yf yh R K/L p
972 1067 .22360 .20130 1887 1993 .9881 .8847 .6333 977 1067 .23640 .19509 1887 1997 .9785 .8839 .6383 982 1067 .25055 .18847 1887 2002 .9685 .8831 .6439
Increase in male wage
wf wh uf uh yf yh R K/L p
972 1067 .22360 .20130 1887 1993 .9881 .8847 .6333 972 1078 .19703 .21622 1890 1986 1.0108 .8854 .6206 972 1088 .17504 .23001 1896 1983 1.0326 .8864 .6097
Conclusion:
In this model, interactions between workers imply externalities favorable to their productivity. These externalities come from work organization. As in the model of hierarchy of Rosen (1982), the work organization generates an economy of scale which improves the productivity of all workers. Nevertheless our model takes into account the horizontal interdependency between tasks using the O-ring function introduced by Kremer (1993). The originality of our work is to endogenize the competence to solve problems which determines the matching of workers. This competence depends both on skill and work organization. This organization highlights the role of the individual characteristics (here the gender).
We assume an identical average of skills among individuals in both groups but they could be differently distributed. Because the gain earned on different type of workers is not the same, the firm tries to hire a specific type of worker. This behavior illustrates the dualism of labor market. We consider the model of Saint Paul (1996 b). This model underlines the role of externalities arising from the search activity in two segments of the labor market and their interaction.
To calibrate the model, we use the data on gender within different occupational categories. For each one, we set the values of the parameters of the model, which reproduce the unemployment rate and the empirically observed part of the wages of the product. Afterwards, we realize comparative static to analyze the impact of an increase on the effect of the peer group S, which affects the efficiency of the communication into the group and between groups. We also analyze the impact of an increase in the variance of the men and women qualification. Finally, we study the impact of the wage increase when the labor supply is endogenous.
An increase in the parameter S leads to an increase in the segregation and an increase in the unemployment rate of the minority employees inside the firm. In our model, the impact of the peer group S leads to this kind of inertia and contributes to the explanation of the maintained difference in the unemployment rate between different groups of workers,
especially for the women and men. S produces a hysteresis phenomenon in the segregation, which not disappears. Because employers support each other it is rational for the firm to take advantage of this by maintaining this solidarity.
An increase in the variance of the individual skill, for the women and men, improves employment of women and increases male unemployment. The only exception concerns the technicians. This result could be linked to the initial disparities of the wage and productivity. In fact, the higher the difference between the two types of workers in terms of wage and productivity is, the higher the segregation is.
Finally an increase in wage with an endogenous labor supply (if we consider non compensated elasticity of wage, which takes into account income and substitution effects) damages the employment of the group for which the wage was increased and improves the employment of the other group. This symmetry seems surprising because the elasticity of the two groups (women and men), which are used, have opposite signs. This means for men that a reduction of their participation rate to the labor market cannot compensate the increased of wage. In general there exists a deterioration of their unemployment rate. Several extensions of the model can be considered. First we assume in our model that there is non communication cost between workers. We could endogenize the work organization by specifying such costs. For example, Greenan and Guellec (1994) distinguish centralized and decentralized firms.
In the case of centralization, some workers are specialized in the conception activities and others in the execution ones. The conception service invents “methods to solve problems”, which imply a fix cost, but these methods can be used by all execution workers. This generates increasing return to scale. In case of decentralization, the learning by doing is explicit. Each employee invents his own method to solve the problems he faces at work, which implies individual cost. While the impact of the peer group on the individual productivity compensates the communication cost, it would be rational for the firm to delegate some autonomy to workers who have the majority. In our simulation, we observe that the impact of the peer group is inferior to unity for women. This could explain why women occupy post which do not have the innovative characteristics of the work organization (Greenan and Walkowiak (2004)).
Afterward, it would be possible to endogenize the wage in our model. For instance, we could specify a bargaining procedure between employees and employers with the respective threat point, the unemployment and the vacancy.
Finally, last but not least we should endogenize the parameter S which is only valid in the short run. In fact, it is reasonable to think that this parameter tends to unity when the mixture is more effective.
Bibliography
ADLER P. and KWON S. W. (1999) : “Social Capital : the Good, the Bad and the Ugly”, mimeo.
ARRUFAT J.L. and ZABALZA A., (1986): “Female Labour Supply with Taxation, Random Preferences, and Optimization Errors”, Econometrica, Vol. 54, pp. 47-63.
ASHWORTH J. and ULPH DT., (1981): “Estimating Labour Supply with Piecewise Linear Budget Constraints”, in Brown C. (ed), Taxation and Labour Supply, London, Allen et Unwin.
BAYARD K., HELLERSTEIN J., NEUMARK D. and TROSKE K., (1999) : “New evidence on sex segregation in wages from matched employee-employer data”, NBER WP, n°7003.
BOURDIEU P. (1986) : “The forms of capital”, Handbook of theory and research for the sociology of
BURT R., (1992) : Structural Holes, Cambridge, Harvard University Press.
CAPELLI P., BASSI L., KATZ H. KNOKE D., OSTERMAN P., and USEEM M., (1997) : Change at Work, New York : Oxford University Press.
CARMICHAEL H. L. and MACLEOD W. B., (1993) : “Multiskilling, Technical Change and Japanese Firm”, Economic Journal, n°103, pp. 142-160.
CAROLI E., GREENAN N. and GUELLEC D., (1997) : “Organizational Change and Skill Capital Accumulation”, Industrial and Corporate Change, Vol. 10, n°2, pp. 481-506.
COLEMAN J. (1990) : Foundations of Social Theories, Cambridge, Harvard University Press.
CRIFO-TILLET P., DIAYE and GREENAN N., (2002) : “Pourquoi les entreprises évaluent-elles leurs salariés individuellement ?”, Document de travail du CEE, n° 21.
DOLADO J.J., FELGUEROSO F. and JIMENO J., (2001) : “Female Employment and Occupational Changes in the 1990s: How is the EU Performing Relative to the US?”, European Economic Review,
Vol. 45, 875-879.
DOERINGER P. and PIORE M.J., (1971): Internal labor Market and Manpower Analysis, Lexington (Mass.)
DOLADO J.J., FELGUEROSO F. and JIMENO J., (2002): “Recent Trends in Occupational Segregation by Gender: a Look across the Atlantic”, IZA working paper, n° 524, July.
FEVE P. and LANGOT F., (1994): “The RBC Models through Statistical Inference”, Journal of Applied Econometrics, Vol. 9, Supplement, pp. S11-35.
FRYER R. G. and JACKSON M. O., (2003) : “Categorical Cognition : A psychological Model of Categories and Identification in Decision Making”, mimeo, University of Chicago.
GITTLEMAN M., HORRIGAN M. and JOYCE M., (1998): “Flexible Workplace Practices: Evidence from a Nationally Representative Survey”, Industrial and Labor Relations Review, Vol. 52, n°1, pp. 99–115. GLAESER E. and SCHEINKMAN J., (2002) : “Non Market Interactions”, miméo.
GLAESER E. L., LAIBSON D. SACERDOTE B., (2000): “The Economic Approach to Social Capital”,
NBER Working Paper, n° 7728.
GOLDIN C., (2002): “A Pollution Theory of Discrimination: Male and Female Differences in Occupations and Earnings”, NBER WP, n°8985, June.
GOSHAL S. and NAHAPIET J. (1998) : “Social Capital, Intellectual Capital, and the Organizational Advantage”, Academy of Management Review, Vol. 23, n° 2, p. 242-266.
GREENAN N. and GUELLEC D., (1994) : “Coordination within the firm abd endogenous growth”,
Industrial and Corporate Change, Vol. 3, n° 1, pp.176-197.
GREENAN N. and WALKOWIAK E., (2004): “Informatique et organisation du travail: au delà de la complémentarité technologique, les interactions sociales”, Document de travail du Centre d’Etudes de
l’Emploi.
GROSHEN E.L. (1991) : “Sources of intra-industry wage dispersion: How much do employers matter?”,
Quarterly Journal of Economics, 106, pp. 869-884.
HAUSMANN J.A., (1981). «Labor Supply», in H.J. Aaron and J.A. Pechman (ed.): How Taxes Affect
Economic Behaviour, Washington D.C: Brookings Institutions.
HELLERSTEIN J. and NEUMARK D., (2002) : “Ethnicity, Language, and Workplace Segregation : Evidence from a new matched employer-employee data set”, NBER WP, n° 9037.
INSEE (2003): “Rapports sur les comptes de la nation 2002”, Insee Résultats, n°9, juillet.
KREMER M., (1993) : “The O’Ring Theory of Economic Development”, Quarterly Journal of Economics, Vol. CVIII, n°3, August, pp. 551-575.
KREMER M. and MASKIN E., (1996) : “Wage Inequality and Segregation by Skills”, NBER Working
Paper, n°5718, August.
LEANA C. and VAN BUREN H. J. (1999) : “Organizational social capital and employment practices”,
Academy of Management Review, Vol. 24, n°3, pp. 538-555.
LINDBECK A. and SNOWER D. J., (1996) : “Reorganization of Firms and Labor Market Inequality”,
American Economic Review, AEA Papers and Proceedings, Vol. 86, n°2, May, pp. 315-321.
LINDBECK A. and SNOWER D. J., (2000) : “Multitask Learning and the Reorganization of Work: From Tayloristic to Holistic Organization”, Journal of Labor Economics, Vol. 18, n°3, p. 353–376.