OATAO is an open access repository that collects the work of Toulouse
researchers and makes it freely available over the web where possible
Any correspondence concerning this service should be sent
to the repository administrator:
[email protected]
This is an author’s version published in:
http://oatao.univ-toulouse.fr/24104
To cite this version:
Dietrich, Nicolas and Wongwailikhit, Kritchart and Mei, Mei
and Xu, Feishi
and Felis, Francisco
and Kherbeche, Abderrahmane and Hebrard, Gilles and
Loubière, Karine
Using the “Red Bottle” Experiment for the Visualization and
the Fast Characterization of Gas–Liquid Mass Transfer. (2019) Journal of
Chemical Education, 96 (5). 979-984. ISSN 0021-9584
Using the
“Red Bottle” Experiment for the Visualization and the Fast
Characterization of Gas
−Liquid Mass Transfer
Nicolas Dietrich,
*
,†Kritchart Wongwailikhit,
†,‡Mei Mei,
†,∥Feishi Xu,
†Francisco Felis,
∥Abderrahmane Kherbeche,
§Gilles Hébrard,
†and Karine Loubière
∥†Laboratoire d’Ingénierie des Systèmes Biologiques et des Procédés LISBP, CNRS, INRA INSA, Université de Toulouse, Toulouse
31077, France
‡Department of Environmental Engineering, Faculty of Engineering, Chulalongkorn University, Bangkok 10330, Thailand §International Center for Applied Mechanics, State Key Laboratory for Strength and Vibration of Mechanical Structures, Xi’an
Jiaotong University, Xi’an 710049, People’s Republic of China
∥Laboratoire de Génie Chimique LGC, Université de Toulouse, CNRS, INPT, UPS, Toulouse 31077, France
*
S Supporting InformationABSTRACT: This paper presents a demonstration of the visualization and the characterization of gas−liquid mass transfer in a small bubbly column. The aim is to show how simple experiments can be used to directly quantify mass transfer without the need of sophisticated probes or complex titrations. The method here proposed is based on the“red bottle” reaction, i.e., the reversible oxidation by oxygen of dihydroresorufin to red resorufin. This reaction produces a distinctive red color, and in the specific condition identified, the time required to turn from colorless to red solution can be directly correlated with the inverse of the volumetric mass transfer coefficient kLa (s−1). Therefore, this reaction can be used to estimate the massflux of oxygen
transferred from the gas phase (bubbles) to the liquid phase and to study how thisflux is affected by geometrical and operating parameters of bubblyflows. The lab work described is thus very convenient for education purposes. This is the first visual demonstration allowing mass transfer to be quantified with good precision, opening up a wide range of applications.
KEYWORDS: Upper-Division Undergraduate, Demonstrations, Chemical Engineering, Hands-On Learning/Manipulatives, Kinetics, Industrial Chemistry, Mechanisms of Reactions, Transport Properties, Organic Chemistry
■
INTRODUCTIONThe “blue bottle” experiment, in which a transparent liquid turns blue when shaken and becomes colorless when left at rest, is a very popular reaction for both demonstration purposes and practical work in educational activities. It requires three chemicals: glucose, sodium hydroxide, and methylene blue (dye) in water. The origins of this experiment are not well-known. Thefirst references to reactions between sugar and this dye (synthesized by Heinrich Caro in 1876) date back to the 1920s.1−3The name“Blue Bottle Experiment” wasfirst popularized by Campbell4in 1963 who demonstrated the occurrence of a 4-step reaction scheme between glucose, dissolved air (oxygen), and dye, and proposed a global equation of the reaction of glucose and air with the dye, regenerated in the reaction system, as a catalyst. Many variations and modifications of the pioneer experiment have
been put forward. Researchers5 proposed the use of other sugars and dyes to achieve different reaction rates and colors or a“green” version6based on the use of vitamin and avoiding the use of sodium hydroxide. Some of these systems can be implemented to display other colors, like the “red bottle” experiment, sometimes called the “Vanishing Valentine”,7,8 involving resazurin, or a sequence of three colors yellow/red/ green called the“multicolored bottle” using indigo carmine.9 These reactions have been used as an interesting activity on reaction mechanism identification.10
Recently, alternative compositions have been proposed11,12 by adding benzoin in the liquid phase in order to catalyze the reaction, and
suggesting other molecules as the dye: safranin (red), phenanthrenequinone (orange), erioglaucine (light blue), and tetrazolium chloride (red). This reaction has been largely used as a demonstration, but recently, some authors have used it as an accurate tool13,14 to characterize the mass transfer at the gas−liquid interface in chemical engineering systems. The first works devoted to mass transfer around bubbles flowing in a millimetric channel have been reported in refs15−19. Later, the mass transfer was studied in a thin gap cell20−22and in a bubbly column.23,24 Thanks to a specific calibration procedure15and by considering a simple mass balance in the liquid phase,17the oxygenflux transferred and the gas−liquid mass transfer coefficients could be quantified in different types of systems. However, all these studies have required expensive high-speed or high-resolution image acquisition systems and specific, heavy image processing that are quite impossible to implement in a chemistry lab for students. Recently, a simple demonstration25has been proposed to illustrate the gas−liquid mass transfer in a stirred tank at different scales; for that, they have used the “blue bottle” reaction to visualize the rate of mass transfer and how this rate was affected by the size of the vessel, the air flow rate, and the rotational speed. The time required to obtain a steady color change could be analyzed and discussed in relation with the classical gas−liquid mass transfer correlations26in order to illustrate the effects of the operating conditions. These authors did not note that this time could also be directly linked to the overall gas−liquid mass transfer coefficient, and that a direct and simple calculation would be possible if the“red bottle” experiment was used instead of the “blue bottle” thanks to its faster kinetic properties.27
The objective of the present paper is to propose a demonstration that enables the gas−liquid mass transfer to be visualized and, with the observation of the color change from colorless to red, the overall gas−liquid mass transfer coefficient to be determined. For illustrative purposes, this is applied in a small bubble column where bubbles are generated by sparging.
■
PRINCIPLEThis method is performed with the reaction system involving resazurin with sodium hydroxide and glucose in a small bubbly reactor (250 mL). In bubbly reactors, aeration provides a perfect mixing to the liquid phase (i.e., the concentration is uniform in the liquid phase); then, on the basis of an oxygen mass balance in the liquid phase, one can write
C t Ek a C C d d ( ) O2 m,O2 L m,O2 m,O2 φ = = * − (1)
withφO2being the massflux of oxygen transferred per unit of volume in g/s/m3, Cm,O2the mass concentration of oxygen in
g/m3, k
La the volumetric gas−liquid mass transfer coefficient in
s−1, E the enhancement factor, and Cm,O2* the oxygen saturation
concentration in g/m3.
In this study, a chemical reaction involving resazurin with sodium hydroxide and glucose in a small bubbly reactor (250 mL) has been considered. This reaction is fast (typically few milliseconds27): the concentration of oxygen, Cm,O2, remains always null (Cm, O2= 0) as it is instantaneously consumed by
the dye (dihydroresorufin).15 Some authors15,17 have also demonstrated that the enhancement factor, E, is equal to 1 in the classical bubble column condition (namely, when liquid-side mass transfer coefficients kLare about 10−4m/s, see the
Supporting Information). As shown ineq 2, 2 mol of dye react with 1 mol of oxygen:
O 2dihydroresorufin (colorless) 2resorufin (pink/red) 2H O 2 2 + → + (2)
As a consequence, and because no oxygen is present in the liquid at the beginning, one can write
C t C t d d 1 2 d d O2 coloreddye = (3)
Here, CO2, Ccolorlessdye, and Ccoloreddyeare, respectively, the molar
concentrations in oxygen, dihydroresorufin (colorless), and resorufin (colored) in mol/m3. By coupling eqs 1 and 3, the following equation is obtained:
C t k a C M 1 2 d d coloreddye L m,O2 O2 = * (4)
With integration ofeq 4from t = 0 to time t, the following equation is deduced: k a C C M M t 2 1 L m,coloreddye m,O2 O2 dye = * (5)
with M being the molar mass (either of oxygen or dye) in g/ mol and Cm,coloreddyethe dye concentration in g/m3.When all
the colorless reactant (dihydroresorufin) is consumed (complete conversion), the solution reaches its maximum color intensity, corresponding to a concentration where the red dye (resorufin) is equal to the initial concentration of the colorless dye (dihydroresorufin), namely, Cm,coloreddye =
Cm,colorlessdyeinitial . In such conditions, it becomes possible to
calculate the volumetric gas−liquid mass transfer coefficient directly from the knowledge of the initial concentration of dye and the measured aeration time, as illustrated ineq 5. To make the calculation easier, the initial concentration of the dye could fulfill the following condition:
C M M C 2 m,colorlessdye initial dye O2 m,O2 = * (6)
With Mdye= 229.19 g/mol, MO2= 32 g/mol, and Cm,O2* = 8.15
mg/L,15this concentration then corresponds to Cm,colorlessdyeinitial =
116.7 mg/L or Ccolorlessdyeinitial = 0.51 mmol/L. In this specific
condition, the calculation of the volumetric gas−liquid mass transfer is equal to the inverse of the coloration time as
k a t . 1 L coloration = (7)
It can be noted that this concentration is only recommended for an easy and direct calculation of the mass transfer coefficient (eq 7); the concentration of the dye can indeed be increased in order to make the experiment longer, thus increasing the precision of the measurement. The concen-tration can also be reduced in order to reduce the cost of the experiments.
It is interesting to observe that this experiment is very close to the sulfite static method classically used for the measure-ment of the mass transfer coefficient.28,29In the latter method, for a given aeration time, the sodium sulfite (Na2SO3) reacts with the oxygen transferred into the liquid phase by the bubbles generated. The concentration of the remaining sulfite is determined by the iodometric method (oxidation of sulfite
by iodine, and titration of excess iodine by sodium thiosulfate). As the initial oxygen concentration is kept at zero (nitrogen flushing), kLa is then calculated from a very similar mass
balance linking the aeration time to the amount of sulfite reacted: k a C C M M t 2 1 L Na2SO3 O2 O2 Na2SO3 aeration = * (8)
As a consequence, this technique with the “red bottle” proposed in this paper can be seen as a visualization extension of the classical titration with sulfite.
It is also important to keep in mind that, at present, the technique can be applied only with resazurin. Indeed, the knowledge of additional data (kinetic constant and order, diffusion coefficients in basic solution of oxygen and dye) is needed to validate that the chemical regime is still fast with respect to the mass transfer process. This has been demonstrated for the resazurin system17 but not yet for the “blue bottle” experiment and other systems. If this condition is not reached (ttransfer = 1/kL.a ≫ treaction), the enhancement
factor E can become higher than 1, meaning that the methods cannot be used as previously described and further calculations are needed.
■
MATERIALExperiments were carried out in a glass bubble column (0.045 m in diameter, 0.40 m high, 0.23 m height of liquid), submerged in a water bath regulated in temperature (Figure 1). The air sparger was a multiple orifice plate with two orifice
sizes, 0.5 and 0.8 mm, having an interval of 1 cm between adjacent orifices. The gas was provided from a pressurized gas network in the laboratory. The gas superficial velocity (flow rate over the column section) was set to 0.6 cm/s, corresponding to a flow rate of 0.6 L/min. The column was filled with 250 mL of the colorimetric solution. The concentration of the dye was chosen at 116.7 mg/L in order to use the simpleeq 7. In the presence of sodium hydroxide (20 g/L), and glucose (20 g/L), the resazurin (blue) wasfirst reduced to resorufin (pink/red), which was then reduced to dihydroresorufin (colorless) as shown byeq 2. The presence of glucose and sodium hydroxide in a larger amount than the dye made it possible for this reaction to be reversible (the resorufin
being transformed back into dihydroresorufin), with slow kinetics (a few minutes). However, this reversibility remains limited by the initial amount of glucose, which tends to oxidize after several hours.
For demonstrative purposes, the volumetric overall mass transfer coefficients (kLa) associated with the train of bubbles
generated were also measured using the dynamic method30 involving oxygen probes (Ox 50, Unisense, Denmark) and also using a high-speed monochromatic camera (Vision Research, Miro-M110, USA) as depicted inFigure 1. These elements are not required when proposing this demonstration to students; they are used here only to validate the technique.
■
DEMONSTRATIONThe procedure consists of filling the vessel with the “red bottle” solution of potassium hydroxide, glucose, and resazurin (at the concentrations reported previously) and by sparging it with nitrogen gas until the pink/red color disappears. Then, nitrogen is replaced by air, at the desiredflow rate, making the pink/red color reappear. The time where the color level remains unchanged can be measured with a stopwatch.
A typical sequence is represented inFigure 2. As the reaction is reversible, if the air is stopped, the solution becomes
colorless again, and the experiment can be run another time (this operation could also be performed with a nitrogenflush). Thus, the student can experiment with many operating conditions in a short time. The authors recommend never-theless operating the experiment less than 3 h after making up the dye solution in order to minimize the glucose oxidation reaction. Sequential runs under different conditions can demonstrate the effect of orifice size on the mass transfer, and the effect of adding a packing system in the column (Figure 3b).
■
HAZARDSSodium hydroxide and its solutions are corrosive. Protective gloves and a laboratory coat should be worn together with safety eyewear. Dissolution of solid sodium hydroxide in water is a highly exothermic reaction, and a large amount of liberated heat can pose a threat to safety through the possibility of splashing. Personal protective equipment such as a dust mask, eyeshields, and gloves should be used for the manipulation of the resazurin dyes.
■
RESULTS AND DISCUSSIONIn order to validate the technique, the images shown inFigure 2 were analyzed by implementing image processing software (Matlab, Mathworks, USA). The averaged gray level of the
Figure 1.Experimental setup.
Figure 2.Evolution of the color in the column as a function of the time. The superficial velocity of gas is 0.6 cm/s, and the orifice diameter is 0.5 mm. The solution is getting more red as a function of the time. These photographs are used to measure the gray light intensity over time.
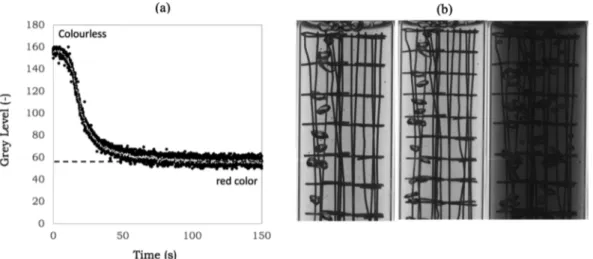
liquid part is plotted versus time inFigure 3a. Initially, no color is observed (the gray level is maximal), because the oxygen concentration in the vessel is null. At t = 0, air begins to be injected into the vessel, and as the reaction starts, the solution becomes pink/red and darker, corresponding to a decrease of the gray level. After more than a minute, the solution has turned pink/red and the gray level becomes constant as all the dye has reacted. It can be deduced that an aeration time of 70 s is required to reach 95% of the gray level value decrease. With this criterion, the precision of the measurement was estimated at±5 s. It can be observed in Figure 3a that the curve is not linear, contrary to what is expected fromeq 5. This could be explained by the fact that the bubbly column does not exactly behave as a perfectly mixed reactor, especially the parts close to the wall, as shown inFigures 2and3b.
The same analysis of the aeration time required to turn the liquid in the column red was performed in the presence of a grid packing system located in the column. As depicted in
Figure 3b, the time obtained was 74 s, which is very close to the value found without packing.
These experiments were reproduced for a second orifice size (i.e., 0.8 mm) at the same gasflow rate, and aeration times of 85 and 100 s were obtained with and without packing. The associated volumetric mass transfer coefficients were calculated witheq 7, and the values were reported inTable 1. InTable 1, the results were also compared with the ones deduced from the classical dynamic method (with oxygen probes). One can observe that a very good agreement (3% of difference) is obtained between the two techniques, thus validating the proposed visualization approach. In addition, it can be noted that, for the small orifice, the packing does not have a notable impact on the mass transfer coefficient (2% of difference) but, for the bigger orifice, the packing increases the mass transfer coefficient significantly (15% of difference). This could be explained by the occurrence of bubble breakup on the packing
grid, leading to a decrease in bubble size and an increase in interfacial area a (the ratio between the total bubble surface and the liquid volume, in m−1). Finally, the increase of the orifice size strongly decreases the mass transfer coefficient (25% of difference), which can be explained by the formation of bigger bubbles. These types of experiments, in different operating conditions, represent an interesting base to discuss with students regarding what parameters control the gas− liquid mass transfer phenomena and how the latter can be improved.
■
DEMONSTRATION WITH STUDENTSThe same set of experiments has been displayed to each member of a volunteer panel of 35 students and professors at the University of Toulouse. These sequences corresponded to the experiment performed in the device at two different orifice sizes, with and without packing. The panel was asked the simple question:“What is the time corresponding to the final change of color of the liquid?” The results obtained were averaged, and the mass transfer coefficient corresponding to the panel as a whole has been added toTable 1. The difference between the three techniques was very small (less than 3%), but it can be observed that the panel always underestimated the mass transfer, and so overestimated the aeration time needed to reach the steady red color. This phenomenon could be explained by the persistence of vision occurring when an observer watched the bubble column for a long time. However, the overestimation was small enough to allow the experiment to be run with only the eyes of the students, without sophisticated and expensive cameras or probes. Finally, this activity is a striking example of how a well-known chemical reaction could help in the quantification of the chemical engineering operation of gas−liquid mass transfer.
Figure 3.(a) Evolution of the averaged gray level of the liquid in the bubble column as a function of time. The superficial velocity of gas is 0.6 cm/ s, and the orifice diameter is 0.5 mm. (b) A typical sequence for the experiments with a grid solid packing system. The superficial velocity of gas is 0.6 cm/s, and the orifice diameter is 0.5 mm
Table 1. Experimental Values of the Mass Transfer Coefficient
Operating Condition Orifice Size Solids Panel kLa (s−1) Image Processing kLa (s−1) Probe Technique kLa (s−1) 0.6 L/min(0.6 cm/s) 0.5 mm No solids 0.0134± 0.003 0.0142± 0.005 0.0135± 0.001
Packing 0.0132± 0.003 0.0136± 0.005 0.0135± 0.001 0.8 mm No solids 0.0975± 0.003 0.0100± 0.005 0.0102± 0.001 Packing 0.0110± 0.003 0.0117± 0.005 0.0122± 0.001
■
CONCLUSIONIn this paper, an experimental setup and specific procedure have been proposed to adapt the well-known “red bottle” reaction so as to visualize and quantify chemical engineering principles related to mass transfer phenomena. The main advantages are the low cost of the materials and the ease of use. Contrary to classical techniques, it requires no oxygen probes, no titration, and no calibration procedure. The experiment is as simple as a colorimetric titration method. The new calculation method proposed, based on the measurement of the aeration time, requires only a stopwatch, and thanks to the reversible properties of the reaction, multiple runs of the visualization can be performed in succession. This new demonstration offers thus a striking, colorful visualization of the effects of various operating parameters (i.e., orifice size, gas flow rate, and packing) on mass transfer, but a number of other conditions can easily be compared, such as the effect of vessel size or of the sparger design. The demonstration can also be combined with a simple acquisition video with the objective to dissociate the effect of the interfacial area, a (linked to the bubble size and gas hold-up), and the mass transfer coefficient, kL. This experiment also constitutes a good introduction to discuss the competition between mass transfer and reaction. A further opportunity, not developed in this work, would be to perform comparisons of the recent adaptations of the blue bottle reaction system to “environment-friendly systems”,6 reducing the hazardous conditions or systems catalyzed.12
■
ASSOCIATED CONTENT*
S Supporting InformationThe Supporting Information is available on the ACS Publications websiteat DOI: 10.1021/acs.jchemed.8b00898.
Extensive discussion and detailed experimental methods (PDF,DOC)
■
AUTHOR INFORMATION Corresponding Author *E-mail:[email protected]. ORCID Nicolas Dietrich:0000-0001-6169-3101 Abderrahmane Kherbeche:0000-0003-4698-145X NotesThe authors declare no competingfinancial interest.
■
REFERENCES(1) Lane, J. H.; Eynon, L. Estimation of Sugar in Urine by Means of Fehling’s Solution with Methylene Blue as Internal Indicator. Analyst 1924, 49 (581), 366−371.
(2) DuBois, M.; Gilles, K. A.; Hamilton, J. K.; Rebers, P. A.; Smith, F. Colorimetric Method for Determination of Sugars and Related Substances. Anal. Chem. 1956, 28 (3), 350−356.
(3) Dutton, F. B. Methylene Blue - Reduction and Oxidation. J. Chem. Educ. 1960, 37 (12), A799.
(4) Campbell, J. A. KineticsEarly and Often. J. Chem. Educ. 1963, 40 (11), 578.
(5) Cook, A. G.; Tolliver, R. M.; Williams, J. E. The Blue Bottle Experiment Revisited: How Blue? How Sweet? J. Chem. Educ. 1994, 71 (2), 160.
(6) Wellman, W. E.; Noble, M. E. Greening the Blue Bottle. J. Chem. Educ. 2003, 80 (5), 537.
(7) Limpanuparb, T.; Hsu, S. The Colorful Chemical Bottle Experiment Kit: From School Laboratory To Public Demonstration. arXiv:1504.02604[physics] 2015.
(8) Rajchakit, U.; Limpanuparb, T. Greening the Traffic Light: Air Oxidation of Vitamin C Catalyzed by Indicators. J. Chem. Educ. 2016, 93 (8), 1486−1489.
(9) Hile, L. The Blue Bottle Revisited. J. Chem. Educ. 1998, 75 (9), 1067.
(10) Limpanuparb, T.; Areekul, C.; Montriwat, P.; Rajchakit, U. Blue Bottle Experiment: Learning Chemistry without Knowing the Chemicals. J. Chem. Educ. 2017, 94 (6), 730−737.
(11) Staiger, F. A.; Peterson, J. P.; Campbell, D. J. Variations on the “Blue-Bottle” Demonstration Using Food Items That Contain FD&C Blue#1. J. Chem. Educ. 2015, 92 (10), 1684−1686.
(12) Rajchakit, U.; Limpanuparb, T. Rapid Blue Bottle Experiment: Autoxidation of Benzoin Catalyzed by Redox Indicators. J. Chem. Educ. 2016, 93 (8), 1490−1494.
(13) Paul, M.; Strassl, F.; Hoffmann, A.; Hoffmann, M.; Schlüter, M.; Herres-Pawlis, S. Reaction Systems for Bubbly Flows. Eur. J. Inorg. Chem. 2018, 2018, 2101−2124.
(14) Rüttinger, S.; Spille, C.; Hoffmann, M.; Schlüter, M. Laser-Induced Fluorescence in Multiphase Systems. ChemBioEng Rev. 2018, 5 (4), 253−269.
(15) Dietrich, N.; Loubière, K.; Jimenez, M.; Hébrard, G.; Gourdon, C. A New Direct Technique for Visualizing and Measuring Gas− Liquid Mass Transfer around Bubbles Moving in a Straight Millimetric Square Channel. Chem. Eng. Sci. 2013, 100, 172−182.
(16) Yang, L.; Dietrich, N.; Loubière, K.; Gourdon, C.; Hébrard, G. Visualization and Characterization of Gas-Liquid Mass Transfer around a Taylor Bubble Right after the Formation Stage in Microreactors. Chem. Eng. Sci. 2016, 143, 364−368.
(17) Yang, L.; Loubière, K.; Dietrich, N.; Le Men, C.; Gourdon, C.; Hébrard, G. Local Investigations on the Gas-Liquid Mass Transfer around Taylor Bubbles Flowing in a Meandering Millimetric Square Channel. Chem. Eng. Sci. 2017, 165, 192−203.
(18) Krieger, W.; Lamsfuß, J.; Zhang, W.; Kockmann, N. Local Mass Transfer Phenomena and Chemical Selectivity of Gas-Liquid Reactions in Capillaries. Chem. Eng. Technol. 2017, 40 (11), 2134− 2143.
(19) Kováts, P.; Pohl, D.; Thévenin, D.; Zähringer, K. Optical Determination of Oxygen Mass Transfer in a Helically-Coiled Pipe Compared to a Straight Horizontal Tube. Chem. Eng. Sci. 2018, 190, 273−285.
(20) Kherbeche, A.; Milnes, J.; Jimenez, M.; Dietrich, N.; Hébrard, G.; Lekhlif, B. Multi-Scale Analysis of the Influence of Physicochem-ical Parameters on the Hydrodynamic and Gas−Liquid Mass Transfer in Gas/Liquid/Solid Reactors. Chem. Eng. Sci. 2013, 100, 515−528.
(21) Xu, F.; Jimenez, M.; Dietrich, N.; Hébrard, G. Fast Determination of Gas-Liquid Diffusion Coefficient by an Innovative Double Approach. Chem. Eng. Sci. 2017, 170, 68−76.
(22) Felis, F.; Dietrich, N.; Billet, A.-M.; Strassl, F.; Herres-Pawlis, S.; Roig, V.; Loubière, K. Experiments on Reactive Mass Transfer around an Oxygen Bubble Rising Freely in a Confined Cell Using Colourimetric Methods. 19th International Symposium on the Application of Laser and Imaging Techniques to Fluid Mechanics; Lisbon, Portugal, July 16−19, 2018.
(23) Dietrich, N.; Hébrard, G. Visualisation of Gas−Liquid Mass Transfer around a Rising Bubble in a Quiescent Liquid Using an Oxygen Sensitive Dye. Heat Mass Transfer 2018, 54 (7), 2163−2171. (24) Xu, F.; Cockx, A.; Hébrard, G.; Dietrich, N. Mass Transfer and Diffusion of a Single Bubble Rising in Polymer Solutions. Ind. Eng. Chem. Res. 2018, 57 (44), 15181−15194.
(25) Piccione, P. M.; Rasheed, A. A.; Quarmby, A.; Dionisi, D. Direct Visualization of Scale-Up Effects on the Mass Transfer Coefficient through the“Blue Bottle” Reaction. J. Chem. Educ. 2017, 94 (6), 726−729.
(26) Roustan, M. Transferts Gaz-Liquide dans les Procédés de Traitement des Eaux et Des Effluents Gazeux; Tec & Doc Lavoisier, 2003.
(27) Yang, L.; Dietrich, N.; Hébrard, G.; Loubière, K.; Gourdon, C. Optical Methods to Investigate the Enhancement Factor of an Oxygen-Sensitive Colorimetric Reaction Using Microreactors. AIChE J. 2017, 63 (6), 2272−2284.
(28) Painmanakul, P.; Hébrard, G. Effect of Different Contaminants on theα-Factor: Local Experimental Method and Modeling. Chem. Eng. Res. Des. 2008, 86 (11), 1207−1215.
(29) Jamnongwong, M.; Loubiere, K.; Dietrich, N.; Hébrard, G. Experimental Study of Oxygen Diffusion Coefficients in Clean Water Containing Salt, Glucose or Surfactant: Consequences on the Liquid-Side Mass Transfer Coefficients. Chem. Eng. J. 2010, 165 (3), 758− 768.
(30) Wongwailikhit, K.; Warunyuwong, P.; Chawaloesphonsiya, N.; Dietrich, N.; Hébrard, G.; Painmanakul, P. Gas Sparger Orifice Sizes and Solid Particle Characteristics in a Bubble ColumnRelative Effect on Hydrodynamics and Mass Transfer. Chem. Eng. Technol. 2018, 41 (3), 461−468.
USING
THE
“RED
BOTTLE”
EXPERIMENT
FOR
THE
VISUALIZATION AND THE FAST CHARACTERIZATION OF
GAS-LIQUID MASS TRANSFER – The Journal of Chemical Education
SUPPORTING INFORMATION TO AID IN THE USE OF THE ACTIVITY
COLORIMETRIC SOLUTION COMPOSITION:
- 117 mg/L of resazurin sodium salt (CAS Number 62758-13-8), - 20 g/L of glucose (CAS Number 50-99-7),
- 20 g/L of sodium hydroxide (CAS Number 1310-73-2). This could be replaced by potassium hydroxide,
-
Water.All experiments were made with Sigma-Aldrich products (www.sigmaaldrich.com).
HAZARDSSodium hydroxide and its solutions are corrosive. Protective gloves and a laboratory coat should be worn, together with protective eyewear. The dissolution of solid sodium hydroxide in water is a highly exothermic reaction (a reaction where a large amount of heat is liberated), posing a threat to safety through the possibility of splashing.
NOTE FOR THE INSTUCTORS:
- The purity of resazurin must be checked before the solution is prepared. The purity is around 80% according to the supplier.
- The device must be made of glass in order to resist to the attack by sodium hydroxide solution.
- Special attention must be paid to the salt dissolution.
- The glucose must be added to the sodium hydroxide solution only when the solution is at ambient temperature. The dye must be added last. We recommend using nitrogen to mix the solution compounds without adding oxygen.
- The colorimetric solution could be made by the students. This would help them understand the principle of the reactions from the blue color of the dye, to pink then colorless.
- The visualization of mass transfer must take place less than 3 hours after the making of the dye solution in order to minimize glucose oxidation. The authors do not recommend keeping the solution for more than a day, as it turns dark yellow 24 hours after the mixing of the compounds.
- To reduce the cost or the experimental time, the concentration of the dye can be decreased, but the authors do not recommend decreasing the dye concentration to a value resulting in an experimentation time shorter than 30 seconds. The concentration of the resazurin can be increased in order to extend the experiment time if the transfer time of the equipment is too short. Some other gas-liquid contactors can be used in order to change the coloration time (see below).
-
The concentration of glucose and sodium hydroxide can also be changed in order to increase or decrease the back reaction (red color to pink) and allow a larger number of experiments to be done in series. Nevertheless, the authors do not recommend using concentrations higher than 40 g/l of glucose as the the viscosity and fluid properties need to be kept close to those of water to maintain the validity of the equations.IMPACT OF THE GAS-LIQUID CONTACTOR ON THE MASS TRANSFER COEFFICIENT
The activity described in this paper is performed with a simple bubble column. Other gas-liquid contactors could be used in order to illustrate other chemical engineering unit operations or to change the coloration time (increasing kL.a allows indeed a strong
reduction of the dye concentration with an acceptable experiment time). These contactors are used to realize the mass and heat transfer between a gas phase and a liquid phase and can be used in separation processes (e.g. distillation, absorption) or as gas–liquid reactors or to achieve both purposes within the same device (e.g. reactive distillation) such as : falling-film column, packed column, bubble column, spray tower or gas–liquid agitated vessel.
Some important factors to take into account to choose the typology of gas–liquid contactor more suitable for a particular application are the liquid hold-up and the surface area of the gas–liquid interface. In particular heat and mass transfer rates are increased with equipment possessing high gas–liquid interface surface areas. Liquid hold-up is also an important factor for the economy of the process, because for low values of liquid hold-up a bigger equipment is needed to have the same heat and mass transfer rates. For this reason, gas–liquid contactors with low liquid-hold-up (e.g. falling-film column) are in general not used at industrial scale1,2.
Contactor Dispersed
phase area (mInterfacial 2/m3)
Dispersed phase
hold-up (-) coefficient kMass transfer L (m/s)
Bubble column1
gas 50-400 1-30 1-5 10-4
Stirred tank1 gas 50-300 1-20 2-5 10-4
Fixed bed1 gas 50-300 1-10 1-4 10-4
Static mixer1 gas 100-1000 1-20 5-20 10-4
Packed column1 liquid 50-300 4-15 0.5-4 10-4 Spray column1 liquid 10-100 1-10 1-4 10-4 Venturi1 liquid 20-300 1-10 3-7 10-4 Milli and micro reactor3 gas and liquid 1000-5000 1-30 0.5-2 10-3 Table 1. Main characteristic of mass transfer properties of gas-liquid contactors
More references for students and instructors:
(1) Roustan, M. Transferts gaz-liquide dans les procédés de traitement des eaux et des effluents gazeux http://cat.inist.fr/?aModele=afficheN&cpsidt=15123114 (accessed Jan 22, 2014).
(2) Perry, R.; Green, D. Perry’s Chemical Engineers’ Handbook, Eighth Edition; McGraw-Hill Education, 2008.
(3) Yang, L.; Dietrich, N.; Loubière, K.; Gourdon, C.; Hébrard, G. Visualization And Characterization Of Gas-Liquid Mass Transfer Around A Taylor Bubble Right After The Formation Stage In Microreactors. Chemical Engineering Science 2016. https://doi.org/10.1016/j.ces.2016.01.013.
IMPACT OF THE ORRIFICE SIZE ON THE BUBBLE DIAMETER
The first studies on bubble formation were published by Tate (1864) and Bashforth & Adams (1883). A review on the subject can be given to the student for illustrating the effect of hydrodynamic with:
Kulkarni, A. A.; Joshi, J. B. Bubble Formation and Bubble Rise Velocity in Gas−Liquid Systems: A Review. Ind. Eng. Chem. Res. 2005, 44 (16), 5873–5931. https://doi.org/10.1021/ie049131p.
Some visualization of bubble formation can be found in the paper of:
Dietrich, N.; Mayoufi, N.; Poncin, S.; Li, H.-Z. Experimental Investigation of Bubble and Drop Formation at Submerged Orifices. Chem. Pap. 2013, 67 (3), 313–325; DOI:
10.2478/s11696-012-0277-5
The equalization of the pushing force and the capillary force at the orifice leads to the well-known relation: (1)
0
6
3
0
Eö
d
b
d
With Eö0 the Eötvös number at the orifice (=
gd
2
), also called the Bond number(Bo), a dimensionless number measuring the importance of gravitational forces compared to surface tension forces and used to characterize the shape of bubbles or drops moving in a surrounding fluid.
This expression totally neglects the pinch effect at the neck of the bubble and the expression of the bubble diameter db provided by the equation (1) is considered as a
maximum that can lead to an overvaluation of the volume of the bubble. Nevertheless, it is a simple tool to illustrate and validate the effect of the bubble size with the orifice size. For more precise measurements, the most complex model, presented in Kulkarni & Joshi (2005) can be used:
1 3 0,36 0,51 0 0 1,08 0,39 0 0 0
5,0
9, 261
2,147
bd
Fr
Fr
d
Bo
Ga
The use of a simple camera could also make possible the measurement of the bubble size and then to dissociate the effect on the interfacial area a and the mass transfer coefficient kL from the measure kL.a coefficient.