O
pen
A
rchive
T
OULOUSE
A
rchive
O
uverte (
OATAO
)
OATAO is an open access repository that collects the work of Toulouse researchers and makes it freely available over the web where possible.
This is an author-deposited version published in : http://oatao.univ-toulouse.fr/ Eprints ID : 16519
To link to this article : DOI : 10.1002/apj.1738
URL : http://dx.doi.org/10.1002/apj.1738
To cite this version : Mehdi, Shozab and Billet, Anne-Marie and Chughtai, Imran and Inayat, Mansoor Overall gas-liquid mass
transfer from Taylor bubbles flowing upwards in a circular
capillary. (2013) Asia-Pacific Journal of Chemical Engineering, vol.
8 (n° 6). pp. 931-939. ISSN 1932-2135
Any correspondence concerning this service should be sent to the repository administrator: [email protected]
Overall gas–liquid mass transfer from Taylor bubbles
flowing upwards in a circular capillary
Shozab Mehdi,1,2* Anne-Marie Billet,2Imran R. Chughtai1and Mansoor H. Inayat1
1Department of Chemical Engineering, Pakistan Institute of Engineering and Applied Science, 45650 Islamabad, Pakistan
2Laboratoire de Génie Chimique, Université de Toulouse (INPT, UPS) and CNRS, 4 allée Emile Monso, BP74233, 31432 Toulouse Cedex 4, France
ABSTRACT: Overall liquid side volumetric mass transfer coefficient kLa was determined experimentally for cocurrent
Taylor flow moving upwards in a glass tube of an internal diameter of 3 mm. Experiments were performed for physical absorption of oxygen in 20% aqueous solution of ethanol. Shadowgraph technique was deployed for precise measurements of bubble lengths and velocities. Experimental values of volumetric mass transfer coefficient kLa were evaluated by use of
oxygen sensor and contributions of two possible mass transfer mechanisms: bubble to liquid slug and bubble to liquid film were discussed. Effects of various hydrodynamic parameters such as superficial velocity, length of bubble and slug, and so forth on kLa have also been presented. A correlation has been proposed for the estimation of kLa for a wide range of bubble to
slug lengths ratio and superficial velocities of gas and liquids. © 2013 Curtin University of Technology and John Wiley & Sons, Ltd.
KEYWORDS: mass transfer; Taylor bubble; monolith reactor; liquid film; shadowgraphy
INTRODUCTION
Since the last few decades, growing interest is observed in monolith reactors that appeared to be the most promising kind of multiphase chemical reactor for gas– liquid reactions among the scientific community.[1] These reactors are made up of a large number of parallel channels belonging to a single structure or block called monolith.[2]For a gas–liquid reaction, the inner sides of the channels may be coated with catalyst if necessary, whereas the gas and liquid phases flow through these channels in counter or cocurrent manner, offering a large contact area between them. Monolith reactors are considered to have an edge over classical catalytic multiphase chemical reactors such as stirred slurry reactor,[3] slurry bubble column,[4] and trickle bed reactor,[5] provided that the gas and liquid phases can be uniformly distributed among the various channels of monolith.[6]
Among the two-phase gas–liquid types of flow in the previously mentioned small channels, the most stable flow regime is the train of elongated bubbles separated by liquid slugs (Fig. 1), often called ‘Taylor flow’. This flow regime is described by a
plug flow behavior in liquid slugs, gas bubble surrounded by thin liquid films, markedly low pressure drop and high interphase mass transfer rates. The flow in the thin liquid film is dominated by viscous effects and usually laminar,[1] whereas the liquid slugs in Taylor flow have characteristic circulating flow patterns, which enhance mixing as originally proposed by Taylor[7] (Fig. 2). Later, these flow patterns have also been verified by using particle image velocimetry[8] and computational fluid dynamics.[9]
In Taylor flow, for the case of physical absorption, the gas is transferred to the liquid phase in two different ways: (1) from the front and rear ends of the gas bubble to the liquid slug, (2) from the cylindrical surface of the gas bubble to the thin liquid film as shown in Fig. 2. It is often believed that mass transfer efficiency is mainly due to bubble confinement and more precisely due to the efficient mass transfer of gas at the bubble surface along the thin liquid film between the bubbles and the wall;[10,11] this is particularly true when the reaction is catalytic, as the local mass flux is accelerated by the consumption of dissolved gas at the catalytic wall. The thickness of liquid film, h, can be evaluated through several relations (see for instance the analyses of Bretherton,[12] Irandoust, Ertlé, and Andersson,[13] or Aussillous and Quéré[14]) on the basis of the capillary number Ca = mUB/s, where
*Correspondence to: Shozab Mehdi, Department of Chemical Engineering, Pakistan Institute of Engineering and Applied Science, 45650 Islamabad, Pakistan. E-mail: [email protected]
UB is the bubble velocity, m is the liquid viscosity, and s is the surface tension. These relations depend on the shape of the tube section (circular or square); however, the film thickness is always found to increase with capillary number.
After Fairbrothers and Stubbs[15]who first gave the idea of thin liquid film between the gas bubble and the walls of the channel, Higbie[16] presented a penetration theory to determine the resistance to mass transfer across the phase boundary. The analysis of the penetration theory was based upon a single carbon dioxide gas bubble rising in a vertical tube of 3 mm filled with water and developed a relation for liquid phase mass transfer coefficient, kLas the following:
kL ¼ ffiffiffiffiffiffi D pte r (1) where D is the diffusivity and teis the time of exposure for a part of liquid to gas bubble, which is given by the ratio of bubble length to bubble velocity (LB/UB).
The penetration theory can be used to account for gas–liquid mass transfer near the wall, which is followed by mass transport due to diffusion through a thin liquid film. For the case of the Taylor flow, in addition to mass transfer towards liquid film, mass transfer from the ends of the bubble into liquid slug also occurs. Because of the presence of liquid circulating flow patterns near the nose of each Taylor bubble, the mass transfer phenomenon through bubble caps is then convective rather than diffusive. Therefore, the penetration theory will no longer remain applicable for the bubble caps region. Several studies regarding gas–liquid mass transfer from Taylor bubbles rising in single circular capillary can be found in literatures.[9,13,17–23] Models for the overall gas– liquid mass transfer in the whole tube have been proposed mainly on the basis of a dominant contribution among the two different mechanisms for mass transfer (from films or from ends of bubble to slugs). For the purpose of comparison, we report here after two representative studies, one considering the major contribution from bubble hemispherical ends[17]
, whereas other relying solely on liquid film.[20]
Bercic and Pintar[17]performed experiments on 1.5, 2.5, and 3.1-mm diameter capillaries by using methane-water system. They used long bubbles up to 0.124 m, which led to large exposure time and consequently to low concentration gradient in the liquid film. Thus, the major mass transfer mechanism in their experiments is the convective mixing inside liquid slugs. The authors gave the following empirical correlation for the estimation of the overall mass transfer coefficient in the form of kLa:
kLa¼ 0:111 UGþ UL ð Þ1:19 1 % eL ð ÞLUC ½ '0:57 (2)
where a is the interfacial area expressed herein square meters per cubic meter of liquid phase, UG and UL are the gas and liquid superficial velocities, respectively, eL is the void fraction of liquid (eL= UL/ (UL+ UG)) and LUC is the length of the unit cell (one bubble + one slug). The quantity [(1 % eL)LUC] in the previous equation is practically equals to the length of the liquid slug LS. As the contribution of films to mass transfer is negligible in the work of Bercic and Pintar, bubble length does not appear in their correlation (Eqn 2).
Vandu et al.[20] performed experiments with the nonreactive air–water system in 1–3-mm diameter
Figure 2. Schematic representation of Taylor flow. Figure 1.Pictures of Taylor flow regimes observed during the present experimentations.
channels of both circular and square sections. They neglected the contribution from the bubble’s ends for the specific range of experimentation satisfying the condition ffiffiffiffiffiffiffiffiffiffiffiffiffiffiffiffiffiffiffiffiffiffiffiffiffiffiffiffiffi
UGþ UL
ð Þ=LS
p
Þ > 3s%0:5; this criterion compares slug length with slug velocity, and (UG+ UL)/LS schematically represents the inverse of a characteristic time for the transit of slugs and thus for the mixing phenomenon inside the slugs. Vandu and coworkers used long slugs up to 0.0324 m, which experience nonnegligible viscous stress at the tube wall; as a consequence, only weak liquid recirculation may develop within slugs and this prohibits the convective motion within slugs and thus prohibits any significant contribution from bubble ends interface. Therefore, in their correlation, contribution from the bubble’s ends is completely ignored (Eqn 3). Thus, the mass transfer in their experiments is due to the diffusion dominating mechanism through the thin liquid film.
Vandu et al. presented the following model for the coefficient kLa because of film contribution based on Higbie’s penetration theory[15]:
kLa¼ 4:5 d ffiffiffiffiffiffiffiffiffiffi DUG LUC r (3)
where d is the diameter of channel and a is the interfacial area, expressed herein square meter per cubic meter of gas plus liquid phase. To summarize the Vandu et al. analysis, contrasted mass transfer mechanisms are expected depending on slug transit time ts and film exposure time te. In an explicit plot, these authors show that Bercic and Pintar’s work corresponds to te> 0.1s and to ts< 0.11s, leading to a dominant contribution of bubble ends; on the contrary, Vandu et al. used conditions where elevated ts and small te are observed, leading to a dominant effect of diffusion through films.
In the present study, we used a wide range of bubbles to slug lengths ratio (0.5 % 17); we observed short exposure times (te< 0.1), and the criterion
ffiffiffiffiffiffiffiffiffiffiffiffiffiffiffiffiffiffiffiffiffiffiffiffiffiffiffiffiffi UGþ UL
ð Þ=LS
p
Þ is greater than 6, leading to event smaller slug characteristic times as compared with Vandu et al.’s work. As a consequence, film contribution is likely to be important. However, we observed very small cell lengths (6.10%3
–15.10%3m) as compared with data found in works of Vandu et al.; the mixing efficiency within slugs is then more effective, and slug contribution to mass transfer coefficient may not be negligible. Therefore in this study, attention has been given to both mass transfer mechanisms; the overall mass transfer coefficient is expected to depend on film exposure time, on mixing efficiency within slugs, and on average lengths of bubbles and slugs.
Based upon the previous discussion, we propose the mass transfer coefficient of the following form:
kLa¼ f ffiffiffiffiffiffi D pte r ; ReS; Φ $ % (4) where ReS= rLSUB/m and Φ = LB/LS. ReSis a Reynolds number referred to slug characteristics and liquid phase density and viscosity. Also note that the velocity of liquid slug is almost equal to the velocity of bubble, UB.
Experiments dedicated to the identification of a relevant correlation in the form of (4) have been performed. The experimental setup and the measuring procedure are described hereafter, and the results are reported.
EXPERIMENTAL SETUP
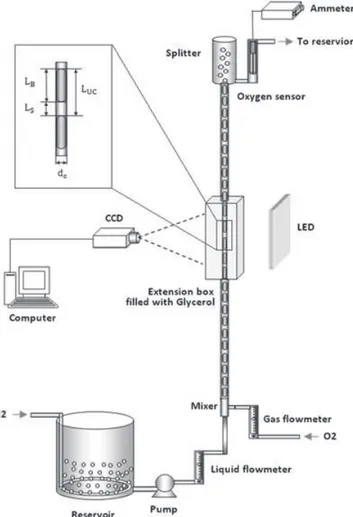
To investigate the hydrodynamic characteristics of the two-phase flow and of the overall mass transfer occurring between the phases, an experimental setup was developed as shown in Fig. 3. It consists of a 3-mm internal diameter and a 1.25-m long tube made
of Pyrex glass. The tube is supported with an aluminum frame. To ensure Taylor flow in the tube, gas and liquid phases are supplied separately and are mixed by means of a T-shaped mixer installed prior to the tube. Special care was taken while manufacturing the mixer because the diameter of gas inlet heavily affects the type of flow regime developed inside the channel.[24] We observed that, when the diameter of the gas inlet tube is smaller than the diameter of the main tube, only bubbly flow was obtained, whereas the larger diameter of inlet tube gave unstable flow. Therefore, the inlet diameter of gas was kept similar as the diameter of channel to get stable Taylor flow. The fluids used for mass transfer experimentation was pure oxygen for the gas phase and an aqueous solution containing 80 vol. % of water and 20 vol. % of ethanol for the liquid phase. A centrifugal pump is used to supply the liquid from a reservoir to the tube. To get the maximum concentration gradient across the phase boundary, the reservoir was equipped with nitrogen bubbling system. Nitrogen gas acts as a stripper for oxygen gas and makes liquid fully deoxygenated before it enters the capillary tube. Flowmeters are installed to measure and control the flow rates of both the gas and the liquid. Flow rates used were in the range of 0–0.25 L/min. As a consequence in this work, bubble Reynolds number Re varies in the range [120; 700] and capillary number Ca varies in the range [0.004; 0.02].
The shadowgraphy technique was deployed for accurate measurements of bubble lengths and bubble velocities of different flow regimes. An LED panel was mounted behind the tube that produced a sharp shadow of the flow inside the tube, and to record these shadows, a high-speed CCD camera (Photron FASTCAM, Photron USA, Inc.) was installed in front of the tube. The center of the investigated zone was located 1 m above the T-mixer. The curvature of the tube produces a lens effect; the correction is achieved by placing the investigated section of tube inside an extension glass-box filled with glycerol. The refractive indices of glycerol and Pyrex glass are very close to each other, and it makes the glass tube almost invisible in the extension box, giving the true images of the flow regimes. The effect can be seen in the resulting images as shown in Fig. 1. The recording frequency of the camera was varied from 500–1500 frames/s to make sure that a bubble can be followed from bottom to top of the interrogation window to measure velocity. These shadowgraph pictures are then processed by means of the image processing tool of
MATLABW
software to determine the length bubbles. At the top of the tube, a phase-splitter allows oxygen bubbles to separate from the liquid phase where the oxygen gas is diffused into the atmosphere while the liquid is supplied back to the reservoir after passing
through an oxygen sensor (Ox25 probe, Unisense, Århus, Denmark). The concentration of dissolved oxygen that has been transferred from oxygen bubbles into liquid slugs is thus measured using an oxygen sensor by using a specific preliminary calibration.
MEASURING PROCEDURE
Bubble length and bubble velocity
Shadowgraph records of different Taylor flow regimes are analyzed to measure bubble velocities and bubble lengths. Twenty five different flow rate conditions have been investigated
For bubble length evaluation, a routine has been developed with MATLABW
software. This routine selects an image from a series, crops a cell from it and then extracts the bubble from the rest of the flow field. As dimensions are measured on pictures with a precision of (1 pixel, the error on bubble length measurement is found to be less than 3.7%. The following operations are involved during the processing of such images (Fig. 4):
(1). Subtraction of background: electronic and optical noises are generated by the camera, some unwanted marks may be present on the LED panel and on the Pyrex tube wall. It is then necessary to remove these from the processed image [raw image of bubble shown on Fig. 4(b)]. This is performed by recording images of the background ([tube filled with liquid, no bubbles, Fig. 4(a)], and subtracting it from the image to be processed [Fig. 4(c)].
(2). Binarization: the images recorded by the CCD camera are gray scale images and each pixel of these images shows a given level of gray scale (white = 0, black = 255). The pixels located near the bubble boundary are observed to have a lower gray level than the pixels located inside or outside the bubble boundary. Thus, by applying the
Figure 4. Image processing of shadowgraphs: (a) background, (b) shadowgraph of bubble, (c) subtraction of background, (d) binarization of image, and (e) correction.
appropriate threshold to the gray scale image, a
MATLABW
routine converts it into a binary image [Fig. 4(d)], giving the white color to the bubble and the black color to the rest of field.
(3). Image correction: some other operations are carried out to optimize the processed images, for example, filling the small black spots that may remain inside the bubble boundary and smoothing the surface. The resulting image is shown on Fig. 4(e).
(4). Bubble size identification: an algorithm is applied that finds white pixels in each column of cropped image and gives the maximum dimension found inside the bubble; this is taken as bubble length. For measuring bubble velocity, the high-speed video mode of the recorded images is used. Bubble velocities are determined by measuring the time a bubble takes to travel through the test section. Any point on the bubble boundary can be taken as a reference. In the present study, we take the center point of upper bubble’s cap. The exact length of interrogation window is determined by comparing it with the inner diameter of the glass tube. Velocity is measured for five to seven bubbles within the same hydrodynamic regime and averaged. The experimental error on velocity measurement is found to be less than 5% through reproducibility tests.
Calibration of oxygen probe
For calibration, the aqueous solution in the reservoir is saturated with a known concentration of oxygen. The liquid is then passed through the capillary; the outlet is equipped by the oxygen probe. This is performed for 0, 15, 21, and 40 vol. % of oxygen in gas, allowing four points for the calibration curves. This curve is found perfectly linear. The gas volumetric concentrations are then related to the dissolved O2 equilibrium concentrations (mg/L) in liquid phase by using Henry’s law. For water-ethanol (20 vol.% solution), Henry coefficient ‘H’ was found to be 635 L atm mol%1at 25)C[25]The diffusivity coefficient was
found to be 9 * 10% 10m2/s from Winkelmann[26] for our solution.
Mass transfer measurement
To determine the gas–liquid mass transfer coefficient, a Langrangian mass balance approach over a control volume consisting of a typical liquid cell is derived. The following assumptions are made to simplify the model:
(1). Each liquid slug is considered to be perfectly mixed (Fig. 5), and, for each bubble, the whole volume of liquid film is considered to mix rapidly
into the following slug. We define thus a ‘liquid cell’ as the sum of a slug and the connected liquid film of the neighboring bubble. We call C the equivalent oxygen concentration in such a cell. (2). The equilibrium concentration for pure oxygen in
the liquid phase is constant along the tube. The oxygen concentration in gas phase is invariant due to small the pressure drop.
(3). The contribution to mass transfer by the splitter, where bubbles disengage from liquid phase, is neglected.
Under these conditions, the oxygen balance applied to a liquid cell can be written in the following form:
molar flux of oxygen dissolved to liquid cell
½ '
¼ change in concentration of oxygen in liquid cell½ ' This leads to the following differential equation:
kLa Cð +% CÞ + eLV ¼
dC
dt
+ eLV (5)
where C* is the molar concentration of dissolved oxygen at equilibrium that exists near the interface, and the interfacial area a is the contact surface area between gas and liquid per volume of liquid VL. kLa is the representative mass transfer coefficient for a liquid cell, and thus also that of the whole liquid phase in the tube. The resulting equation is then solved by applying boundary condition: kLa Z T 0 dt ¼ Z CL 0 dC C+% C ð Þ (6) kLa¼ 1 Tln C+ C+% C L ' ( (7) where T is the total time that the cell takes to travel along the whole tube, and CLis the concentration in dissolved oxygen within the liquid cell when it reaches the end of tube (as determined by the pre-calibrated oxygen probe at the tube outlet). Putting T = L/UB in the previous equation, we get the following:
kLa¼ UB L ln C+ C+% C L ' ( (8)
RESULTS AND DISCUSSIONS
First observations
It was checked on raw images that the thickness of liquid films is less than 1 pixel; so the thickness cannot be precisely measured in this work. Note that, on these images, 1 pixel corresponds to 56.6 mm. This magnitude is consistent with the relation proposed by Bretherton;[12]by using this relation, the film thickness is expected to range between 15 and 46 mm (depending on gas flow rate).
(2) Mass transfer coefficient: order of magnitude
Giving a first look to mass transfer results, the overall mass transfer coefficient kLa is observed to vary between 0.1–1.3 s%1. These values are compared with kLa obtained in the absorption bubble column with air–water system by Chaumat et al.[27] It is important to note that kLa from both works have been made consistent with a superficial area per volume of liquid phase. In the present work, kLavalues are found to be five times higher than the values measured in the absorption bubble column; for instance, for a gas superficial velocity of UG= 0.14 m/s, kLa is measured to vary between 0.05 and 0.08 s% 1 in the bubble column and reaches 0.4 s%1in our capillary tube. The different fluids used (leading to a factor of 2 between diffusion coefficients) are not sufficient to explain these different magnitudes. Mass transfer in Taylor-confined flow is then found efficient with regard to gas–liquid mass transfer in bubble column.
Effect of superficial velocities on kLa
The overall mass transfer coefficient multiplied by interfacial area kLa is plotted in Fig. 6 vs gas superficial velocity UG with superficial liquid velocity ULas the parameter. It is observed that kLa increases with UG. It can also be seen from the figure that kLa hardly depends on liquid superficial velocity for low values of UGwhile at high values of gas superficial velocity, kLashows some dependence on UL. It can be deduced that at low gas superficial velocities, the values of kLa that do not depend on liquid superficial velocity may be because of a diffusion-controlled mechanism, which
is confined inside liquid film. However at high gas superficial velocities, kLa increases because of increased mixing in the liquid slug.
Effect of bubble and slug lengths on kLa
To analyze the contributions from liquid film and mixing in the liquid slug to the overall mass transfer coefficient, kLais plotted vs bubble length LB and slug length LS with liquid superficial velocity UL as a parameter (Figs 7 and 8). It can be seen from these figures that kLa increases rapidly with increase in LB and decreases with increase in LS for a given value of UL.
Decrease in kLa with increase in LS can be due to a better mixing in smaller slugs because of wall shear, whereas the reason for increasing kLa with increasing LBcan be the contribution from a larger liquid film area in long bubbles. To summarize, enhanced mass transfer coefficient is achieved for Taylor flow having long bubbles with small slugs.
Figure 5. Schematic representation for experimental kLdetermination.
Effect of film exposure time te
To analyze the effect of diffusion-related mechanism in the liquid film as proposed by Higbie’s theory,[16] the mass transfer coefficient kLa is plotted against the reciprocal of film exposure time, te% 1by using superficial liquid velocity ULas a parameter in Fig. 9. Here, tehas been estimated by (LB% d)/UB; their values are found to vary from 0.01–0.1 s. It can be seen from figure that, for a given value of UL, kLa increases rapidly as te% 1 increases. The exposure time, te, increases the resistance to mass transfer because of decreased concentration gradient at the gas–liquid interface. This experimental observation is then consistent with Higbie’s theory.[16]
Mass transfer model
A comparative plot of experimentally determined mass transfer coefficient and predicted values obtained by correlations given by Bercic and Pintar [Eqn (2)] and Vandu et al. [Eqn (3)] is made in Fig. 10. To express mass transfer per volume of liquid phase, kLa values obtained from the Vandu et al. model have been divided by liquid hold up (eL= LS/LUC) before comparison. It can be seen that both models do not give reasonable agreement with the kLadata that have been experimentally determined here. This is not surprising because, as explained in the Introduction, experimental conditions used in this work (short cells) are different
Figure 7.Plot of kLa versus bubble length LB.
Figure 8.Plot of kLa versus slug length LS.
Figure 9. Plot of kLa vs inverse of exposure time: te= (LB% d)/ UB.
Figure 10.Comparative plot of current experimental kLa with models derived by Bercic and Pintar[17] and Vandu et al.[20]
from the two referred works and give similar significance to both mass transfer mechanisms.
What is more, as the bubbles and slugs obtained in this work are short, the assumptions of hemispherical ends for bubbles and of cylindrical shape for film area are no more relevant (see for example the train of bubbles presented on left of Fig. 1). For that reason as proposed in Eqn (4) the following mathematical form for kLa has been used to represent the experimental data obtained in the present work:
kLa¼ c ffiffiffiffiffiffi D pte r RemSΦn (9)
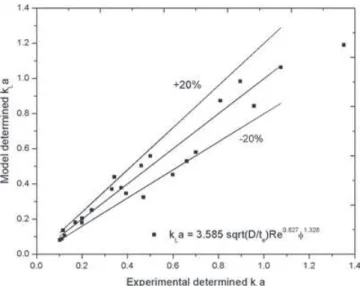
The values of empirical constants c, m, and n in Eqn (10) are found by using regression analysis on the experimental data, which gives the following final form for volumetric gas–liquid mass transfer coefficient kLa:
kLa¼ c ffiffiffiffi D te r ReS0:827Φ1:328 (10)
where c = 3.585 m% 1. Figure 11 shows that the experimental kLa values are well predicted by the previous equation with a maximum deviation of (20%.
CONCLUSIONS
Overall volumetric gas–liquid mass transfer kLa is studied for cocurrent Taylor flow moving upward in a 3-mm glass tube. Experiments are performed for physical absorption of oxygen in 20% aqueous solution of ethanol. Effect of different parameters on kLa has been observed. It is concluded that mass transfer occurs as a result of two distinctive mechanisms. One is controlled by diffusion through thin liquid film and can be modeled by Higbie’s penetration theory. Second is due to convective mixing inside liquid slug and is given by Reynolds number and the ratio of lengths of bubble to slug. For the mass transfer through liquid film, the resistance to mass transfer increases due to the decreased concentration gradient as a result of large values of exposure time. For the mass transfer due to convective mixing inside liquid slug, enhanced mass transfer coefficient is achieved as a result of high superficial velocities and smaller slugs. Experimental kLa are compared with two distinctive models given by Bercic and Pintar[17]and Vandu et al.[20]; these two models are based on specific experiments (long bubbles and long slugs, respectively), and correspond to contrasted situation: dominance of caps contribution and dominance of film contribution (respectively) to the overall kLa. In the present work and in Vandu, Liu,
and Krishna,[20]the characteristic time scales for slug mixing and for film exposure stand in similar ranges. However experimental kLa show deviation from the two models; this deviation is due to the short bubbles and slugs used in the present work, leading to similar magnitudes of film and cap contributions, and also to the failure of shape assumptions currently made to model these two contributions. For such a situation, an empirical correlation (Eqn 10) is proposed that incorporates both mechanisms for mass transfer for a wide range of bubble to slug lengths ratios and superficial velocities of gas and liquid.
Acknowledgements
The French embassy is acknowledged for providing scholarships for bilateral research between the two labs; our acknowledgements are also dedicated to the French FERMaT research federation for providing equipments for the shadowgraph experiments.
REFERENCES
[1] M.T. Kreutzer, F. Kapteijn, J.A. Moulijn, J.J. Heiszwolf. Chem. Eng. Sci., 2005; 60, 5895–5916.
[2] J.L. Williams. Catal. Today, 2001; 69, 3–9.
[3] A. Cybulski, A. Stankiewicz, R.K. Edvinsson Albers, J.A. Moulijn. Chem. Eng. Sci., 1999; 54, 2351–2358.
[4] H. Marwan, J.M. Winterbottom. Catal. Today, 2004; 97, 325–330.
[5] R.K. Edvinsson, A. Cybulski. Chem. Eng. Sci., 1994; 49, 5653–5666.
[6] S. Roy, M. Al-Dahhan. Catal. Today, 2005; 105, 396–400. [7] G.I. Taylor. J. Fluid Mech., 1961; 10, 161–165.
[8] T.C. Thulasidas, M.A. Abraham, R.L. Cerro. Chem. Eng. Sci., 1997; 52, 2947–2962.
[9] J.M. van Baten, R. Krishna. Chem. Eng. Sci., 2004; 59, 2535–2545.
Figure 11.Comparative plot of current experimental kLa with the present model.
[10] G. Ber!ci!c. Catal. Today, 2001; 69, 147–152.
[11] S. Irandoust, B. Andersson, E. Bengtsson, M. Siverstroem. Ind. Eng. Chem. Res., 1989; 28, 1489–1493.
[12] F.P. Bretherton. J. Fluid Mech., 1961; 10, 166–188. [13] S. Irandoust, S. Ertlé, B. Andersson. Can. J. Chem. Eng.,
1992; 70, 115–119.
[14] P. Aussillous, D. Quéré. Phys. Fluids, 2000; 12, 2367–2371. [15] F. Fairbrother, A.E. Stubbs. J. Chem. Soc., 1935; 0, 527–529. [16] R. Higbie. Trans. Am. Inst. Chem. Eng., 1935; 31, 365. [17] G. Ber!ci!c, A. Pintar. Chem. Eng. Sci., 1997; 52, 3709–3719. [18] J.J. Heiszwolf, M.T. Kreutzer, M.G. van den Eijnden, F.
Kapteijn, J.A. Moulijn. Catal. Today, 2001; 69, 51–55. [19] M.T. Kreutzer, P. Du, J.J. Heiszwolf, F. Kapteijn, J.A.
Moulijn. Chem. Eng. Sci., 2001; 56, 6015–6023.
[20] C.O. Vandu, H. Liu, R. Krishna. Chem. Eng. Sci., 2005; 60, 6430–6437.
[21] S. Haase, T. Bauer, R. Langsch, R. Lange. Mass transfer in small channels with slug-flow under reacting conditions. Proceeding of WCCE8, Montreal, 2009.
[22] J. Yue, L. Luo, Y. Gonthier, G. Chen, Q. Yuan. Chem. Eng. Sci., 2009; 64, 3697–3708.
[23] D. Liu, S. Wang. Ind. Eng. Chem. Res., 2010; 50, 2323–2330. [24] W. Salman, A. Gavriilidis, P. Angeli. Chem. Eng. Sci., 2006;
61, 6653–6666.
[25] T. Schnabel, J. Vrabec, H. Hasse. Fluid Phase Equilibr., 2005; 233, 134–143.
[26] J. Winkelmann. In Gases in Gases, Liquids and their Mixtures, Vol. 15A (Ed.: M.D. Lechner), Springer, Berlin Heidelberg, 2007; pp. 2323–2323.
[27] H. Chaumat, A.M. Billet Duquenne, F. Augier, C. Mathieu, H. Delmas. Chem. Eng. Sci., 2005; 60, 5930–5936.


![Figure 10. Comparative plot of current experimental k L a with models derived by Bercic and Pintar [17] and Vandu et al](https://thumb-eu.123doks.com/thumbv2/123doknet/3577628.104866/8.892.462.824.741.1039/figure-comparative-current-experimental-models-derived-bercic-pintar.webp)