HAL Id: hal-02147282
https://hal.archives-ouvertes.fr/hal-02147282
Submitted on 4 Jun 2019
HAL is a multi-disciplinary open access
archive for the deposit and dissemination of sci-entific research documents, whether they are pub-lished or not. The documents may come from teaching and research institutions in France or abroad, or from public or private research centers.
L’archive ouverte pluridisciplinaire HAL, est destinée au dépôt et à la diffusion de documents scientifiques de niveau recherche, publiés ou non, émanant des établissements d’enseignement et de recherche français ou étrangers, des laboratoires publics ou privés.
and the fast characterization of gas-liquid mass transfer
Nicolas Dietrich, Kritchart Wongwailikhit, Mei Mei, Feishi Xu, Francisco
Felis, Abderrahmane Kherbeche, Gilles Hébrard, Karine Loubiere
To cite this version:
Nicolas Dietrich, Kritchart Wongwailikhit, Mei Mei, Feishi Xu, Francisco Felis, et al.. Using the ”red bottle” experiment for the visualization and the fast characterization of gas-liquid mass transfer. Journal of Chemical Education, American Chemical Society, Division of Chemical Education, 2019, 96 (5), pp.979-984. �10.1021/acs.jchemed.8b00898�. �hal-02147282�
Using the “red bottle” experiment for the visualization and the fast
characterization of gas-liquid mass transfer
Nicolas DIETRICH1, Kritchart WONGWAILIKHIT1,2, Mei MEI1,4, Feishi XU1, Francisco FELIS4, Abderrahmane KHERBECHE3, Gilles HÉBRARD1 & Karine LOUBIÈRE4
5
(1) Laboratoire d’Ingénierie des Systèmes Biologiques et des Procédés LISBP, CNRS, INRA, INSA, Université de Toulouse, Toulouse, France
(2) Department of Environmental Engineering, Faculty of Engineering, Chulalongkorn University, Bangkok, 10330, Thailand
10
(3) International Center for Applied Mechanics, State Key Laboratory for Strength and Vibration of Mechanical Structures, Xi'an Jiaotong University, Xi'an 710049, People's Republic of China (4) Laboratoire de Génie Chimique LGC, Université de Toulouse, CNRS, INPT, UPS, Toulouse, France
ABSTRACT
15
This paper presents a demonstration on the visualization and the characterization of gas−liquid mass transfer in a small bubbly column. The aim is to show how simple experiments can be used to directly quantify mass transfer without the need of sophisticated probes or complex titrations. The method here proposed is based on the “red bottle” reaction, i.e. the reversible oxidation by oxygen of dihydroresorufin to red resorufin. This reaction produces a distinctive red color and, in the specific
20
condition identified, the time required to turn from colorless to red solution can be directly correlated with the inverse of the volumetric mass transfer coefficient kL.a (s-1). Therefore, this reaction can be used to estimate the mass flux of oxygen transferred from the gas phase (bubbles) to the liquid phase and to study how this flux is affected by geometrical and operating parameters of bubbly flows. The lab work described is thus very convenient for education purposes. This is the first visual
25
demonstration allowing mass transfer to be quantified with good precision, opening up a wide range of applications.
GRAPHICAL ABSTRACT
30
KEYWORDS
Upper-Division Undergraduate, Demonstrations, Chemical Engineering, Hands-On Learning/Manipulatives, Kinetics, Industrial Chemistry, Mechanisms of Reactions, Transport Properties, Organic Chemistry
INTRODUCTION
35
The "blue bottle" experiment, in which a transparent liquid turns blue when shaken and becomes colorless when left at rest, is a very popular reaction for both demonstration purposes and practical work in educational activities. It requires three chemicals: glucose, sodium hydroxide and methylene blue (dye) in water. The origins of this experiment are not well known. The first references to reactions between sugar and this dye (synthesized by Heinrich Caro in 1876) date
40
back to the 1920s 1–3. The name "Blue Bottle Experiment" was first popularized by Campbell4 in
1963 who demonstrated the occurrence of a 4-step reaction scheme between glucose, dissolved air (oxygen) and dye, and proposed a global equation of the reaction of glucose and air with the dye, regenerated in the reaction system, as a catalyst. Many variations and modifications of the pioneer experiment have been put forward. Researchers5 proposed the use of other sugars and 45
dyes to achieve different reaction rates and colors or a “green" version6 based on the use of
vitamin and avoiding the use of sodium hydroxide. Some of these systems can be implemented to display other colors, like the "red bottle" experiment, sometimes called the "Vanishing Valentine"7,8, involving resazurin, or a sequence of three colors yellow/red/green called the
"multi-colored bottle" using indigo carmine9. These reactions have been used as an interesting 50
activity on reaction mechanism identification10. Recently, alternatives compositions have been
proposed11,12 by adding benzoin in the liquid phase in order to catalyze the reaction, and
suggesting other molecules as the dye: safranin (red), phenanthrenequinone (orange), erioglaucine (light blue) and tetrazolium chloride (red). This reaction has been largely used as a demonstration but, recently, some authors have used it as an accurate tool13,14 to characterize 55
the mass transfer at the gas-liquid interface in chemical engineering systems. The first works devoted to mass transfer around bubbles flowing in a millimetric channel have been reported by15–19. Later, the mass transfer was studied in a thin gap cell 20–22 and in a bubbly column 23,24.
Thanks to a specific calibration procedure 15 and by considering a simple mass balance in the
liquid phase 17, the oxygen flux transferred and the gas-liquid mass transfer coefficients could be 60
quantified in different types of systems. However, all these studies have required expensive high-speed or high-resolution image acquisition systems and specific, heavy image processing that are quite impossible to implement in a chemistry lab for students. Recently, a simple demonstration25
has been proposed to illustrate the gas-liquid mass transfer in a stirred tank at different scales; for that, they have used the "blue bottle" reaction to visualize the rate of mass transfer and how
65
this rate was affected by the size of the vessel, the air flow rate and the rotational speed. The time required to obtain a steady color change could be analyzed and discussed in relation with the classical gas-liquid mass transfer correlations 26 in order to illustrate the effects of the operating
conditions. These authors did not note that this time could be also directly linked to the overall gas-liquid mass transfer coefficient, and that a direct and simple calculation would be possible if
70
the “red bottle” experiment was used instead of the “blue bottle” thanks to its faster kinetic properties27.
The objective of the present paper is to propose a demonstration that enables the gas-liquid mass transfer to be visualized and, with the observation of the color change from colorless to red, the overall gas-liquid mass transfer coefficient to be determined. For illustrative purposes, this is
75
applied in a small bubble column where bubbles are generated by sparging.
PRINCIPLE
This method is performed with the reaction system involving resazurin with sodium hydroxide and glucose in a small bubbly reactor (250 mL). In bubbly reactors, aeration provides a perfect mixing to the liquid phase (i.e. the concentration is uniform in the liquid phase), then, based on
80
an oxygen mass balance in the liquid phase, one can write:
with the mass flux of oxygen transferred per unit of volume in g/s/m3, is the mass
85
concentration of oxygen in g/m3, kL.a is the volumetric gas-liquid mass transfer coefficient in s-1,
E is the enhancement factor and the oxygen saturation concentration in g/m3.
In this study, a chemical reaction involving resazurin with sodium hydroxide and glucose in a small bubbly reactor (250 mL) has been considered. This reaction is fast (typically few milliseconds 27): the concentration of oxygen, , remains always null ( ) as it is 90
instantaneously consumed by the dye (dihydroresorufin)15. Some authors 15,17 have also
demonstrated that the enhancement factor, E, is equal to 1 in the classical bubble column condition (namely, when liquid-side mass transfer coefficients kL are about 10-4 m/s, see the
supplementary section). As shown by Equation 2, two moles of dye react with one mole of oxygen: O2 + 2 Dihydroresorufin (colorless) → 2 Resorufin (pink/red) + 2 H2O (2)
95
As a consequence, and because no oxygen is present in the liquid at the beginning, one can write:
(3)
100
Where , , are respectively the molar concentrations in oxygen,
dihydroresorufin (colorless) and resorufin (colored) in mol/m3. By coupling Equation 1 & 3, the
following equation is obtained:
(4) 105
By integrating Equation 4 from t = 0 to a time t, the following equation is deduced:
with M the molar mass (either of oxygen or dye) in g/mol and the dye concentration
110
in g/m3. When all the colorless reactant (dihydroresorufin) is consumed (complete conversion),
the solution reaches its maximum color intensity, corresponding to a concentration where the red dye (resorufin) is equal to the initial concentration of the colorless dye (dihydroresorufin), namely
. In such conditions, it becomes possible to calculate the volumetric
gas-liquid mass transfer coefficient directly from the knowledge of the initial concentration of dye
115
and the measured aeration time, as illustrated in Equation 5. For make the calculation easier, the initial concentration of the dye could fulfill the following condition:
(6)
120
Knowing that Mdye = 229.19 g/mol, MO2 = 32 g/mol and = 8.15 mg/L 15, then this
concentration corresponds to = 116.7 mg/L or
= 0.51 mmol/L. In this
specific condition, the calculation of the volumetric gas-liquid mass transfer is equal to the inverse of the coloration time as:
125
(7)
It can be noted that this concentration is only recommended for an easy and direct calculation of the mass transfer coefficient (Equation 7); the concentration of the dye can be indeed increased in order to make the experiment longer, thus increasing the precision of the measurement. The
130
concentration can be also reduced in order to reduce the cost of the experiments.
It is interesting to observe that this experiment is very close to the sulfite static method classically used for the measurement of mass transfer coefficient 28,29. In the latter method, for a given
aeration time, the sodium sulfite (Na2SO3) reacts with the oxygen transferred into the liquid phase 135
by the bubbles generated. The concentration of the remaining sulfite is determined by the iodometric method (oxidation of sulfite by iodine, and titration of excess iodine by sodium thiosulfate). As the initial oxygen concentration is kept at zero (nitrogen flushing), kL.a is then
calculated from a very similar mass balance linking the aeration time to the amount of sulfite reacted: 140 (8)
As a consequence, this technique with the “red bottle” proposed in this paper can be seen as a visualization extension of the classical titration with sulfite.
145
It is also important to keep in mind that, at present, the technique can be applied only with resazurin. Indeed, the knowledge of additional data (kinetic constant and order, diffusion coefficients in basic solution of oxygen and dye) is needed to validate that the chemical regime is still fast with respect to the mass transfer process. This has been demonstrated for the resazurin system 17 but not yet for the “blue bottle” experiment and other systems. If this condition is not 150
reached (ttransfer=1/kL.a >> treaction), the enhancement factor E can become higher than 1, meaning
that the methods cannot be used as previously described and further calculations are needed.
MATERIAL
155
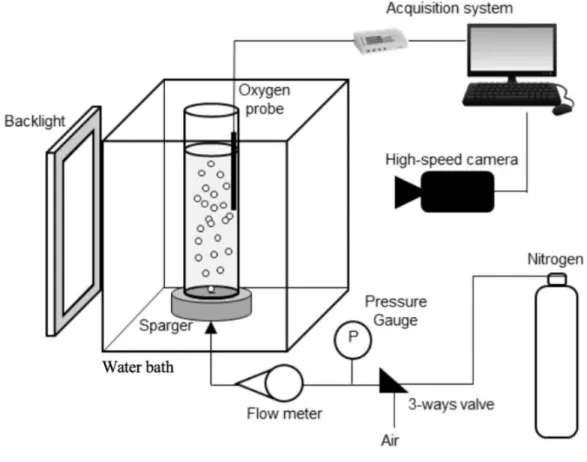
Experiments were carried out in a glass bubble column (0.045 m in diameter, 0.40 m high, 0.23 m height of liquid), submerged in a water bath regulated in temperature (Figure 1). The air sparger was a multiple orifice plate with two orifice sizes: 0.5 and 0.8 mm, having an interval of 1 cm between adjacent orifices. The gas was provided from a pressurized gas network in the laboratory. The gas superficial velocity (flowrate over the column section) was set to 0.6 cm/s,
corresponding to a flow rate of 0.6 L/min. The column was filled with 250 mL of the colorimetric solution. The concentration of the dye was chosen at 116.7 mg/L in order to use the simple equation 7. In the presence of sodium hydroxide (20 g/L), and glucose (20 g/L), the resazurin (blue) was first reduced to resorufin (pink/red), which was then reduced to dihydroresorufin (colorless) as shown by Equation 2. The presence of glucose and sodium hydroxide in larger
165
amount than the dye made possible this reaction to be reversible (the resorufin being transformed back into dihydroresorufin), with a slow kinetics (few minutes). However, this reversibility remains limited by the initial amount of glucose, which tends to oxidize after several hours.
Figure 1. Experimental setup.
170
For demonstrative purposes, the volumetric overall mass transfer coefficients (kL.a) associated
with the train of bubbles generated were also measured using the dynamic method 30 involving
(Vision Research, Miro – M110, USA) as depicted in Figure 1. These elements are not required when proposing this demonstration to students; they are here used only to validate the
175
technique.
DEMONSTRATION
The procedure consists in filling the vessel with the “red bottle” solution of potassium hydroxide, glucose, and resazurin (at the concentrations reported previously) and by sparging it with nitrogen gas until the pink/red color disappears. Then, nitrogen is replaced by air, at the
180
desired flow rate, making the pink/red color reappears. The time where the color level remains unchanged can be measured with a stopwatch.
A typical sequence is represented in Figure 2. As the reaction is reversible, if the air is stopped, the solution becomes colorless again, and the experiment can be run another time (this operation could also be performed with a nitrogen flush). Thus, the student can experiment with
185
many operating conditions in a short time. The authors recommend nevertheless operating the experiment less than 3 hours after making up the dye solution in order to minimize the glucose oxidation reaction. Sequential runs under different conditions can demonstrate the effect of orifice size on the mass transfer, and the effect of adding a packing system in the column (Figure 3.b).
190
Figure 2. Evolution of the color in the column in function of the time. The superficial velocity of gas is 0.6 cm/s and
the orifice diameter is 0.5 mm. The solution is getting more red in function of the time. These photographs are
200
used to measure the gray light intensity over time.
HAZARDS
Sodium hydroxide and its solutions are corrosive. Protective gloves and a laboratory coat should be worn together with safety eyewear. Dissolution of solid sodium hydroxide in water is a highly exothermic reaction and a large amount of heat liberated can pose a threat to safety through the
205
possibility of splashing. Personal protective equipment such as dust mask, eyeshields and gloves should be used for the manipulation of the resazurin dyes.
RESULTS AND DISCUSSION
In order to validate the technique, the images shown in Figure 2 were analyzed by implementing
210
an image processing software (Matlab, Mathworks, USA). The averaged grey level of the liquid part is plotted versus time in Figure 3.a. Initially, no color is observed (the grey level is maximal), because the oxygen concentration in the vessel is null. At t=0, air begins to be injected into the vessel and, as the reaction starts, the solution becomes pink/red and darker, corresponding to a decrease of the grey level. After more than a minute, the solution has turned pink/red and the
215
grey level becomes constant as all the dye has reacted. It can be deduced that an aeration time of 70 s is required to reach 95% of the grey level value decrease. With this criterion, the precision of the measurement was estimated at 5 s. It can be observed in Figure 3.a that curve is not linear contrary to what is expected from equation 5. This could be explained by the fact that the bubbly column does not exactly behave as a perfectly mixed reactor, especially the parts close to the wall,
220
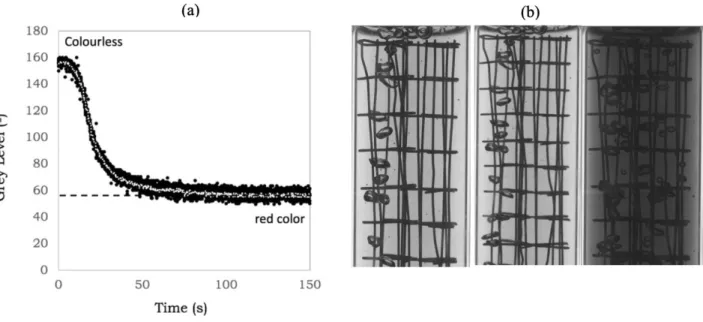
Figure 3. (a) Evolution of the averaged grey level of the liquid in the bubble column as a function of time. The
230
superficial velocity of gas is 0.6 cm/s and the orifice diameter is 0.5 mm. (b) A typical sequence for the experiments with a grid solid packing system. The superficial velocity of gas is 0.6 cm/s and the orifice diameter is
0.5 mm
The same analysis of the aeration time required to turn the liquid in the column red was
235
performed in presence of a grid packing system located in the column. As depicted in Figure 3.b, the time obtained was 74 s, which is very close to the value found without packing.
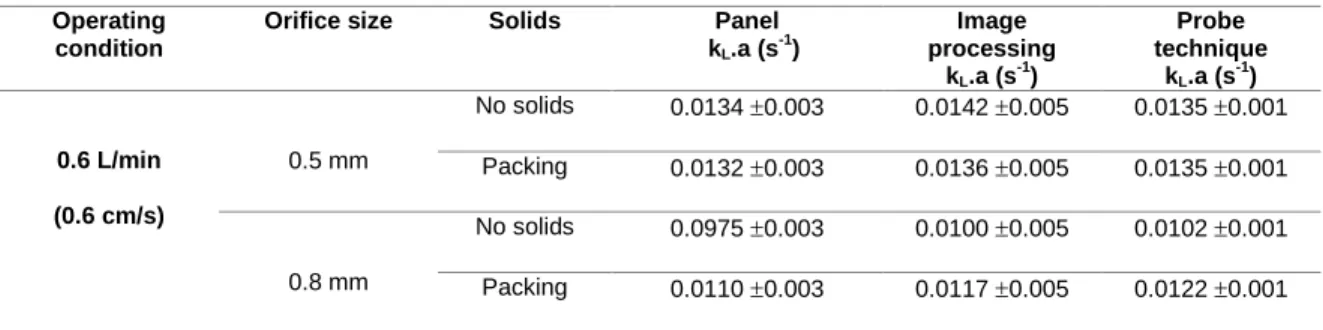
These experiments were reproduced for a second orifice size (i.e., 0.8mm) at the same gas flowrate and aeration times of 85 s and 100 s were obtained with and without packing. The associated volumetric mass transfer coefficients were calculated with equation 7, and the values
240
were reported in Table 1. In Table 1, the results were also compared with the ones deduced from the classical dynamic method (with oxygen probes). One can observe that a very good agreement (3% of difference) is obtained between two techniques, thus validating the visualization approach proposed. In addition, it can be noted that, for the small orifice, the packing does not have a
notable impact on the mass transfer coefficient (2% of difference) but, for the bigger orifice, the
245
packing increases the mass transfer coefficient significantly (15% of difference). This could be explained by the occurrence of bubble breakup on the packing grid, leading to a decrease in bubble size and an increase in interfacial area a (the ratio between the total bubble surface and the liquid volume, in m-1). Finally, the increase of the orifice size decreases the mass transfer
coefficient strongly (25% of difference), which can be explained by the formation of bigger
250
bubbles. These types of experiments, in different operating conditions, represent an interesting base to discuss with students on what parameters control the gas-liquid mass transfer phenomena and how the latter can be improved.
Operating condition
Orifice size Solids Panel
kL.a (s-1) Image processing kL.a (s-1) Probe technique kL.a (s-1) 0.6 L/min (0.6 cm/s) 0.5 mm No solids 0.0134 0.003 0.0142 0.005 0.0135 0.001 Packing 0.0132 0.003 0.0136 0.005 0.0135 0.001 0.8 mm No solids 0.0975 0.003 0.0100 0.005 0.0102 0.001 Packing 0.0110 0.003 0.0117 0.005 0.0122 0.001
Table 1. Experimental values of the mass transfer coefficient.
255
DEMONSTRATION WITH STUDENTS
The same set of experiments has been displayed to each member of a volunteer panel of 35 students and professors at the University of Toulouse. These sequences corresponded to the experiment performed in the device at two different orifice sizes, with and without packing. The panel was asked the simple question: “What is the time corresponding to the final change of color of
260
the liquid?” The results obtained were averaged and the mass transfer coefficient corresponding to
the panel as a whole has been added to Table 1. The difference between the three techniques was very small (less than 3%), but it can be observed that the panel always underestimated the mass transfer, and so overestimated the aeration time needed to reach the steady red color. This phenomenon could be explained by the persistence of vision occurring when an observer watched
experiment to be run with only the eyes of the students, without sophisticated and expensive cameras or probes. Finally, this activity is a striking example how a well-known chemical reaction could help in the quantification of the chemical engineering operation of gas-liquid mass transfer.
270
CONCLUSION
In this paper, an experimental setup and specific procedure have been proposed to adapt the well-known “red bottle” reaction so as to visualize and quantify chemical engineering principles related to mass transfer phenomena. The main advantages are the low cost of the materials and
275
the ease of use. Contrary to the classical techniques, it requires no oxygen probes, no titration and no calibration procedure. The experiment is as simple as a colorimetric titration method. The new calculation method proposed, based on the measurement of the aeration time, requires only a stopwatch and, thanks to the reversible properties of the reaction, multiple runs of the visualization can be performed in succession. This new demonstration offers thus a striking,
280
colorful visualization of the effects of various operating parameters (ie. orifice size, gas flow rate and packing) on mass transfer, but a number of other conditions can easily be compared, such as the effect of vessel size or of the sparger design. The demonstration can also be combined with a simple acquisition video with the objective to dissociate the effect of the interfacial area, a (linked to the bubble size and gas hold-up) and the mass transfer coefficient, kL. This experiment also 285
constitutes a good introduction to discuss the competition between mass transfer and reaction. A further opportunity, not developed in this work, would be to perform comparisons of the recent adaptations of the blue bottle reaction system to "environment-friendly systems” 6, reducing the
hazardous conditions or systems catalyzed 12.
SUPPORTING INFORMATION
290
AUTHOR INFORMATION
Corresponding Author Nicolas DIETRICH
*E-mail: [email protected]
295
Personal website: ndietrich.com
ORCID: orcid.org/0000-0001-6169-3101
Note: The author declares no competing financial interest.
The authors declare no competing financial interest.
REFERENCES
(1) Lane, J. H.; Eynon, L. Estimation of Sugar in Urine by Means of Fehling’s
Solution with Methylene Blue as Internal Indicator. Analyst 1924, 49 (581), 366–371.
https://doi.org/10.1039/AN9244900366.
305
(2) DuBois, M.; Gilles, K. A.; Hamilton, J. K.; Rebers, P. A.; Smith, F.
Colorimetric Method for Determination of Sugars and Related Substances. Analytical
Chemistry 1956, 28 (3), 350–356. https://doi.org/10.1021/ac60111a017.
(3) Dutton, F. B. Methylene Blue - Reduction and Oxidation. J. Chem. Educ.
1960, 37 (12), A799. https://doi.org/10.1021/ed037pA799.1.
310
(4) Campbell, J. A. Kinetics—Early and Often. J. Chem. Educ. 1963, 40 (11),
578. https://doi.org/10.1021/ed040p578.
(5) Cook, A. G.; Tolliver, R. M.; Williams, J. E. The Blue Bottle Experiment
Revisited: How Blue? How Sweet? J. Chem. Educ. 1994, 71 (2), 160.
https://doi.org/10.1021/ed071p160.
315
(6) Wellman, W. E.; Noble, M. E.; Tom Healy. Greening the Blue Bottle. J.
Chem. Educ. 2003, 80 (5), 537. https://doi.org/10.1021/ed080p537.
(7) Limpanuparb, T.; Hsu, S. The Colorful Chemical Bottle Experiment Kit:
From School Laboratory To Public Demonstration. arXiv:1504.02604 [physics] 2015.
(8) Rajchakit, U.; Limpanuparb, T. Greening the Traffic Light: Air Oxidation of
320
Vitamin C Catalyzed by Indicators. J. Chem. Educ. 2016, 93 (8), 1486–1489.
https://doi.org/10.1021/acs.jchemed.5b00630.
(9) Hile, L. The Blue Bottle Revisited. J. Chem. Educ. 1998, 75 (9), 1067.
https://doi.org/10.1021/ed075p1067.1.
(10) Limpanuparb, T.; Areekul, C.; Montriwat, P.; Rajchakit, U. Blue Bottle
325
Experiment: Learning Chemistry without Knowing the Chemicals. J. Chem. Educ.
2017, 94 (6), 730–737. https://doi.org/10.1021/acs.jchemed.6b00844.
(11) Staiger, F. A.; Peterson, J. P.; Campbell, D. J. Variations on the
“Blue-Bottle” Demonstration Using Food Items That Contain FD&C Blue #1. J. Chem. Educ.
2015, 92 (10), 1684–1686. https://doi.org/10.1021/acs.jchemed.5b00190.
330
(12) Rajchakit, U.; Limpanuparb, T. Rapid Blue Bottle Experiment:
Autoxidation of Benzoin Catalyzed by Redox Indicators. J. Chem. Educ. 2016, 93 (8),
1490–1494. https://doi.org/10.1021/acs.jchemed.6b00018.
(13) Paul, M.; Strassl, F.; Hoffmann, A.; Hoffmann, M.; Schlüter, M.;
Herres-Pawlis, S. Reaction Systems for Bubbly Flows. Eur. J. Inorg. Chem. 2018, 20–21,
335
2101–2124; DOI: 10.1002/ejic.201800146.
(14) Rüttinger, S.; Spille, C.; Hoffmann, M.; Schlüter, M. Laser-Induced
Fluorescence in Multiphase Systems. ChemBioEng Reviews 2018, 5 (4), 253–269.
https://doi.org/10.1002/cben.201800005.
(15) Dietrich, N.; Loubière, K.; Jimenez, M.; Hébrard, G.; Gourdon, C. A New
340
Bubbles Moving in a Straight Millimetric Square Channel. Chemical Engineering
Science 2013, 100, 172–182. https://doi.org/10.1016/j.ces.2013.03.041.
(16) Yang, L.; Dietrich, N.; Loubière, K.; Gourdon, C.; Hébrard, G. Visualization
and Characterization of Gas-Liquid Mass Transfer around a Taylor Bubble Right after
345
the Formation Stage in Microreactors. Chem. Eng. Sci. 2016, 143, 364–368; DOI:
10.1016/j.ces.2016.01.013.
(17) Yang, L.; Loubière, K.; Dietrich, N.; Le Men, C.; Gourdon, C.; Hébrard, G.
Local Investigations on the Gas-Liquid Mass Transfer around Taylor Bubbles Flowing
in a Meandering Millimetric Square Channel. Chemical Engineering Science 2017,
350
165 (Supplement C), 192–203. https://doi.org/10.1016/j.ces.2017.03.007.
(18) Krieger, W.; Lamsfuß, J.; Zhang, W.; Kockmann, N. Local Mass Transfer
Phenomena and Chemical Selectivity of Gas-Liquid Reactions in Capillaries. Chem.
Eng. Technol. 2017, 40 (11), 2134–2143. https://doi.org/10.1002/ceat.201700420.
(19) Kováts, P.; Pohl, D.; Thévenin, D.; Zähringer, K. Optical Determination of
355
Oxygen Mass Transfer in a Helically-Coiled Pipe Compared to a Straight Horizontal
Tube. Chemical Engineering Science 2018, 190, 273–285.
https://doi.org/10.1016/j.ces.2018.06.029.
(20) Kherbeche, A.; Milnes, J.; Jimenez, M.; Dietrich, N.; Hébrard, G.; Lekhlif,
B. Multi-Scale Analysis of the Influence of Physicochemical Parameters on the
360
Hydrodynamic and Gas–Liquid Mass Transfer in Gas/Liquid/Solid Reactors.
Chemical Engineering Science 2013, 100, 515–528.
https://doi.org/10.1016/j.ces.2013.06.025.
(21) Xu, F.; Jimenez, M.; Dietrich, N.; Hébrard, G. Fast Determination of
Gas-Liquid Diffusion Coefficient by an Innovative Double Approach. Chemical Engineering
365
Science 2017, 170 (Supplement C), 68–76.
https://doi.org/10.1016/j.ces.2017.02.043.
(22) Felis, F.; Dietrich, N.; Billet, A.-M.; Strassl, F.; Herres-Pawlis, S.; Roig, V.;
Loubière, K. Experiments on Reactive Mass Transfer around an Oxygen Bubble
Rising Freely in a Confined Cell Using Colourimetric Methods; 19th International
370
Symposium on the Application of Laser and Imaging Techniques to Fluid Mechanics,
Lisbon, Portugal, July 16-19, 2018.
(23) Dietrich, N.; Hébrard, G. Visualisation of Gas–Liquid Mass Transfer
around a Rising Bubble in a Quiescent Liquid Using an Oxygen Sensitive Dye. Heat
Mass Transfer 2018, 54 (7), 2163–2171; DOI: 10.1007/s00231-018-2297-3.
375
(24) Xu, F.; Cockx, A.; Hébrard, G.; Dietrich, N. Mass Transfer and Diffusion of
a Single Bubble Rising in Polymer Solutions. Ind. Eng. Chem. Res. 2018, 57 (44),
15181–15194; DOI: 10.1021/acs.iecr.8b03617.
(25) Piccione, P. M.; Rasheed, A. A.; Quarmby, A.; Dionisi, D. Direct
Visualization of Scale-Up Effects on the Mass Transfer Coefficient through the “Blue
380
https://doi.org/10.1021/acs.jchemed.6b00633.
(26) Roustan, M. Transferts gaz-liquide dans les procédés de traitement des
eaux et des effluents gazeux http://cat.inist.fr/?aModele=afficheN&cpsidt=15123114
(accessed Jan 22, 2014).
385
(27) Yang, L.; Dietrich, N.; Hébrard, G.; Loubière, K.; Gourdon, C. Optical
Methods to Investigate the Enhancement Factor of an Oxygen-Sensitive Colorimetric
Reaction Using Microreactors. AIChE J. 2017, 63 (6), 2272–2284.
https://doi.org/10.1002/aic.15547.
(28) Painmanakul, P.; Hébrard, G. Effect of Different Contaminants on the
α-390
Factor: Local Experimental Method and Modeling. Chemical Engineering Research
and Design 2008, 86 (11), 1207–1215.
https://doi.org/10.1016/j.cherd.2008.06.009.
(29) Jamnongwong, M.; Loubiere, K.; Dietrich, N.; Hébrard, G. Experimental
Study of Oxygen Diffusion Coefficients in Clean Water Containing Salt, Glucose or
395
Surfactant: Consequences on the Liquid-Side Mass Transfer Coefficients. Chemical
Engineering Journal 2010, 165 (3), 758–768.
https://doi.org/10.1016/j.cej.2010.09.040.
(30) Wongwailikhit, K.; Warunyuwong, P.; Chawaloesphonsiya, N.; Dietrich, N.;
Hébrard, G.; Painmanakul, P. Gas Sparger Orifice Sizes and Solid Particle
400