Open Archive TOULOUSE Archive Ouverte (OATAO)
OATAO is an open access repository that collects the work of Toulouse researchers and
makes it freely available over the web where possible.
This is an author-deposited version published in :
http://oatao.univ-toulouse.fr/
Eprints ID : 19307
To link to this article :
DOI: 10.1016/j.ces.2017.03.007
URL :
http://dx.doi.org/10.1016/j.ces.2017.03.007
To cite this version : Yang, Lixia and Loubiere, Karine and Dietrich, Nicolas
and LE MEN, Claude and Gourdon, Christophe and Hebrard, Gilles Local
investigations on the gas-liquid mass transfer around Taylor bubbles flowing in
a meandering millimetric square channel. (2017) Chemical Engineering
Science, vol. 165. pp. 192-203. ISSN 0009-2509
Any correspondence concerning this service should be sent to the repository
administrator:
[email protected]
Local investigations on the gas-liquid mass transfer around Taylor
bubbles flowing in a meandering millimetric square channel
Lixia Yang
a,b, Karine Loubière
b,⇑, Nicolas Dietrich
a, Claude Le Men
a, Christophe Gourdon
b, Gilles Hébrard
aaLaboratoire d’Ingénierie des Systèmes Biologiques et des Procédés (LISBP), Université de Toulouse, CNRS, INRA, INSA, Toulouse, France bLaboratoire de Génie Chimique, Université de Toulouse, CNRS, INPT, UPS, Toulouse, France
a r t i c l e
i n f o
Keywords:
Gas-liquid mass transfer Taylor bubbles Meandering channel Colorimetric technique Image processing
a b s t r a c t
Gas-liquid mass transfer around Taylor bubbles moving in a meandering millimetric square channel was locally visualized and characterized in the present study. For that, the colorimetric technique proposed by Dietrich et al. (2013) was implemented. With this technique, the evolution of equivalent oxygen concen-tration fields in the liquid slugs passing through one and several bends was firstly described. In particular, it was observed how the flow structure (recirculation zones) inside the liquid slugs were twisted and split by the periodic bends (centrifugal effect), until reaching, after several bends, a uniform O2concentration inside the liquid slugs. The influence of the ‘‘turning point”, joining two ‘‘straight” sections of meandering channel was also highlighted: a slowing down of the gas-liquid mass transfer was clearly shown. Volumetric mass transfer coefficients were determined at last by fitting the experimental axial profiles of averaged oxygen concentrations in the liquid slugs (before the turning point) with the ones predicted by a classical plug-flow model.
1. Introduction
Since the last decade, process intensification opens up interest-ing perspectives for the fine chemical and pharmaceutical indus-tries (Stankiewicz and Moulijn, 2000; Tochon et al., 2010; Commenge and Falk, 2014; Gourdon et al., 2015). A wide range of chemistries has been investigated through the implementation of flow reactors, showing the advantages and the improvements related to such technologies, with regards to quality, safety, com-petitiveness and eco-impact (Pelleter and Renaud, 2009; Nieves-Remacha et al., 2013; Darvas et al., 2014; Elgue et al., 2015). In this way, various equipments have been developed, benefiting from miniaturization techniques and micro (or milli) fluidics. Most of them are the devices where chemical reactions are performed in
narrow channels involving a very high surface area to volume ratio and thus providing very efficient rates of mass and heat transfer.
Among all the process intensification technologies, heat exchanger reactors (HEX reactors), combining a reactor and a heat exchanger in only one unit, are particularly performing in terms of versatility and modularity features, but also of heat and mass transfer capabilities (Anxionnaz et al., 2008; Anxionnaz, 2009; Théron et al., 2014). They now become standard tools for process development and continuous production. In order to combine intensified heat and mass transfers, high residence time and com-pactness in such HEX reactors, the use of 2D-structured meander-ing (or tortuous or serpentine or wavy) channel structures constitutes an interesting solution. Indeed, contrary to the case in a straight channel, the occurrence of curvatures (or bends) gener-ates flow instabilities and secondary flows (Dean vortices) in fluid motion (Dean, 1928), where the mixing between the core fluid and near-wall fluid can be improved; the boundary layers are also disrupted and thinned, thus affecting positively heat and mass http://dx.doi.org/10.1016/j.ces.2017.03.007
⇑Corresponding author.
transfer phenomena. Most of the existed literature dealing with such type of meandering channels focus on the study of single liq-uid phase flows, reactive or not (Xiong and Chung, 2007; Anxionnaz-Minvielle et al., 2013; Karale et al., 2013; Dai et al., 2015a). Few attention has been surprisingly paid on the implemen-tation of gas-liquid systems in meandering channels, whereas: (i) the gas-liquid systems occupy a key place in scientific research and industrial application fields (hydrogenations, sensitized photo-oxygenations, fluorinations, biochemical reactions); (ii) there still raises many fundamental questions (coupling between transport phenomena and kinetics); (iii) studies in straight micro- or millimetric channels are the object of an abundant liter-ature (van Baten and Krishna, 2004; Roudet et al., 2011; Yao et al., 2014; Haghnegahdar et al., 2016; Haase et al., 2016; Butler et al., 2016). In such two-phase reactive systems, the knowledge of mass transfer between gas and liquid phases is then extremely impor-tant; as managing the chemical kinetics, it can become the limiting step controlling the chemical reactions in terms of conversion and selectivity.
While the influence of the occurrence of bends in millimetric channels on the gas-liquid hydrodynamics (i.e. flow regime, mixing efficiency, interfacial area) has been highlighted by several authors (Günther et al., 2004; Fries and von Rohr, 2009; Dessimoz et al., 2010), rare are at present the studies quantifying how curvatures affect the gas-liquid mass transfer (Roudet et al., 2011; Kuhn and Jensen, 2012).Roudet et al. (2011) showed that, when compared to a straight channel of identical compactness and sectional-area, the meandering channel induced: (i) a delay in the transition from Taylor to annular-slug regimes; (ii) a rise of 10–20% in bubble lengths while conserving almost identical slug lengths; (iii) higher deformations of bubble nose and rear due to centrifugal forces (bends). They also observed that, for the Taylor flow regime, kLa
increased coherently when increasing superficial gas velocity jg, and that the meandering geometry had a small influence. On the contrary, this effect was found no more negligible for the slug-annular flow regime. At last, they demonstrated that, at identical compactness, the meandering channel was found to be the most competitive. As these authors used a global experimental method
(measurements of concentrations in dissolved oxygen along the channel length by oxygen microsensors), the full understanding of the mechanism controlling the gas-liquid mass transfer in a meandering channel could not be achieved, and in particular the contribution of the curvatures. In order to fill these gaps, local mea-surements, such as concentration fields of the transferred gas phase around bubbles in the liquid slugs and films, are required. However, to our best knowledge, there exists no research on the local visualization and characterization of gas-liquid mass transfer in meandering channels.
With regard to this context, this paper aims at locally studying the mass transfer around Taylor bubbles flowing in a meandering millimetric square channel, identical in elementary shape to the one used byRoudet et al. (2011)but longer. For this purpose, the colorimetric technique proposed byDietrich et al. (2013)will be used, consisting in implementing a redox reaction involving an oxygen-sensitive dye (resazurin). Its relevancy for locally visualiz-ing and characterizvisualiz-ing gas-liquid mass transfer at different scales has been outlined by Kherbeche et al. (2013) and Yang et al. (2016b). In addition, the conditions required to avoid any enhance-ment of the gas-liquid mass transfer by this reaction have been recently identified (Yang et al., 2016a); for that, the Hatta number and enhancement factor have been quantified from the determina-tion of the characteristic time of the redox reacdetermina-tion kinetic and of the diffusion coefficients of the dye and of oxygen in the reactive medium. In comparison with PLIF technique (e.g. Butler et al., 2016), the colorimetric method is more convenient and user friendly as it does not need any laser excitation or inserting a phys-ical sensor.
This paper will be structured as follows. The hydrodynamics of gas-liquid system (air/reactive medium) will be firstly character-ized, in particular in terms of the gas-liquid flow map, overall gas hold-up, bubble length, shape and velocity. The colorimetric tech-nique will be implemented in a second time, only in the case of the Taylor regime. The fields of equivalent oxygen concentration in the liquid slugs will be presented and discussed, as well as their changes according to the locations in the bend and all along the channel length; the influence of gas and liquid flow rates on these Nomenclature
a the interfacial area, m"1
A l2, cross-sectional area of the channel, m2
C equivalent oxygen concentration, kg m"3
C average equivalent oxygen concentration in the liquid slug of the unit cell, kg m"3
C⁄ dissolved oxygen concentration at saturation, kg m"3
C0 distribution parameter
dh hydraulic diameter of the meandering channel, m
e eccentricity, e2= 1 " l2/L B2
j superficial velocity, m s"1
kL the liquid side mass transfer coefficient, m s"1
kLa volumetric mass transfer coefficient, s"1
l width of the channel, m L length, m Q flow rate, m3s"1 t flowing time, s U velocity, m s"1 V volume, m3 X axial position, m b volumetric quality of gas
e
gas hold-upu volumetric mass flux of the transferred O2per unit of
bubble surface, kg m2s"1
Greek letters
l
L dynamic viscosity of the dye solution, Pa sq
L density of the dye solution, kg m"3r
L surface tension of the dye solution, N m"1Dimensionless numbers
Ca Capillary number, =
l
L# UB/r
L, dimensionlessCe Centrifugal number, =
q
L# UB2# l2/r
L# rc,dimension-less
Re Reynold number, =
q
L# UB# l/l
L, dimensionlessWe Weber number, =
q
L# UB2# l/r
L, dimensionlessSubscripts B bubble
bt before turning point d drift velocity G gas phase L liquid phase s liquid slug UC unit cell
fields will be also outlined. From them, the evolution of averaged O2 concentration with the axial location in the channel will be
determined, enabling the overall volumetric mass transfer coeffi-cients to be deduced using the classical plug-flow model. At last, these data will make possible the calculation of liquid-side mass transfer coefficients, based on an accurate determination of inter-facial areas.
2. Materials and methods
2.1. General principles of the colorimetric technique
The colorimetric technique, proposed byDietrich et al. (2013), is based on an oxygen-sensitive dye, named resazurin, that could react with oxygen in the presence of sodium hydroxide (NaOH) and glucose solution. In the reduced form, named dihydrore-sorufin, the solution is colorless, while in presence of oxygen, the oxidized form, named resorufin, is characterized by an intense pink color. As shown by previous works (Dietrich et al., 2013; Kherbeche et al., 2013; Yang et al., 2016b), the main advantage of this technique is that the extent of the oxidation reaction which corresponds to the amount of transferred (or dissolved) oxygen, are directly proportional to the color intensity (grey value) under a given concentration of resazurin. For each system, an optimal composition of the reactional medium should be determined, by taking into account: (i) the balance between the quasi-instantaneous oxidation and the slow reverse reduction kinetics; (ii) the requirements in terms of adequate color intensity levels; (iii) the fact that no enhancement of the gas-liquid mass transfer by the reaction should exist. In the present case, this led to sodium hydroxide and glucose solutions both diluted at 20 g L"1in
deion-ized water, and to a concentration of resazurin fixed at 0.1 g L"1;
according toYang et al. (2016a), the corresponding enhancement factor E equals to 1.03.
2.2. Fluid properties
All the experiments were performed at 293.15 K and atmo-spheric pressure. For the hydrodynamic experiments, the liquid phase was dye-free, composed only of D-glucose anhydrous (Fis-cher Scientific"
, CAS 50-99-7) and sodium hydroxide (VWR"
, CAS 1310-73-2), both diluted at 20 g L"1in deionized water
(conductiv-ity: 51.2
l
S m"1). For the mass transfer experiments, resazurin(Sigma Aldrich"
, CAS 62758-13-8, molecular mass: 229.19 g mol"1) which concentration was fixed at 0.1 g L"1, was added to
the previous solution. The density
q
L, dynamic viscosityl
Landsta-tic surface tension
r
Lwere measured by means of a pycnometer(
q
L± 0.2 kg m"3), a RM180 Rheomat Rheometric Scientific"
vis-cometer (
l
L± 10"3mPa s), and a Digidrop GBX"
or Krüss ten-siometer (
r
L± 0.5 mN m"1) respectively. The oxygen saturationconcentration C$
O2 was measured by implementing the Winkler
technique (Winkler, 1888) and by means of optical oxygen probes (Hach-Lange"
), and found equal to 8.15 mg L"1. All the
physico-chemical properties are reported inTable 1.
2.3. Description of the experimental set-up
The experimental set-up was depicted inFig. 1(a). It consisted of a meandering channel composed of a series of elementary units (named bends) (Fig. 1b). The channel, horizontally placed, had a square cross section A ¼ l2 where l ¼ 2 mm, and the elementary bend, which geometry was identical to the one used in Roudet et al. (2011), was characterized by a radius of curvature rc of
1.5 mm and a straight length between two bends of 6.94 mm (seeFig. 1c). Every about 15 bends, there was a big bend, named ‘‘turning point”, enabling to connect the two ‘‘straight” channel sections, which leads to change the flow direction in 180# and in order to have a long channel (the total developed straight length of the meandering channel L ¼ 1:37 m), while keeping a compact device. The channel was curved in a PolyMethyl MethAcrylate (PMMA) plate (3 cm thick), and roofed over in a watertight manner by another plate (3 cm thick). The gas phase (air) was injected via a hole of diameter 1.6 mm, pierced perpendicularly to the channel; the gas injection was spaced from about eight bends from the liq-uid one so as to enable the liqliq-uid flow to be stable (Fig. 1b). Gas (air) was delivered from the supply pipeline regulated by a mass flow controller (Brooks"
model 5850E). Before entering in the main channel, the gas flowed through a winding of a 2 m long capillary of 750 mm internal diameter, aiming at to increase the pressure drop in order to create a stable gas injection in the liquid flow. Liq-uid phase was pumped by a Cantoni"
jet pump with the flow rate regulated by a mass flow control system (Micro motion"
). The vol-umetric gas flow QG rates ranged from 0.2 to 9 L h"1and liquid
flow rates QLfrom 1 to 2 L h"1. The corresponding superficial gas
velocities jG and liquid velocities jL were: 0.014 m s"1& jG¼
QG=l 2
& 0.625 m s"1and 0.069 m s"1& j L¼ QL=l
2
& 0.139 m s"1.
2.4. Image acquisition system
The shadowgraph method was applied to investigate the gas-liquid hydrodynamics and mass transfer inside the meandering channel. The channel was lighted by a LitePad HO LED backlight (Rosco"
) and the images of the bubbles flowing along the channel were recorded by a monochromatic high-speed CMOS camera (Photron"
SA3) at 2000 frames per second. Image resolutions were 164 mm per pixel and 20 mm per pixel for the hydrodynamics and mass transfer experiments, respectively. The regions of interest were 168.1 # 84.2 mm2 and 20.1 # 20.1 mm2, respectively. For
the mass transfer experiments, the gas-liquid flow was observed at 7 different axial distances X from the gas injection, namely: X = 0.02 m, 0.07 m, 0.12 m, 0.17 m, 0.22 m, 0.32 m and 0.42 m, as depicted inFig. 1(b).
2.5. Image processing
2.5.1. Hydrodynamics of the gas-liquid flow
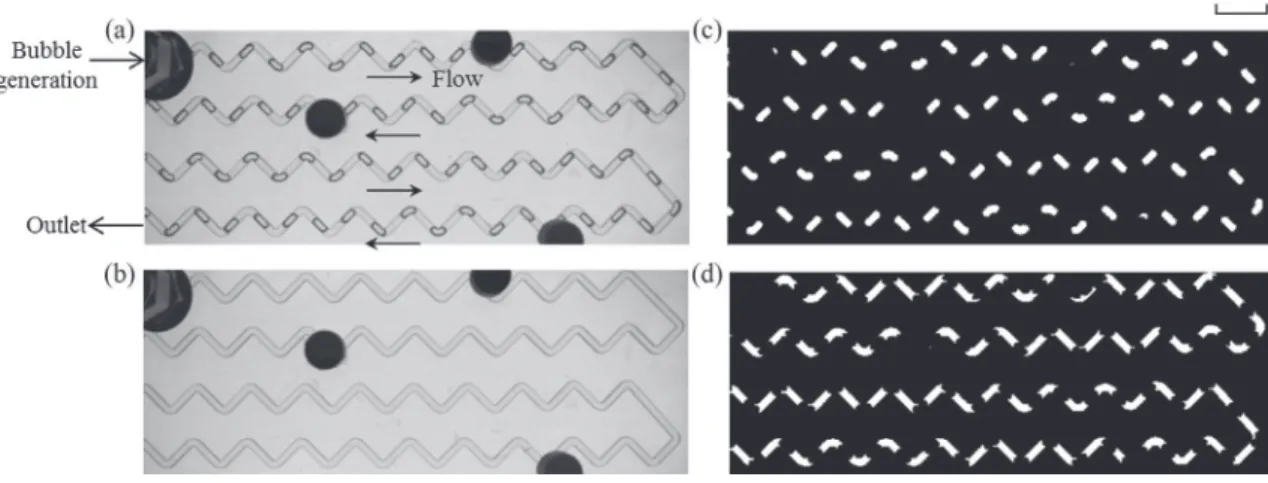
A typical raw image of the gas-liquid flow all along the channel length (1.37 m) is shown in Fig. 2(a). In order to extract the hydrodynamics parameters (gas hold-up, bubble length and
Table 1
Physio-chemical properties of the liquid phases at 293.15 K.
Liquid phase C (g L"1) r
L(mN m"1) lL(mPa s) qL(kg m"3)
Deionized water 0 71.4 1.003 996.8
Aqueous solution of glucose anhydrous and sodium hydroxide 20 20
76 1.118 1004.5
Aqueous solution of glucose anhydrous sodium hydroxide and resazurin 20 20 0.1
velocity, liquid slug length etc.) from the raw image, a background image when the channel was filled with the liquid phase was needed, shown inFig. 2(b). Then, an image post-treatment algo-rithm was implemented on the software Matlab (R2015a). In this algorithm, the background division approach was used to elimi-nate the effect of the background, instead of the traditional method consisting in subtracting to background image to each image; this was found to be more suitable to avoid illumination fluctuations and to diminish the confusion between background and fore-ground in pixels (Izquierdo-Guerra and García-Reyes, 2010). The image processing made possible the accurate detection of all the bubbles and liquid slugs inside the channel, as displayed inFig. 2
(c) and (d) respectively, as below:
! For the gas bubbles image (Fig. 2c), it was generated by the seg-mentation methods in image processing and analysis in Matlab. Namely, after dividing the raw image (Fig. 2a) with the back-ground image when the channel was filled with the liquid phase (Fig. 2b), one could obtain the image where only the bubbles left (not shown here). Then the image segmentation methods were implemented to identify all the bubbles on the image (Fig. 2c). ! For the liquid slugs image (Fig. 2d), it was generated by sub-tracting the image where only the channel left on the image with Fig. 2(c). The image where only the channel left on the image was obtained by dividing the background image when the channel was filled with the air phase (not shown here), with the one filled with the liquid phase (Fig. 2b).
Fig. 1. (a) Schematic diagram of the experimental set-up. (b) Picture of the meandering channel in the horizontal xy-plan defined in (a). X corresponds to the location (curvilinear coordinate) in the channel from the gas inlet. X = 0 is the location where the two phases enter in contact. The channel has a cross-sectional area A = 2 # 2 mm2,
and a total developed straight length L of 1.37 m. Black circles represent the axial positions where the equivalent oxygen concentration fields were measured. The sections of the channel corresponding to the so-called ‘‘turning points” are outlined by blue rectangles. The arrows indicate the flow direction. (c) Schematic of elementary units (bends) of the meandering channel.
Fig. 2. Sequence of image processing. (a) Typical raw image of gas-liquid flows. (b) Raw image of the channel filled with liquid phase. (c) Detection of the bubbles (binary image). (d) Detection of the liquid slugs (binary image). Operating condition: jL= 0.139 m s"1, jG= 0.069 m s"1.
Once detected, the areas of the channel in the xy-plane (noted as AC), all the 2D bubbles (AB) and all the 2D liquid slugs (AS)
appearing along the whole length of the channel, could be obtained from the final binary images. Thus, the gas hold-up could be calcu-lated as according to:
e
¼AB AC¼ AB l # L¼ PA B;i l # L ð1Þwhere i = 1 . . . N, N is the number of bubbles/liquid slugs. It was observed that the difference between the summation of the bubble areas and liquid slug areas P A" B;iþPAs;i# and the channel area AC
is smaller than 2%, which could be attributed due to the area occu-pied by the liquid film.
Bubble characteristics (i.e. bubble length LB, liquid slug length
LS, and bubble velocity UB) were determined only in Taylor flow
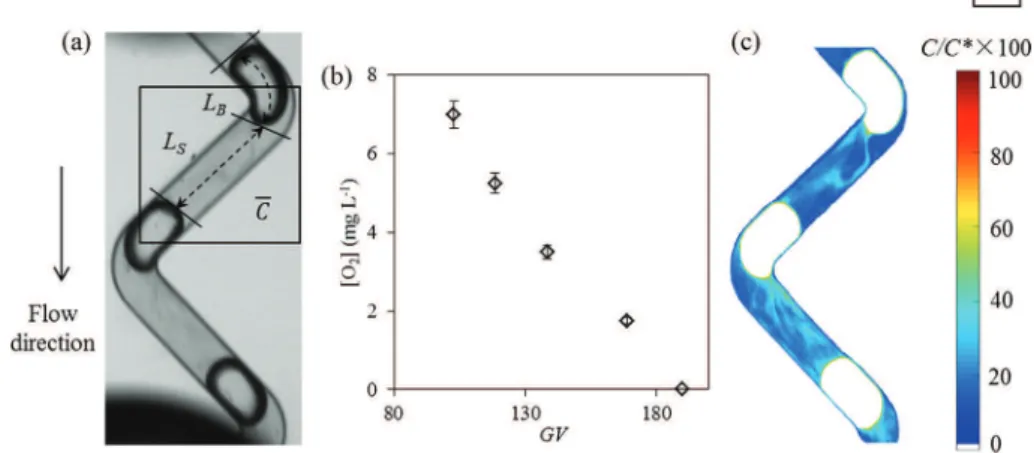
regime (defined in Section3.1.1). The lengths of bubble and of liq-uid slug (noted LBand LSrespectively, illustrated inFig. 3a) were
extracted from the major axis length of the bubbles which was an automatic procedure based on a pre-defined function. The aver-aged values of LBand LSwere calculated by considering 20 bubbles
on one image and 20 images were used. The bubble velocity UBwas
deduced from the averaged times required by bubbles to flow along two bend periods. For a given operation condition, the stan-dard deviations of the bubble characteristics (LB, LSand UB) of all
the bubbles inside the channel have found to be smaller than 6% of the averaged value.
2.5.2. Gas-liquid mass transfer
The gas-liquid mass transfer characteristics were determined by using the same image post-treatment algorithm (implemented on the software Matlab R2015a), than the one used byDietrich et al. (2013). It consisted of two main steps: (i) the determination of the calibration curve, and (ii) the image processing which enabled to transform pixel-by-pixel the acquired grey-level images into the equivalent oxygen concentration fields. Note that the term ‘‘equivalent” was used because in reality the oxygen concentration in the liquid phase was null, oxygen being fully consumed by the instantaneous oxidation reaction.
For the calibration process, different concentrations of resazurin solution were prepared: 0, 0.025 g L"1, 0.05 g L"1, 0.075 g L"1and
0.1 g L"1. An example of calibration curve (at X = 0.02 m) is
depicted inFig. 3(b), showing the linearity between the grey levels and the equivalent amounts of oxygen transferred per unit of liq-uid volume. It is important to mention that the calibration process
was re-implemented each time when the observation position (camera, light source, reactor) was changed. After applying the cal-ibration curve in the image processing, the equivalent concentra-tion field of oxygen could be obtained, and the oxygen transferred in the liquid slugs could be directly visualized, depicted inFig. 3(c). Note that under the milli- scale conditions investigated, any oxygen concentration could be unfortunately measured in the liquid film zone close to the walls.
3. Results and discussion 3.1. Gas-liquid hydrodynamics
3.1.1. Flow regimes, overall gas hold-up and bubble velocity
Depending on the gas and liquid flow rates, different spatial dis-tributions of the two phases were observed and various flow regimes were distinguished. The cartography of the gas-liquid flow regimes is displayed inFig. 4. Under the present operating condi-tions (0.014 m s"1
& jG& 0.625 m s"1; 0.069 m s"1& jL& 0.139
m s"1), three regimes can be identified:
– The Taylor flow regime occurs at low and moderate gas flow rates, for which the lengths of bubbles and liquid slugs are con-stant along the meandering channel and regularly spaced. By visualization, one can observe that (i) the bubble length LB
increases as the gas flow rate increases under a given liquid flow rate; (ii) LBdecreases as the liquid flow rate increases under a
given gas flow rate; (iii) the liquid slug length (separating two consecutive bubbles) significantly decreases as gas flow rate increases, whereas it slightly varies as liquid flow rate changes under a given gas flow rate.
– The second regime, called slug-annular flow regime, occurs at relatively high gas flow rates. Unstable slug flows appear, char-acterized by the occurrence of long bubbles. Two consecutive bubbles can be so close to each other that gas-liquid flow exhi-bits significant randomness. The rupture of an extremely long bubble could be seen under some conditions.
– The last regime is the annular flow and occurs at high gas flow rates. A continuous gas core in the channel center seems to be form.
The evolution of gas hold-up
e
(measured over the whole length of the channel, see Eq.(1)) is plotted inFig. 5as a function of the volumetric quality (fraction) of gas b ¼ ðQG=ðQGþ QLÞÞ. A deviationFig. 3. Gas-liquid mass transfer experiments: (a) Typical raw image, where C corresponds to the averaged equivalent oxygen concentration in the liquid slug, and at this axial location in the meandering channel, C measured refers to the black rectangle. (b) Calibration curve between grey levels and equivalent amounts of oxygen transferred per unit of liquid volume. (c) Equivalent oxygen concentration field, Cðx; yÞ, obtained after applying image processing and the calibration curve. Operating condition: jL= 0.139 m s"1,
jG= 0.069 m s "1
between
e
and b could be observed leading to values ofe
smaller thanb. It can be explained by writing the mass balance of the gas phase, as:A * ðjGþ jLÞ * b ¼ A * UB*
e
ð2Þ Due to the fact that the bubble travels slightly faster than pre-dicted by the superficial two-phase velocity,e
should be logically smaller than b to verify this mass balance. The degree of deviation depends on the flow regime:! relatively large for the Taylor flow (ranging from 1.17% to 15.95% with a mean deviation of 8.86%), confirming the occur-rence of bubble slip velocity;
! moderate for the slug-annular flow, varying from 0.49% to 9.03% with a mean deviation of 4.46%;
! small for the annular flow, varying from 0.45% to 0.88% with a mean deviation of 0.67%.
Meanwhile, the Taylor flow regime is characterized by rela-tively low and moderate volumetric quality of gas b (between 0.17 and 0.67). Higher b lead to non-uniform bubble size distribu-tion and irregular gas-liquid flow, like slug-annular flow, until reaching the annular flow regime for which b is up to 0.90.
The evolution of bubble velocity UBas a function of the total
superficial velocity j (equal to jGþ jL) is plotted inFig. 5(b). It can
be observed that the values of UBare always larger than those of
Fig. 4. Cartography of gas-liquid flow regimes. The flow regimes in the frame with solid lines correspond to the Taylor regime, with dashed lines the slug-annular regime, and with dash dotted lines the annular regime. The numbers in the brackets correspond to (Ca, We, Ce).
Fig. 5. (a) Evolution of gas hold-up as a function of the volumetric quality of gas in the meandering channel. The points inside the red dashed ellipse belong to Taylor flow. (b) Bubble velocity versus two-phase total superficial velocity. The solid line represents UB= jG+ jL, the dashed line UB= 1.1(jG+ jL), the dash dotted line UB= 1.45(jG+ jL).
j, thus indicating that there exists a slip phenomenon between bubbles and liquid film. The relationship between UBand j could
be usually correlated using the drift-model (Zuber and Findlay, 1965), as following:
UB¼ C0* j þ Ud ð3Þ
where, in the case of vertical two-phase-flows, C0 represents the
distribution parameter, which takes into account the effect of non-uniform flow and concentration profiles, and Udthe drift
veloc-ity, which considers the effect of the local relative velocity. In our case, the distribution parameter C0equals to 1.27, which is
consis-tent with the values encountered in the literature that vary between 0.85 and 1.38 (Tsoligkas et al., 2007); the drift velocity Udequals to "0.0043 m s"1.
3.1.2. Bubble length and slug length
For the operating conditions corresponding to the Taylor regime (0.014 m s"1& j
G& 0.208 m s"1and 0.069 m s"1&jL& 0.13 9 m s"1),
the dimensionless Bond number Bo ¼
q
L* g * l2=r
equals to 0.52, theWeber numbers We ¼
q
L* U2B* l=r
Lrange from 0.29 to 5.32, thecap-illary numbers Ca ¼
l
L* UB=r
Lfrom 0.0015 to 0.0066 and theRey-nolds numbers Re ¼
q
L* UB* l=l
Lfrom 188 to 806. For meanderingchannels, one should also consider the dimensionless number com-paring the centrifugal forces and capillary effects, defined as Ce ¼
q
L* U2 B* l
2
=
r
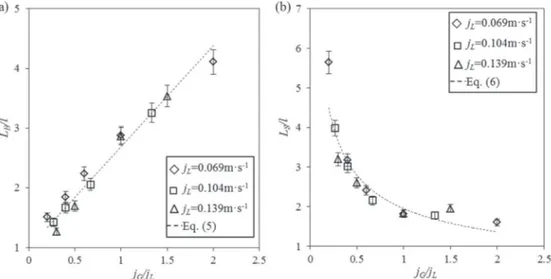
L* rc: it ranges from 0.39 to 7.19.The relationship between the normalized bubble length LB=l and
the ratio of gas superficial velocity and liquid superficial velocity,
a
¼ jG=jL, is plotted inFig. 6(a). Typically, the smallest and largestbubble lengths are 2.53 mm and 8.22 mm respectively, corre-sponding to the normalized bubble length by the width of channel LB=l from 1.27 to 4.11. It is important to precise that no obvious
decrease of LBwas observed along the axial distance X (not shown
here), indicating that the compressibility effects of the gas phase are negligible in the channel.Garstecki et al. (2006)observed that for T-junctions with aspect ratio greater than or equal to 1, the squeezing mechanism was expected to dominate the bubble for-mation for Ca < 0:01. Therefore, a simple scaling law was proposed to predict the bubble length, as below:
LB
l ¼ 1 þ k * jG jL
ð4Þ
where the value of k depends on the geometry of the T-junction. It can be seen fromFig. 6(a) that the linear evolution between LB=l and
jG=jL is experimentally verified, which would indicate that the
squeezing mechanism is suitable to predict the bubble length. In the present study, by using the linear least square regression method, it can be obtained:
LB
l ¼ 1 þ 1:69 * jG jL
; mean deviation : 6:40% ð5Þ
The present value of k is larger in comparison with the one obtained by Roudet et al. (2011) (equals 1.13). This could be explained by the fact that inRoudet et al. (2011), the experiments were not carried out in aqueous solutions of glucose and sodium hydroxide, but in water, and also that the channel’s wettability could have changed.
Fig. 6(b) plots the variation of normalized slug length LS=l as a
function of jG=jL. It can be observed that for a given jL, LS=l first
decreases significantly with the increase of jG=jL, and then changes
slightly, but remain slightly dependent on jL. This is consistent with
the literature (Qian and Lawal, 2006; Leclerc et al., 2010; Roudet et al., 2011; Abadie et al., 2012). Regression of the experimental data provides the following correlation:
LS=l¼ 1:87 * jG jL $ %"0:5
; mean deviation : 8:6% ð6Þ
The value of the power of jG=jLunderlines the predominant
con-tribution of the flow rate ratio to LS.
Table 2summarizes all the measured bubble characteristics. 3.1.3. Bubble shape
In the Taylor flow regime, the cartography of bubble shape dis-played inFig. 4shows that depending on the dimensionless num-bers (Ca,We,Ce), the bubble shape changes. It can be observed that: when Ca < 0.003, the bubble shape is slightly deformed, which is in agreement with what was observed in the creeping flow (Ca < 0.01) byGiavedoni and Saita (1999). However, in the present study (0.0015 < Ca < 0.0066), not only the viscous force could be attributed to the bubble shape, but also the inertial force (0.29 < We < 5.32).
When We < 1.40, the nose and rear menisci of the bubble could be well described as two hemispherical caps; however, when We > 1.40, the front meniscus goes flat, while the rear meniscus turns slender. This phenomena is consistent with the one observed byRoudet et al. (2011), which the bubble changes in shape were observed when We > 1.5.
Fig. 6. (a) Normalized bubble length and (b) normalized slug length versus gas liquid flow rate ratio for varying liquid phase velocities in Taylor flow regime in the meandering channel.
When the bubble passes the bends, the centrifugal effect becomes essential. Compared with the inertial forces, the centrifu-gal forces have the same order of magnitude (0.39 < Ce < 7.19), thus the bubble shape is distorted by the contributions from both two forces. When Ce < 1.90, the extent of distortion of the bubble is slight; by increasing Ca, We and Ce, the bubble deformation appear to be more pronounced.
3.1.4. Interfacial area
The Taylor bubbles flowing in the meandering channel were not only affected by inertial effects, but also by the centrifugal effects induced by their passage in the periodic bends (seeFigs. 3 and 4). These shape distortions imply that the bubbles cannot be described, as classically done, by two hemispherical caps for the bubble nose and rear, with a cylindrical shape for the bubble body. As a consequence, the bubbles were considered as prolate ellipsoid, leading to SB¼
p
# l2 2 # 1 þ LB l * earcsinðeÞ & ' ð7Þ VB¼p
# l2# LB 6 ð8Þwhere SBand VBrepresent the surface and the volume of the bubble,
respectively, and e is the eccentricity of the ellipsoidal bubble, e2¼ 1 "l2
L2 B
. For the conventional gas-liquid contactors, the defini-tion of interfacial area a can be as follow:
a ¼SG VT
ð9Þ
where SGis the total surface of the bubbles in the contactor, and VT
the whole volume of gas and liquid phases. In our case, due to the fact that one unit cell, which is constituted of one bubble and one liquid slug, appears repeatedly along the channel for Taylor flow regime, it can define a as below:
a ¼ SB VUC
¼ SB VLþ VB
ð10Þ
where VUCis the volume of one unit cell, and VLthe volume of the
liquid phase, which includes the volume of liquid slug and liquid film. As the gas fraction b ¼ QG=ðQGþ QLÞ ¼ VB=ðVBþ VLÞ, Eq.(10)
can be rewritten as:
a ¼ b #SB VB¼ b # 3 LB# 1 þ LB l * earcsinðeÞ & ' ð11Þ
Fig. 7plots the evolution of a as a function of b. It shows that a perfect linear relationship exists between a and b. From Eq.(11), it can be known that the slope represents the ratio of SB and VB,
namely, no matter how LBvaries,VSBBremains almost constant. The
values of a, ranged from 400 to 1600 m"1, are reported inTable 2
for the different operating conditions. 3.2. Gas-liquid mass transfer
With the colorimetric technique, it is possible to locally visual-ize the oxygen transferred in the liquid slugs as far as the bubbles moves along the channel length. Both the evolution of equivalent O2concentration fields in the liquid slug and the quantitative
char-acterization of the O2transferred could be obtained from the image
processing, which will be described in the following subsections, respectively.
3.2.1. Equivalent O2concentration fields
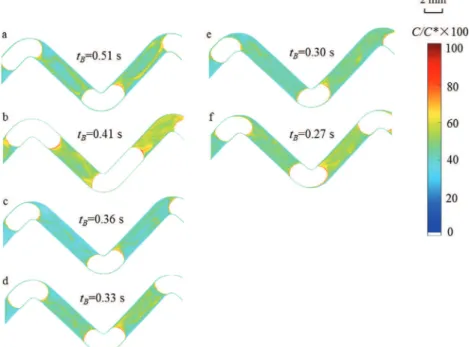
Firstly, for illustrative purpose,Fig. 8apresents the temporal evolution of the equivalent O2concentration fields in a liquid slug
located before a bubble, from the moment right after the bubble pinch-off to the following times when the bubble flows along the bends (jL= 0.139 m s"1, j
G= 0.069 m s"1). It can be observed that
at the beginning (t = 0 ms, bubble right after the pinch-off): – Oxygen accumulates in the front of the bubble: this is a
conse-quence of the bubble formation stage, during which the transfer of oxygen mainly occurs in the front part of the bubble. This is consistent with what has been observed in the straight channel (seeYang et al., 2016b).
Table 2
Bubble characteristics versus gas and liquid flow rates in the meandering channel. kLaRoudetrepresent the values obtained byRoudet et al. (2011)under the same operating
conditions in meandering channel. jL (m s"1 ) jG (m s"1 ) UB (m s"1 ) Re LB (mm) LS (mm) e a (m"1 ) kLa (s"1 ) kLaRoudet (s"1 ) kL (m s"1 ) 0.069 0.014 0.105 188.6 3.02 11.29 0.786 442 0.115 2.60 # 10"4 0.069 0.028 0.122 218.5 3.69 6.35 0.883 727 0.128 1.76 # 10"4 0.069 0.042 0.136 245.3 4.48 4.82 0.925 932 0.147 1.58 # 10"4 0.069 0.069 0.169 304.5 5.76 3.63 0.959 1216 0.157 0.148 1.29 # 10"4 0.069 0.139 0.222 399.0 8.22 2.90 0.978 1600 0.207 0.279 1.29 # 10"4 0.104 0.028 0.163 292.7 2.85 7.97 0.805 554 0.232 4.19 # 10"4 0.104 0.042 0.197 354.2 3.34 6.03 0.886 725 0.254 3.51 # 10"4 0.104 0.069 0.211 379.0 4.12 4.31 0.914 1001 0.269 2.69 # 10"4 0.104 0.139 0.346 621.4 6.51 3.57 0.966 1384 0.353 2.55 # 10"4 0.139 0.042 0.230 414.3 2.53 6.40 0.808 607 0.309 5.09 # 10"4 0.139 0.069 0.259 465.1 3.39 4.21 0.886 846 0.324 0.239 3.83 # 10"4 0.139 0.139 0.324 583.1 5.73 3.67 0.947 1226 0.387 0.441 3.16 # 10"4 0.139 0.208 0.449 806.5 7.07 3.91 0.976 1442 0.446 3.09 # 10"4
– Several filaments of higher O2 concentration can be
distin-guished in the liquid slug. Two non-symmetrical recirculation zones with respect to the channel centerline could be identified, whereas in straight channels, two recirculation loops symmetri-cal and equal in size take place.
When the liquid slug moves in the straight section between two bends (t = 5 ms and t = 10 ms), the amount of oxygen accumulated just in the front of the bubble tends to decrease as progressively transported towards the liquid slug core; the recirculation zones are also growing, until reaching to the first bend (t = 15 ms). At this location, they are twisted and split up. Then, the passage through a bend affects significantly the shape and locations of these recircu-lation zones, and more generally the structure of the flow in the liquid slug. These distortions of the filaments of higher oxygen con-centrations can be explained by the centrifugal effects induced by the channel curvature and the occurrence of the Dean vortices (Anxionnaz-Minvielle et al., 2013; Dai et al., 2015b). Herein, the mixing in the liquid slugs can be enhanced, the change in equiva-lent oxygen concentration fields in the liquid slugs as far as the bubbles moves is an indirect measure of this phenomenon (t = 20–40 ms).
The corresponding temporal evolution of the amount of trans-ferred O2in the liquid slug is displayed inFig. 8b. A kind of critical
point seems to exist corresponding to the time where the recircu-lation zones are passing the bend (t = 20 ms). Before this point, the slope of the curve is higher than the one after the point. This would highlight first the contribution of the bubble formation stage to the mass transfer, and then a slowed-down mass transfer due to the mixing effect induced by the bend that could decreases the average driving force in the liquid slugs. Deeper investigations would be required to confirm this first trend.
Fig. 9shows the evolution of O2concentration fields in the
liq-uid slug obtained at different axial positions (X = 0.02, 0.07, 0.12, 0.17, 0.22, 0.32 and 0.42 m) along the meandering channel (jL= 0.139 m s"1, jG= 0.069 m s"1). It can be seen that the
equiva-lent O2 concentration level in the liquid slugs is getting greater
and greater, until reaching an almost saturated state at X = 0.42 m. The apparent recirculation zones inside the liquid slugs also tend to disappear as far as flowing in the channel and thus the concentration fields become more and more uniform in the liquid slugs. This indicates that after several bends (about 20 bends), the gradient of O2concentration within the liquid slug no longer exists.
The accumulation of O2at the front and at the rear of the bubble
can be observed along the first bends, and tend to disappear, as the recirculation zones, for the higher axial locations, namely when the liquid slugs become almost perfectly mixed.
For different hydrodynamic conditions, a comparison of the equivalent O2concentration fields, observed at the axial position
X = 0.07 m is proposed inFig. 10. It can be logically observed that increasing the gas flow rate (and thus the bubble length) under a given liquid flow rate (i.e. Fig. 10a and b, or Fig. 10c and d, or e and f) leads to a rise in the amount of oxygen transferred in the liquid slugs. The opposite effect is observed for increasing the liquid flow rate (and thus the liquid slug length) at a given gas flow rate.
3.2.2. Overall gas-liquid mass transfer coefficient
The equivalent O2concentration at the point ðx; yÞ in the liquid
slug could be extracted from the image processing, noted as Cðx; yÞ. It is important to remind that the equivalent O2concentration field
obtained at a given location (x, y) is a mean value along the z-axis
Fig. 8a. Temporal evolution of the equivalent oxygen concentration fields in a liquid slug, from the moment right after the bubble pinch-off to the following times where the observed bubble moves in the meandering channel (operating condition: jL= 0.139 m s"1, jG= 0.069 m s"1, flow direction from left to right). The bubble in the orange
rectangle represents the bubble observed.
Fig. 8b. Evolution of the amount of transferred oxygen in the liquid slug as a function of time, from the moment right after the bubble pinch-off to the following times where the observed bubble moves in the meandering channel (operating condition: jL= 0.139 m s"1, jG= 0.069 m s"1).
(Dietrich et al., 2013), no discrimination of the equivalent oxygen concentration fields related to each xy-plane being possible along the channel height. Therefore the mass flux of O2transferred per
unit of bubble surface at a given axial position X, noted as
u
O2ðXÞ, can be calculated as below:u
O2ðXÞ ¼RRR Cðx; yÞ # dx # dy # dz
SB# tB ð12Þ
where tBis the time for a bubble for flowing to the axial position X
after the pinch-off, which is defined according to X=UB, SBthe
bub-ble surface, which can be calculated from Eq.(7).
Fig. 11(a) illustrates the evolution of
u
O2in the liquid slug as afunction of X under various jLat a given jG¼ 0:042m * s"1. It clearly
appears that
u
O2 is not constant at all along the channel length:higher values are observed for the axial positions close to the gas injection (X < 0.02 m). Such result is consistent with the observa-tions made in our previous work (Yang et al., 2016b), where it was outlined how the bubble formation stage could accelerate
the mass transfer, when compared to the flowing stage. Then, the value of
u
O2 decreases significantly as the bubble moves alongthe meandering channel, and tends to reach a plateau after X = 0.3 m.
The averaged equivalent O2concentration, C, in the liquid slug
of the unit cell (seeFig. 3a) can be also calculated, at the given axial position X, from the integration of the equivalent oxygen concen-tration field in a unit cell, or more precisely in the liquid slug as no information could be acquired in the liquid film close to the walls. This can be expressed as below:
C ¼RRR Cðx; yÞ # dx # dy # dz LUC# l
2 ð13Þ
Note that as the visualization of the bubble areas of the nose and rear is also not available due to their ellipsoidal shape, the liq-uid volume linked to these bubble areas cannot be taken into
Fig. 10. Comparison of the equivalent oxygen concentration fields in the liquid slug under various operating conditions: (a) jL= 0.069 m s"1, jG= 0.042 m s"1; (b)
jL= 0.069 m s"1, jG= 0.069 m s"1; (c) jL= 0.104 m s"1, jG= 0.042 m s"1; (d) jL= 0.104 m s"1, jG= 0.069 m s"1; (e) jL= 0.139 m s"1, jG= 0.042 m s"1; (f) jL= 0.139 m s"1,
jG= 0.069 m s"1. Axial position X equals to 0.07 m.
Fig. 9. Evolution of the equivalent oxygen concentration fields in the liquid slug as a function of the axial position in the meandering channel. Operating condition: jL= 0.139 m s"1, jG= 0.069 m s"1.
account for the calculation. It has been estimated that this bias could lead to a maximum error of 13% on the volume estimation of liquid phase in a unit cell.
Fig. 11(b) shows the evolution of the normalized averaged O2
concentration C=C$(C$being the O
2concentration at saturation)
in the liquid slug as a function of the axial position X in the chan-nel, under various gas superficial velocities jGand at given liquid
superficial velocity jL= 0.069 m s"1. It can be observed that C=C$
increases as the gas superficial velocity increases under the given liquid superficial velocity, which is consistent with the visualiza-tion presented inFig. 10.
For Taylor flow, the liquid phase consists in a series of mixed slugs, and then the plug-flow model is often used for mass transfer purposes. Uniform velocity and concentration over the channel cross section are then assumed, without taking into account the real structure of the flow in the liquid slug, for example, recircula-tion loops (Bercˇicˇ and Pintar, 1997; Shao et al., 2010). Based on an oxygen mass balance on the liquid slug, it can be written (Roudet et al., 2011):
u
O2ðXÞ ¼ jL*dC
dX¼ kL* a * ½C
$" CðXÞ, ð14Þ
In the present case, the concentration of oxygen, CðXÞ is null as fully consumed by the reaction in reality, leading to
C C$¼
kLa # X jL
ð15Þ
where kLa represents the volumetric mass transfer coefficient, s"1.
There exists then a linear relationship between C=C$and X, and
the slope stands for kLa=jL. Once applied, it has been found that Eq.
(15)could predict well the experimental values of C=C$ only for
Re < 300; for Re > 300, the deviation becomes higher than 18%. Typ-ical examples of the comparison between the experimental and predicted evolutions of C=C$are displayed inFig. 11(b). Note that,
when a fitting of the experimental values of C=C$with X is applied
(taking X = 0.02 m as a reference), different values are obtained at X = 0; this could be explained by the contribution of the bubble for-mation stage to the overall mass transfer.Fig. 11(b) also reveals that, for Re > 300, the prediction of Eq.(15)are relevant only before the axial positions below X = 0.22 m. As shown in Fig. 1(b), this specific location corresponds to the big bend (called ‘‘turning point”), namely to the location where the flow direction is changed
in 180#. After X = 0.22 m, C=C$ is underestimated by the model,
indicating that the big bend leads to slow down the flux of oxygen transferred (this is observed for all the operating conditions when Re > 300). More in-depth investigation of the velocity field struc-ture of the two-phase flow when crossing the turning point would be required to explain this phenomenon.
The overall volumetric mass transfer coefficients deduced from the fitting between Eq. (15) with the experimental points just before the turning point, kLa, are reported inTable 2. They are
ran-ged from 0.1 to 1 s"1, which the order of magnitude is in
agree-ment with the values reported by Roudet et al. (2011). This can verify the feasibility of the colorimetric technique. As already observed in the literature (Nieves-Remacha et al., 2013; Yao et al., 2014), kLa increases when the gas superficial velocity jG
increases and when the liquid superficial velocity jLincreases. It
is important to keep in mind that these overall volumetric mass transfer coefficients are just global parameters representing the inverse of characteristic time of mass transfer. The values here esti-mated remind approximate due to the assumptions made in the modelling (plug-flow) and to the fact that the contribution of the film in not taken into account.
At last, as the interfacial area a can be calculated by the assump-tion of the bubbles as prolate ellipsoid (see Secassump-tion 3.1.4), the liquid-side mass transfer coefficient before the turning point kL
can be calculated by dividing kLa with a. As shown inTable 2, for
a givenjG, kL increases with increasingjL, and is less sensitive to
the gas superficial velocity.
4. Conclusion
The colorimetric technique proposed byDietrich et al. (2013), which was based on an oxygen-sensitive dye, was implemented to locally visualize and characterize the gas-liquid mass transfer in a square meandering millimetric channel. The hydrodynamics characteristics was first investigated in the channel, in terms of gas-liquid flow regime, gas hold-up, bubble length and velocity, liquid slug length and interfacial area. The oxygen concentration field inside the liquid slugs was then visualized at different axial positions. The non-symmetrical recirculation zones inside the liq-uid slug were observed to be twisted and split by the periodic bends, and tended to disappear as the bubble moving within the channel; the O2concentration inside the liquid slug became
uni-Fig. 11. (a) Evolution of mass flux of the transferred oxygenuO2per unit of bubble surface as a function of the axial position X under various liquid superficial velocities jLat a
given gas superficial velocity jG= 0.042 m*s"1. (b) Comparison of the evolution of normalized average oxygen concentration in the liquid slug along the channel with the ones
form after passing through several bends (around 20 bends). The occurrence of the ‘‘turning point” (i.e. the big bend enabling the flow direction in 180#) seemed to induce a slowing down of the mass transfer, especially when Re > 300 and Ca > 0.002. The mass flux of O2transferred per unit of bubble surface was significantly
higher close to the gas injection due to the bubble formation stage, then it decreases significantly as the bubble flowing along the meandering channel, and becomes small after X = 0.3 m due to the decreasing driving force for the mass transfer. At last, by cou-pling this local information with a plug-flow model, overall volu-metric mass transfer coefficients could be estimated. All these findings give important information to understand the gas-liquid mass transfer complex mechanism occurring in the meandering channel, which would serve as basis for implementing gas-liquid reaction in HEX reactors.
Acknowledgments
The financial assistance provided by the China Scholarship Council for L. Yang is gratefully acknowledged.
References
Abadie, T., Aubin, J., Legendre, D., Xuereb, C., 2012. Hydrodynamics of gas–liquid Taylor flow in rectangular microchannels. Microfluid. Nanofluid. 12, 355–369.
http://dx.doi.org/10.1007/s10404-011-0880-8.
Anxionnaz, Z., 2009. Etude de l’influence de la géométrie des canaux sur les performances d’un réacteur/échangeur. University of Toulouse.
Anxionnaz, Z., Cabassud, M., Gourdon, C., Tochon, P., 2008. Heat exchanger/reactors (HEX reactors): concepts, technologies: State-of-the-art. Chem. Eng. Process. Process Intensif. 47, 2029–2050.http://dx.doi.org/10.1016/j.cep.2008.06.012. Anxionnaz-Minvielle, Z., Cabassud, M., Gourdon, C., Tochon, P., 2013. Influence of
the meandering channel geometry on the thermo-hydraulic performances of an intensified heat exchanger/reactor. Chem. Eng. Process. Process Intensif. 73, 67– 80.http://dx.doi.org/10.1016/j.cep.2013.06.012.
Bercˇicˇ, G., Pintar, A., 1997. The role of gas bubbles and liquid slug lengths on mass transport in the Taylor flow through capillaries. Chem. Eng. Sci. 52, 3709–3719.
http://dx.doi.org/10.1016/S0009-2509(97)00217-0.
Butler, C., Cid, E., Billet, A.-M., 2016. Modelling of mass transfer in Taylor flow: investigation with the PLIF-I technique. Chem. Eng. Res. Des. 0–18.http://dx. doi.org/10.1016/j.cherd.2016.09.001.
Commenge, J.-M., Falk, L., 2014. Methodological framework for choice of intensified equipment and development of innovative technologies. Chem. Eng. Process. Process Intensif. 84, 109–127.http://dx.doi.org/10.1016/j.cep.2014.03.001. Dai, Z., Fletcher, D.F., Haynes, B.S., 2015a. Influence of tortuous geometry on the
hydrodynamic characteristics of laminar flow in microchannels. Chem. Eng. Technol. 38, 1406–1415.http://dx.doi.org/10.1002/ceat.201400752.
Dai, Z., Fletcher, D.F., Haynes, B.S., 2015b. Impact of tortuous geometry on laminar flow heat transfer in microchannels. Int. J. Heat Mass Transf. 83, 382–398.
http://dx.doi.org/10.1016/j.ijheatmasstransfer.2014.12.019.
Darvas, F., Dorman, G., Hessel, V., 2014. Flow Chemistry. De Gruyter Textbook, Berlin, Boston.
Dessimoz, A.-L., Raspail, P., Berguerand, C., Kiwi-Minsker, L., 2010. Quantitative criteria to define flow patterns in micro-capillaries. Chem. Eng. J. 160, 882–890.
http://dx.doi.org/10.1016/j.cej.2010.01.011.
Dietrich, N., Loubière, K., Jimenez, M., Hébrard, G., Gourdon, C., 2013. A new direct technique for visualizing and measuring gas–liquid mass transfer around bubbles moving in a straight millimetric square channel. Chem. Eng. Sci. 100, 172–182.http://dx.doi.org/10.1016/j.ces.2013.03.041.
Elgue, S., Aillet, T., Loubiere, K., Conté, A., Dechy-Cabaret, O., Prat, L., Horn, C.R., Lobet, O., Vallon, S., 2015. Flow photochemistry: a meso-scale reactor for industrial applications. Chim. Oggi/Chem. Today 33, 58–61.
Fries, D.M., von Rohr, P.R., 2009. Liquid mixing in gas–liquid two-phase flow by meandering microchannels. Chem. Eng. Sci. 64, 1326–1335.http://dx.doi.org/ 10.1016/j.ces.2008.11.019.
Garstecki, P., Fuerstman, M.J., Stone, H.a., Whitesides, G.M., 2006. Formation of droplets and bubbles in a microfluidic T-junction—scaling and mechanism of break-up. Lab Chip 6, 437.http://dx.doi.org/10.1039/b510841a.
Giavedoni, M.D., Saita, F.A., 1999. The rear meniscus of a long bubble steadily displacing a Newtonian liquid in a capillary tube. Phys. Fluids 11, 786.http://dx. doi.org/10.1063/1.869951.
Gourdon, C., Elgue, S., Prat, L., 2015. What are the needs for Process Intensification? Oil Gas Sci. Technol. – Rev. d’IFP Energies Nouv. 70, 463–473.http://dx.doi.org/ 10.2516/ogst/2014051.
Günther, A., Khan, S.a., Thalmann, M., Trachsel, F., Jensen, K.F., 2004. Transport and reaction in microscale segmented gas–liquid flow. Lab Chip 4, 278–286.http:// dx.doi.org/10.1039/B403982C.
Haase, S., Murzin, D.Y., Salmi, T., 2016. Review on hydrodynamics and mass transfer in minichannel wall reactors with gas–liquid Taylor flow. Chem. Eng. Res. Des. 113, 304–329.http://dx.doi.org/10.1016/j.cherd.2016.06.017.
Haghnegahdar, M., Boden, S., Hampel, U., 2016. Mass transfer measurement in a square milli-channel and comparison with results from a circular channel. Int. J. Heat Mass Transf. 101, 251–260. http://dx.doi.org/10.1016/j. ijheatmasstransfer.2016.05.014.
Izquierdo-Guerra, W., García-Reyes, E., 2010. Background division, a suitable technique for moving object detection. In: Iberoamerican Congress on Pattern Recognition. Springer, Berlin, Heidelberg, pp. 121–127. http://dx.doi.org/ 10.1007/978-3-642-16687-7_20.
Karale, C.M., Bhagwat, S.S., Ranade, V.V., 2013. Flow and heat transfer in serpentine channels. AIChE J. 59, 1814–1827.http://dx.doi.org/10.1002/aic.13954. Kherbeche, A., Milnes, J., Jimenez, M., Dietrich, N., Hébrard, G., Lekhlif, B., 2013.
Multi-scale analysis of the influence of physicochemical parameters on the hydrodynamic and gas–liquid mass transfer in gas/liquid/solid reactors. Chem. Eng. Sci. 100, 515–528.http://dx.doi.org/10.1016/j.ces.2013.06.025.
Kuhn, S., Jensen, K.F., 2012. A pH-sensitive laser-induced fluorescence technique to monitor mass transfer in multiphase flows in microfluidic devices. Ind. Eng. Chem. Res. 51, 8999–9006.http://dx.doi.org/10.1021/ie300978n.
Leclerc, A., Philippe, R., Houzelot, V., Schweich, D., de Bellefon, C., 2010. Gas-liquid Taylor flow in square micro-channels: new inlet geometries and interfacial area tuning. Chem. Eng. J. 165, 290–300.http://dx.doi.org/10.1016/j.cej.2010.08.021. Nieves-Remacha, M.J., Kulkarni, A.A., Jensen, K.F., 2013. Gas-liquid flow and mass transfer in an advanced-flow reactor. Ind. Eng. Chem. Res. 52, 8996–9010.
http://dx.doi.org/10.1021/ie4011707.
Pelleter, J., Renaud, F., 2009. Facile, fast and safe process development of nitration and bromination reactions using continuous flow reactors. Org. Process Res. Dev. 13, 698–705.http://dx.doi.org/10.1021/op8002695.
Qian, D., Lawal, A., 2006. Numerical study on gas and liquid slugs for Taylor flow in a T-junction microchannel. Chem. Eng. Sci. 61, 7609–7625.http://dx.doi.org/ 10.1016/j.ces.2006.08.073.
Roudet, M., Loubiere, K., Gourdon, C., Cabassud, M., 2011. Hydrodynamic and mass transfer in inertial gas–liquid flow regimes through straight and meandering millimetric square channels. Chem. Eng. Sci. 66, 2974–2990.http://dx.doi.org/ 10.1016/j.ces.2011.03.045.
Shao, N., Gavriilidis, a., Angeli, P., 2010. Mass transfer during Taylor flow in microchannels with and without chemical reaction. Chem. Eng. J. 160, 873–881.
http://dx.doi.org/10.1016/j.cej.2010.02.049.
Stankiewicz, A.I., Moulijn, J.a., 2000. Process intensification : transforming chemical engineering. Chem. Eng. Prog., 22–34
Théron, F., Anxionnaz-Minvielle, Z., Cabassud, M., Gourdon, C., Tochon, P., 2014. Characterization of the performances of an innovative heat-exchanger/reactor. Chem. Eng. Process. Process Intensif. 82, 30–41. http://dx.doi.org/10.1016/ j.cep.2014.04.005.
Tochon, P., Couturier, R., Anxionnaz, Z., Lomel, S., Runser, H., Picard, F., Colin, A., Gourdon, C., Cabassud, M., Peerhossaini, H., Della Valle, D., Lemenand, T., 2010. Toward a competitive process intensification: a new generation of heat exchanger-reactors. Oil Gas Sci. Technol. – Rev. d’IFP Energies Nouv. 65, 785– 792.http://dx.doi.org/10.2516/ogst/2010020.
Tsoligkas, A.N., Simmons, M.J.H., Wood, J., 2007. Influence of orientation upon the hydrodynamics of gas-liquid flow for square channels in monolith supports. Chem. Eng. Sci. 62, 4365–4378.http://dx.doi.org/10.1016/j.ces.2007.04.051. van Baten, J.M., Krishna, R., 2004. CFD simulations of mass transfer from Taylor
bubbles rising in circular capillaries. Chem. Eng. Sci. 59, 2535–2545.http://dx. doi.org/10.1016/j.ces.2004.03.010.
Dean, W.R., 1928. Fluid motion in a curved channel. Proc. R. Soc. London A Math. Phys. Eng. Sci. 121, 402–420.
Winkler, L.W., 1888. Die Bestimmung des im Wasser gelösten Sauerstoffes. Berichte der Dtsch. Chem. Gesellschaft 21, 2843–2854. http://dx.doi.org/10.1002/ cber.188802102122.
Xiong, R., Chung, J.N., 2007. Flow characteristics of water in straight and serpentine micro-channels with miter bends. Exp. Therm. Fluid Sci. 31, 805–812.http://dx. doi.org/10.1016/j.expthermflusci.2006.08.006.
Yang, L., Dietrich, N., Hébrard, G., Loubière, K., Gourdon, C., 2016a. Optical methods to investigate the enhancement factor of an oxygen-sensitive colorimetric reaction using microreactors. AIChE J.http://dx.doi.org/10.1002/aic.15547. Yang, L., Dietrich, N., Loubière, K., Gourdon, C., Hébrard, G., 2016b. Visualization and
characterization of gas–liquid mass transfer around a Taylor bubble right after the formation stage in microreactors. Chem. Eng. Sci. 143, 364–368.http://dx. doi.org/10.1016/j.ces.2016.01.013.
Yao, C., Dong, Z., Zhao, Y., Chen, G., 2014. An online method to measure mass transfer of slug flow in a microchannel. Chem. Eng. Sci. 112, 15–24.http://dx. doi.org/10.1016/j.ces.2014.03.016.
Zuber, N., Findlay, J.A., 1965. Average volumetric concentration in two-phase flow systems. J. Heat Transf. 87, 453–468.http://dx.doi.org/10.1115/1.3689137.