O
pen
A
rchive
T
OULOUSE
A
rchive
O
uverte (
OATAO
)
OATAO is an open access repository that collects the work of Toulouse researchers and
makes it freely available over the web where possible.
This is an author-deposited version published in :
http://oatao.univ-toulouse.fr/
Eprints ID : 11196
To link to this article :
DOI: 10.1071/WF13029
http://dx.doi.org/10.1071/WF13029
To cite this version : Legendre, Dominique and Becker, Ryan and
Alméras, Elise and Chassagne, Amélie Air tanker drop patterns. (2013)
International Journal of Wildland Fire. ISSN 1049-8001
Any correspondance concerning this service should be sent to the repository
administrator:
[email protected]
Dominique Legendre
, Ryan Becker
, Elise Alme´ras
and Ame´lie Chassagne
AA
Institut de Me´canique des Fluides de Toulouse (IMFT), INPT-CNRS, Universite´ de Toulouse, Alle´e du Professeur Camille Soula, F-31400 Toulouse, France.
B
San Dimas Technology and Development Center (SDTDC) 444 East Bonita Avenue, San Dimas, CA 91773-3198, USA.
C
Corresponding author. Email: [email protected]
Abstract. Ground patterns of liquid aerial drops for combating wildfires are considered. Based on a significant number of drop tests performed using different airplanes and helicopters, a simple model for the length, the width and the coverage distribution is presented. At first order both the length and the width of the drop pattern can be described using simple relations despite the significant difference between the conditions of the drop tests considered. These relations include factors that can be manipulated during aircraft and release system design, as well as during aerial firefighting operations. The liquid on the ground follows a Gaussian distribution that makes possible an original prediction of the maximum coverage level on the pattern centreline confirmed by the experiments. The difference between gravity systems and recent pressurised systems is also discussed. We show a clear difference between gravity systems and pressurised systems. The width is larger for pressurised systems, resulting in a smaller coverage for the same condition of drop.
Additional keywords: modelling.
Introduction
Many different aircraft, such as agricultural spray planes, heli-copters, and modern military and civil transports, have been designed or adapted for firefighting. Most of the drop systems rely on gravity to evacuate the liquid from the aircraft. The tank includes doors at the bottom, and the control of their opening determines the discharge of the liquid (water, retardant or foam). Some systems, such as the Evergreen Supertanker’s 747 or the USDA Forest Service’s Modular Aerial Firefighting System, use pressurised air to expel the liquid through valved nozzles.
The USDA Forest Service’s Aerial Delivery project has developed procedures for conducting drop tests to quantify retardant drop patterns produced by airtanker retardant delivery systems. This drop testing serves as the most accurate means of measuring retardant ground patterns. Drop tests performed for different delivery systems are considered in this note. We first consider the size of the ground pattern and then consider the liquid distribution on the ground. The results are finally used for the prediction of the coverage distribution for given drop parameters.
We show that new simple modelling can be used for the prediction of the liquid distribution on the ground. The validity of this modelling is confirmed in this paper by the comparison with the tests performed by the CEREN in France (Giroud et al. 2002). We also discuss the comparison between the drop patterns obtained using gravity and pressurised systems.
Methods
We consider real-scale drop tests performed by the USDA Forest Service for different delivery systems (see http://www.fs. fed.us/eng/t-d.php, accessed 1 October 2013). Basically, a grid of cups is laid out and the airtanker drops the liquid (water or retardant) over the grid. Cups with liquid are capped and weighed, and the data collected during the weighing process are used to produce ground pattern contour plots and to calculate the coverage area.Suter (2000,2002) describes the procedures for conducting the drop tests. Three examples of drop patterns considered in this study are shown in Fig. 1for the BV-107 helicopter using the 1000-gallon (,3785-L) Griffith helibucket, the CDF S-2T Turbo Tracker and the Evergreen Boeing 747.
Different retardant delivery systems are considered: fixed-wing aircraft with fixed tank (Table 1), Evergreen 747 with pressurised jet system (Table 2), helicopter with fixed tank (Table 3) or helibucket (Table 4). Some tests performed by CEREN in France (Giroud et al. 2002) and reported byAmorim (2011)are also considered. The references for all the data used in this study are given in the tables where the main parameters controlling the drop pattern are also indicated. We note the following:
! V, the volume of the product released; ! QL, the mean flow rate;
! h, the mean height during the drop;
! Ug, the ground velocity, i.e. the relative velocity between the
aircraft and the ground; ! W, the wind velocity;
! Ur¼ Ug– W cos a, the relative velocity between the plane
and the air where a is the wind direction relative to the direction of flight.
The mean liquid velocity at the tank exit is UL¼ QL/S. The
duration T of the drop is linked to the volume released and the flow rate by T5 V/QL. Different fluids have been
used for the tests corresponding to a nearly constant value of the density (rL¼ 1000–1090 kg m
#3
), a moderate range of variation of the surface tension (s¼ 0.04–0.08 N m#1) and a wide range of the dynamic viscosity (mL¼ 10#3–1.6 Pa s#1).
60 30 0 0 30 60 90 120 150 180 210 240 270 60 30 0 0 30 30 60 90 120 120 150 180 210 210 240 270 300 300 x (m) y (m) 390 480 570 660 330 90 45 0
Fig. 1. Examples of drop pattern considered in this study. The direction of flight is from left to right. Top: BV-107 helicopter using the 1000-gallon (,3785-L) Griffith helibucket. Middle: CDF S-2T Turbo Tracker with 1200-gallon (,4542-L) constant-flow tank. Bottom: Evergreen Boeing 747 with 18 000-gallon (,68 137-L) pressurised tank. The vertical lines indicate the position of the transverse profiles used to determine the mean coverage profile.
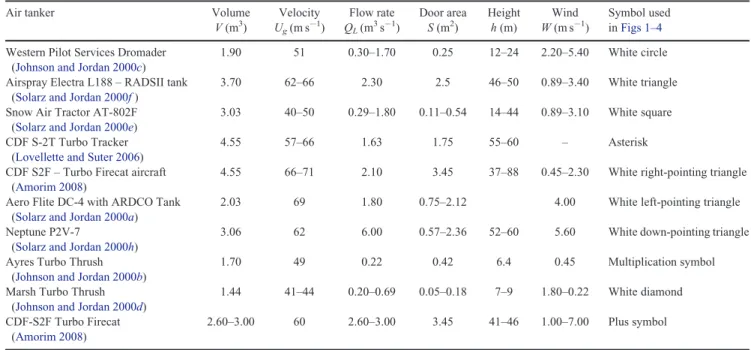
Table 1. Drop test parameters for aircraft using gravity systems
Air tanker Volume
V (m3) Velocity Ug(m s#1) Flow rate QL(m 3 s#1) Door area S (m2) Height h (m) Wind W (m s#1) Symbol used inFigs 1–4
Western Pilot Services Dromader
(Johnson and Jordan 2000c)
1.90 51 0.30–1.70 0.25 12–24 2.20–5.40 White circle
Airspray Electra L188 – RADSII tank
(Solarz and Jordan 2000f)
3.70 62–66 2.30 2.5 46–50 0.89–3.40 White triangle
Snow Air Tractor AT-802F
(Solarz and Jordan 2000e)
3.03 40–50 0.29–1.80 0.11–0.54 14–44 0.89–3.10 White square
CDF S-2T Turbo Tracker
(Lovellette and Suter 2006)
4.55 57–66 1.63 1.75 55–60 – Asterisk
CDF S2F – Turbo Firecat aircraft
(Amorim 2008)
4.55 66–71 2.10 3.45 37–88 0.45–2.30 White right-pointing triangle
Aero Flite DC-4 with ARDCO Tank
(Solarz and Jordan 2000a)
2.03 69 1.80 0.75–2.12 4.00 White left-pointing triangle
Neptune P2V-7
(Solarz and Jordan 2000h)
3.06 62 6.00 0.57–2.36 52–60 5.60 White down-pointing triangle
Ayres Turbo Thrush
(Johnson and Jordan 2000b)
1.70 49 0.22 0.42 6.4 0.45 Multiplication symbol
Marsh Turbo Thrush
(Johnson and Jordan 2000d)
1.44 41–44 0.20–0.69 0.05–0.18 7–9 1.80–0.22 White diamond
CDF-S2F Turbo Firecat
(Amorim 2008)
By varying the fraction of gum added to water, the product viscosity is significantly changed while the density and the surface tension have moderate variation. We use raand mafor
the density and viscosity of the air.
In total we have considered 71 drops corresponding to dropped volume V¼ 0.6–32 m3, averaged flow rates
QL¼ 0.29–6.0 m3s#1, drop velocity Ug¼ 12–71 m s#1, drop
height h¼ 6 #100 m and wind velocity W ¼ 0.22–7.6 m s#1. Results
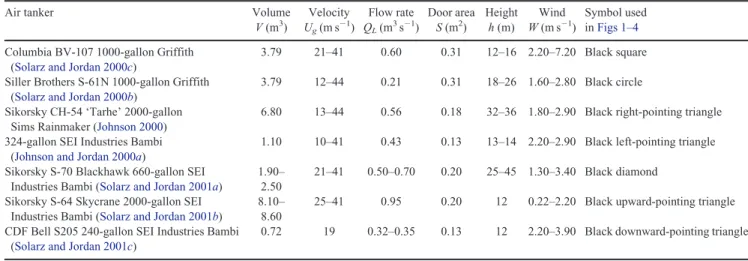
The objective of this note is to focus on the main drop pattern characteristics (Fig. 2). We first consider the size of the drop pattern (length L and width l) and then the liquid coverage on the ground is analysed.
Drop pattern size
The drop pattern size is characterised by the length L and the width l of the coverage level Z0.5¼ 0.5 GPC (gallons per 100
square feet) E 0.2 L m#2. The evolution of the length L and the width l are reported inFig. 3v. the air tanker velocity for the different tests considered. The length and the width vary from 47 to 780 m and 11 to 83 m. Due to the significant difference between the different test conditions, it is clear from the figure that both the length and the width are very dispersed. Thus, no simple evolution seems to emerge from such representation of
Table 3. Drop test parameters for helicopters with a fixed tank
Air tanker Volume
V (m3) Velocity Ug(m s#1) Flow rate QL(m3s#1) Door area S (m2) Height h (m) Wind W (m s#1) Symbol used inFigs 1–4
Erickson Air Crane (S-64 Skycrane)
(Solarz and Jordan 2000g)
7.58 21–35 0.26–5.17 0.11–2.10 54–61 1.6–3.1 Green upward-pointing triangle
LA County Bell S205
(Solarz and Jordan 2000d)
1.21 35 0.33–0.68 0.38–0.75 18–24 3.1–4.9 Green downward-pointing triangle
Table 4. Drop test parameters for helicopters with helibucket
Air tanker Volume
V (m3) Velocity Ug(m s#1) Flow rate QL(m 3 s#1) Door area S (m2) Height h (m) Wind W (m s#1) Symbol used inFigs 1–4
Columbia BV-107 1000-gallon Griffith
(Solarz and Jordan 2000c)
3.79 21–41 0.60 0.31 12–16 2.20–7.20 Black square
Siller Brothers S-61N 1000-gallon Griffith
(Solarz and Jordan 2000b)
3.79 12–44 0.21 0.31 18–26 1.60–2.80 Black circle
Sikorsky CH-54 ‘Tarhe’ 2000-gallon Sims Rainmaker (Johnson 2000)
6.80 13–44 0.56 0.18 32–36 1.80–2.90 Black right-pointing triangle
324-gallon SEI Industries Bambi
(Johnson and Jordan 2000a)
1.10 10–41 0.43 0.13 13–14 2.20–2.90 Black left-pointing triangle
Sikorsky S-70 Blackhawk 660-gallon SEI Industries Bambi (Solarz and Jordan 2001a)
1.90– 2.50
21–41 0.50–0.70 0.20 25–45 1.30–3.40 Black diamond
Sikorsky S-64 Skycrane 2000-gallon SEI Industries Bambi (Solarz and Jordan 2001b)
8.10– 8.60
25–41 0.95 0.20 12 0.22–2.20 Black upward-pointing triangle
CDF Bell S205 240-gallon SEI Industries Bambi
(Solarz and Jordan 2001c)
0.72 19 0.32–0.35 0.13 12 2.20–3.90 Black downward-pointing triangle
Evergreen Boeing 747 (R. Becker, pers. comm., 2009)
14–32 63–71 1.7–5.2 0.13–0.52 60–102 1.2–2.9 White star x η(x, y) λ(x, y) y L λ
Fig. 2. Ground pattern characteristics. L is the length, l is the width and Z is the liquid coverage level.
the results. A similar conclusion is obtained when plotting the results as a function of the other parameters, the relative velocity Ur, the flow rate, the drop height h, etc. The identification of
simple laws is made difficult because, during a drop test, it is difficult to vary only one parameter while keeping the others constant. In fact, historical data from drop tests include almost no data with single-parameter variations, despite the large number of drops performed.
This problem is characterised by a great number of indepen-dent parameters. The volume of liquid released by the airtanker is subjected to a very complex process of primary and secondary atomisation mechanisms induced by the Kelvin–Helmholtz
and the Rayleigh–Taylor instabilities. This results in a popula-tion of droplets of different sizes that are dispersed to form the cloud. During their fall, the droplets can break, coalesce or evaporate in the air.
A dimensional analysis and a detailed inspection of the results have permitted determination of the main parameters that control the drop pattern. The length L is shown to evolve as L$ UgTþ f1l ð1Þ
where UgT is the distance travelled by the aircraft during the
drop phase. We observe that L is larger than UgT because of
0 10 20 30 40 50 60 70 80 0 100 200 300 400 500 600 700 800 (a) Ug (m s21) L (m) 0 10 20 30 40 50 60 70 80 0 10 20 30 40 50 60 70 80 90 λ (m) (b)
Fig. 3. Evolution of (a) the length L and (b) the width l v. the ground velocity Ug. Symbols are given inTables 1–4.
102 102 103 103 UgT ! 2λ L 102 103 (a) 102 103 (b)
Fig. 4. Evolution of the drop pattern length L as a function of UgTþ 2l, where Ugis the ground velocity, T is the drop duration and l is the pattern width.
liquid dispersion in the direction of the drop. The longitudinal dispersion has been correlated with the transverse dispersion by the function f1. A good fit of the results is obtained for f1¼ 2
indicating a non-isotropic dispersion as observed inFig. 1. L is reported inFig. 4av. UgTþ 2l for ‘light air’ wind condition on
the Beaufort wind scale (W# 1.5 m s#1). All the wind condi-tions (up to W¼ 7.6 m s#1) are reported inFig. 4b. We observe
that all the cases follow the general trend given byEqn 1but a noticeable dispersion for larger wind conditions (up to 7 m s#1) around the diagonal is shown. As expected, the wind is an important parameter responsible for the dispersion of the drop length around the general trend obtained when the wind is
supposed to have no effect. We have also checked some possible dependency of the dispersion function f1v. the wind velocity or
other parameters, but no simple evolution was found. In partic-ular the tests performed with the LA County Bell S205 with a fixed tank and the CDF Bell S205 with 240-gallon (,904-L) SEI Industries Bambi show a significant deviation from the general linear trend. It could be an effect of the downwash induced by the rotor for this type of helicopter; this point will be discussed in the following. In fact, it is not possible to find a clear explanation because these tests were performed with a signifi-cant wind: 7 and 11 m s#1 for the fixed tank and 5, 7.8 and 8.8 m s#1for the 240-gallon SEI Industries Bambi. In addition,
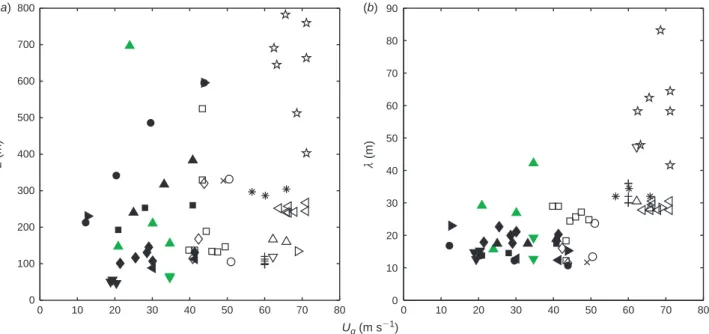
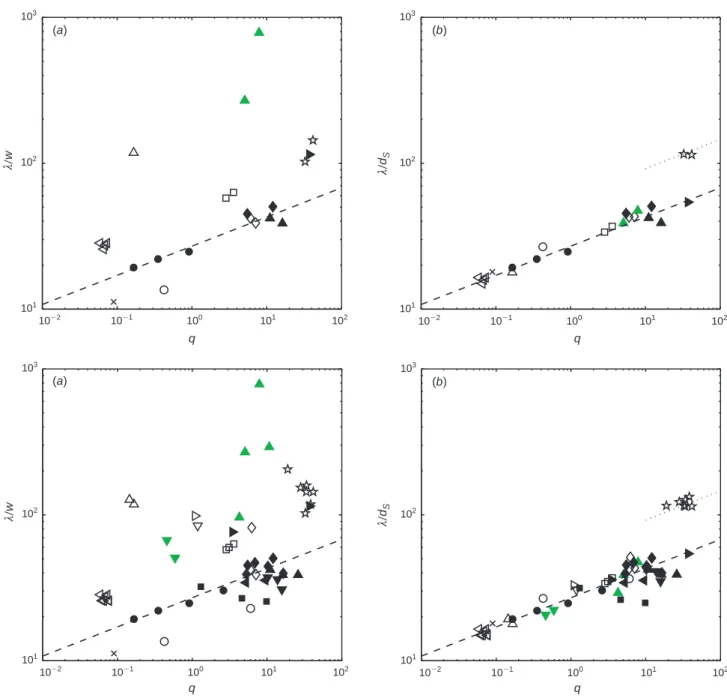
102 101 102 1022 1021 100 101 102 101 102 1022 1021 100 101 λ / w λ / dS 102 101 102 1022 1021 100 101 103 102 101 102 1022 1021 100 101 103 q q q q λ / w λ / dS (a) (b)
Fig. 5. Evolution of the drop pattern width l as a function of the momentum ratio q¼ rLUL2/raUr2. l is normalised using (a) the door width w and (b) the
characteristic length dS. Top graphs: ‘light air’ wind conditions. Bottom graphs: all the wind conditions. Symbols are given inTables 1–4.Eqn 2denoted by
for these systems the released volume is small relative to other volumes considered in the study (1.2 and 0.72 m3respectively) resulting in small lengths for the pattern, certainly more sensi-tive to high wind conditions.
The width is found to be mainly controlled by the momentum ratio q¼ rLUL2/raUr2, which is consistent with the great number
of experimental studies devoted to jet atomisation in cross flow (Oda et al. 1994;Inamura and Nagai 1997;Wu et al. 1998). Such studies have been conducted for injectors of smaller size, many of which consider fuel jets and mixing of liquid propellants in the combustion process. The spray width normalised by the injector diameter is found to evolve as qB, with B E 0.17 – 0.18. Despite a size of two or three orders of magnitude larger for liquid drop from air tankers, the momentum ratio q is also found to be the relevant parameter to describe the liquid atomisation and dispersion. The non-dimensional analysis of the results has also permitted us to determine the relevant length scale for the representation of the results. Indeed there are different exit shapes (circular or rectangular) with a large range of aspect ratios. The width and length of the door have been tested. As clearly shown inFig. 5, the appropriate length scale that makes possible a unique description of the results is the length dS¼ S1/2
based on the exit area S. Finally, the width l can be simply expressed as
l$ dSf2q1=5 ð2Þ
The values f2¼ 27 and f2¼ 58 correctly reproduces the width
evolution for the conventional gravity and the jet pressurised systems respectively. The agreement is very good for ‘light air’ wind conditions (W# 1.5 m s#1) as shown inFig. 5a. Despite a noticeable dispersion of the data for larger wind velocity
(Fig. 5b),Eqn 2gives a very simple expression to describe the evolution of the width of the drop pattern. Note that the pressurised system used by the Evergreen Boeing 747 generates larger pattern width ( f2¼ 58) because this delivery system is
more efficient for the atomisation and the dispersion of the released liquid than the gravity systems. Note that we observe the same trend for the helicopters and the aircrafts, showing that the downwash induced by the rotor does not have a dominant effect on the liquid dispersion. The lateral expansion of this highly turbulent airflow could control the lateral dispersion of the liquid, but no noticeable evidence of this effect is shown in our analysis.
As shown by theFigs 4and5, theEqns 1and2are confirmed by the tests performed by the CEREN in France (Giroud et al. 2002). This additional comparison is of great interest because it confirms the validity of the modelling with real tests performed following a similar procedure (the cup and grid method) but by a different centre.
Liquid coverage
The objective is now to describe the liquid coverage on the ground. For this purpose, the transverse profile of the coverage level is considered. We note Z(x, y) the local height of the liquid in the pattern where y is the transverse direction relative to the centre of the pattern and x is the direction along the centreline. We have considered drop patterns characterised by good line length production as shown inFig. 1for three very different delivery systems, namely the Evergreen Boeing 747 using pressurised jets, the helicopter Columbia BV-107 using the 1000-gallon Griffith helibucket and the CDF S-2T Turbo Tracker using a fixed tank. The positions of the profile used for the calculation of the mean profile !Z are shown inFig. 1.
Fig. 6reports the mean liquid coverage level !Z expressed in the GPC units (1 GPC E 0.407 L m#2) corresponding to the pat-terns shown inFig. 1. !Z is reported as a function of y. As shown in Fig. 6, the mean liquid distribution follows a Gaussian distribution of the form:
!
ZðyÞ ¼ Zmax exp½#y2=2l
02) ð3Þ
where Zmaxis the maximum coverage level obtained along the
centreline and l0is by definition the standard deviation. l0is
linked to the full width at half maximum L by the relation L ¼ (2 Ln(2))1/2l0. The comparison betweenL and the width
l reveal that in a first approximation we can consider that l E 2L so that the standard deviation (l0) is related to the width
(l) (defined for Z¼ 0.5 GPC) by
l$ 2ð2 lnð2ÞÞ1=2l0 ð4Þ
Such liquid distribution has been confirmed by considering other patterns obtained for different drop conditions.
Discussion
The previous sections show that simple relations can describe at first order the evolution of the length (L) and the width (l) of drop patterns. Thus, some parameters of importance, namely the drop height (h) and the liquid viscosity (mL), appear not to
have a direct effect on the pattern size. Indeed, despite a large
0 20 40 60 80 100 120 0 1 2 3 4 5 6 η (GPC) y (m)
Fig. 6. Evolution of the mean coverage !Z as a function of the transverse distance y relative to centre of the pattern. Each curve displays the widths of a single drop. White star and black star, Evergreen Boeing 747; black circle, CDF S-2T Turbo Tracker; black square, BV-107 using the 1000-gallon (,3785-L) Griffith helibucket. The filled symbols correspond to the three patterns shown inFig. 1.Eqn 3denoted by the solid line was plotted with different values for the maximum coverage Zmaxand the standard deviation
l0: white star (Zmax¼ 6, l0¼ 110); black star (Zmax¼ 4.5, l0¼ 79); black
range of variation in the drops considered, h¼ 6–102 m and mL¼ 10#3–1.6 Pa s#1, these two parameters are not found to
control at first order the drop shape.
The drop height (h) can have a significant effect if the delivered liquid is not completely atomised and dispersed. In such a situation, the impact of a large volume of liquid with the ground can result in possible damage of vegetation and equip-ment, or injury to ground personnel. Because all the tests have been realised above such critical height, no significant effect of h is observed. When increasing h, the time for droplet dispersion and evaporation is increased so that the quantity of liquid impacting with the ground is reduced but the size of the ground pattern is not significantly affected.
The viscosity and other rheological properties of the liquid are known to affect the droplet size distribution, the terminal velocity for small droplets, the droplet impact on the substrate and the coverage of the impacted substrate (Andersen et al. 1974;Andersen and Wong 1978). When viscosity is reduced, the proportion of smaller droplets is increased and the propor-tion of droplets subjected to evaporapropor-tion, dispersion and capture in the wake is increased. Consequently, the viscosity and the height have a major effect on the droplet diameter distribution at impact with the ground. The coverage level distribution is thus changed but the size of the drop pattern (corresponding in this note to 0.5 GPC) does not seem to be significantly affected. Indeed the mechanisms responsible for the hydrodynamic dispersion of the liquid are not directly changed because the relevant parameter for the dispersion is the momentum ratio q. The fraction (F) of the drop liquid that effectively contri-butes to the pattern can be determined from the quantity of liquid collected in the cups regularly distributed on the ground (Suter 2002,2000). For the tests considered here,F varies from 55 to 100%, showing that a significant part of the liquid is lost because of plane wake capture, wind dispersion or evaporation. No clear evolution has been found for the description ofF. The
2004). Additionally, the measurements of F are affected by factors such as atmospheric humidity at the time of the drop and the length of time required to seal the sample cups after retardant deposition. These factors are known to influenceF, but are not recorded during drop testing.
Using the results obtained in the previous section, it is now possible to determine the maximum coverage level on the pattern centreline. The volume Vgof the liquid recovered is
Vg¼ Z Zðx; yÞdx dy ¼ ðL # 2lÞ Z ! ZðyÞdy ð5Þ where !Z is the mean coverage and L – 2l ¼ UgT corresponds to
the pattern length where the coverage profile can be considered as uniform. As explained above the correction f1l¼ 2l
expresses the longitudinal dispersion of the liquid. By integra-tion ofEqn 3one obtains the recovered volume as:
Vg$ 1 4 ffiffiffiffiffiffiffiffiffiffiffiffip Lnð2Þ r ðL # 2lÞlZmax ð6Þ
FromEqn 6it is possible to express the maximum coverage level on the pattern centreline as
Zmax$ 4 ffiffiffiffiffiffiffiffiffiffiffiffi Lnð2Þ p r FV ðL # 2lÞl ð7Þ
The predicted value of Zmaxis reported inFig. 7for the tests
performed using the three selected airtankers. Filled symbols are used for the maximum coverage level showing a continuous line. Empty symbols are used for the first coverage level showing non-regular repartition. It is clear from the figure that the prediction given byEqn 7is inside the marker distribution and makes possible the description of the transition between continuous lines and a non-regular repartition. The lines obtained using the Skycrane S64 (Solarz and Jordan 2000g) are also reported because these drop tests provide very different patterns: very long lines with a maximum coverage level ,2 GPC or very short lines with a coverage level above 10 GPC. The agreement is also very good showing that Eqn 7
combined withEqns 1and2make possible the prediction of the main characteristics of a drop pattern, namely its length, its width and its maximum continuous coverage level.
Such information is of great interest for the analysis of real-scale tests because it reveals the main factors controlling the different parameters of a drop. This model may also be used to inform the design of new delivery systems (to make a predictive description of the expected performance) or the optimisation of an existing delivery system (by quantifying the expected changes in pattern characteristics from changes in factors such as aircraft flight speed or orientation to the prevailing wind, which the aircraft pilot can control before making a drop). An example is shown inFig. 8. Based on the coverage distribution (Eqn 3) combined with the length (Eqn 1), the width (Eqn 2), the
0 1 2 3 4 5 6 7 0 2 4 6 8 Level (GPC) ΦV/(L 2 2λ)λ (GPC)
Fig. 7. Transition between the larger coverage level showing a continuous line (black symbols) and the smaller coverage level with a non-regular distribution (white symbols). Stars, Evergreen Boeing 747; circles, CDF S-2T Turbo Tracker, squares, BV-107 using the 1000-gallon (,3785-L) Griffith helibucket, trianges, Skycrane S64.Eqn 7is denoted by the solid line.
standard deviation (Eqn 4) and the maximum coverage (Eqn 7),
Fig. 8reports the coverage level distribution prediction corre-sponding to the Evergreen Boeing 747 test shown inFig. 1. As shown in the figure, the model is able to reproduce the distribu-tion for the good lines. Obviously, it is not possible to describe the spot of coverage larger than the predicted last good line, because they are the direct consequence of instabilities not included in the modelling.
Such modelling can also provide the width and the coverage area corresponding to a selected level. Table 5 reports the predicted width and the coverage area corresponding to the prediction shown inFig. 8. The selected coverage is 0.5, 2 and 4 GPC respectively.
Conclusion
Despite a wide range of drop conditions and drop systems, we show that simple equations can describe at first order the evolution of the main characteristics of drop patterns. These relations initially obtained from an analysis of the drop tests performed by the USDA Forest Service are confirmed by tests performed by the CEREN in France (Giroud et al. 2002).
Under ‘light air’ wind condition (W# 1.5 m s#1), the evolu-tion of the length and width can be described usingEqns 1and2. The length is mainly controlled by the distance UgT travelled by
the aircraft during the drop. This distance needs to be corrected by an additional contribution ,2l attributed to an anisotropic dispersion of the liquid. The normalised width is clearly con-trolled at first order by the momentum ratio q and follows a simple power law proportional to q1/5. For a given momentum ratio, the normalised width obtained using pressurised jets is found to be twice the width obtained using conventional gravity systems. The atomisation and the dispersion are thus more efficient using such systems, resulting in a more uniform coverage distribution but a lower maximum coverage level for equivalent drop conditions. The liquid coverage has been characterised by considering the transverse profile showing a
Gaussian distribution of the liquid. From this distribution, the maximum coverage on the pattern centreline can be deduced. Such expression makes possible the determination of the opti-mal drop parameters to obtain the required coverage.
Furthermore, the factors controlling the length and width at first order include the opening area of the door that expels the liquid from the aircraft, the exit velocity of the liquid, and the relative velocity of the liquid as it enters the air. These factors are determined by the design of the aircraft and drop system, and the simple relations presented could allow aircraft and drop system design to maximise desirable pattern characteristics.
Future development could include: (1) additional analysis of the variability ofF, the fraction of liquid that contributes to the pattern; (2) analysis of additional drop data to determine if the functions f1 and f2are not constant throughout the range
of conditions that have been measured; and (3) development of practical guidelines for system design and operation that describe the optimal configurations for achieving specific char-acteristics, as well as the predicted effect on these characteristics for deviation from the optimal configurations.
Acknowledgements
D. Legendre thanks Alain Fontaine, EADS-Airbus, for having motivated his interest on this topic.
References
Amorim JH (2008) Numerical modelling of the aerial drop of products for forest firefighting. PhD thesis, University of Aveiro, Portugal. Amorim JH (2011) Numerical modelling of the aerial drop of firefighting
agents by fixed-wing aircraft. Part II: model validation. International
Journal of Wildland Fire 20, 394–406. doi:10.1071/WF09123
Andersen WH, Wong JY (1978) Dynamic interaction of fire retardant droplets with fuel, and correlation with the rheological properties of the retardant. USDA Forest Service, Northern Forest Fire Laboratory, Final Report 7660–02. (Ogden, UT)
Andersen WH, Brown RE, Kato KG, Louie NA (1974) Investigation of rheological properties of aerial-delivered fire retardant. USDA Forest Service, Northern Forest Fire Laboratory, Final report 8990–05. (Ogden, UT)
Giroud F, Picard C, Arvieu P, Oegema P (2002) An optimum use of retardant during the aerial fire fighting. In ‘Proceedings of the IV International Conference on Forest Fire Research’, 18–23 November 2002, Luso, Portugal. (Ed, DX Viegas) (CD-ROM) (Millpress: Rotterdam) Inamura T, Nagai N (1997) Spray characteristics of liquid jet traversing
subsonic airstreams. Journal of Propulsion and Power 13(2), 250–256.
doi:10.2514/2.5156 0 100 200 300 400 500 600 700 250 0 50 100 x (m) y (m) Direction of flight Max. coverage: 4.1 GPC Mean coverage: 2.2 GPC
Fig. 8. Model prediction of the coverage distribution for the Evergreen Boeing 747 test shown inFig. 1. The levels are from outside to inside 0.5, 1, 2, 3 and 4 GPC.
Table 5. Width of the pattern and corresponding covered area pre-dicted by the model surface for the Evergreen Boeing 747 test shown in
Fig. 1 Coverage .0.5 GPC .2 GPC .4 GPC Width (m) 62.2 36.3 6.57 Pattern area (m2) 3.5* 104 2.0* 104 3.7* 103
industries Bambi 324-gallon helibucket. USDA Forest Service, Missoula Technology and Development Center, Technical Report 0057–2802-MTDC. (Missoula, MT)
Johnson G, Jordan C (2000b) Ground pattern performance of the Ayres Turbo Thrush with standard fire door. USDA Forest Service, Missoula Technology and Development Center, Technical Report 0057–2836-MTDC. (Missoula, MT)
Johnson G, Jordan C (2000c) Ground pattern performance of the Western Pilot Services Dromader. USDA Forest Service, Missoula Technology and Development Center, Technical Report 0057–2834-MTDC. (Missoula, MT)
Johnson G, Jordan C (2000d ) Ground pattern performance of the Marsh Turbo Thrush. USDA Forest Service, Missoula Technology and Devel-opment Center, Technical Report 0057–2835-MTDC. (Missoula, MT) Lovellette G, Suter A (2006) Ground pattern performance of the CDF S-2T
turbo tracker airtanker, USDA Forest Service, Missoula Technology and Development Center, Technical Report 0657–2848-MTDC. (Missoula, MT)
Oda T, Oda H, Arai M, Nishida K (1994) Characterization of liquid jet atomization across a high-speed airstream. JSME International Journal
B 37(4), 937–944. doi:10.1299/JSMEB.37.937
Rimbert N, Sero-Guillaume O (2004) Log-stable laws as asymptotic solutions to a fragmentation equation: application to the distribution of droplets in a high Weber-number spray. Physical Review E: Statistical,
Nonlinear, and Soft Matter Physics 69, 056316. doi:10.1103/ PHYSREVE.69.056316
Solarz P, Jordan C (2000a) Ground pattern performance of the Aero Flite DC4 airtanker with modified Ardco conventional tank. USDA Forest Service, Missoula Technology and Development Center, Technical Report 0057–2867-MTDC. (Missoula, MT)
Solarz P, Jordan C (2000b) Ground pattern performance of the Siller Brothers S-61N helicopter using the 1000-gallon Griffith big dipperb-helibucket. USDA Forest Service, Missoula Technology and Develop-ment Center, Technical Report 0057–2864-MTDC. (Missoula, MT) Solarz P, Jordan C (2000c) Ground pattern performance of the Columbia
BV-107 helicopter using the 1000-gallon Griffith Big Dipper helibucket. USDA Forest Service, Missoula Technology and Development Center, Technical Report 0057–2865-MTDC. (Missoula, MT)
Tractor with constant flow tank. USDA Forest Service, Missoula Technology and Development Center, Technical Report 0057–2852-MTDC. (Missoula, MT)
Solarz P, Jordan C (2000f ) Ground pattern performance of the Airspray Electra L-188 with Aero Union constant flow tank. USDA Forest Service, Missoula Technology and Development Center, Technical Report 0057–2851-MTDC. (Missoula, MT)
Solarz P, Jordan C (2000g) Ground pattern performance of the Erickson Air Crane. USDA Forest Service, Missoula Technology and Development Center, Technical Report 0057–2850-MTDC. (Missoula, MT) Solarz P, Jordan C (2000h) Ground pattern performance of the Neptune
P2V–7 airtanker. USDA Forest Service, Missoula Technology and Deve-lopment Center, Technical Report 0057–2848-MTDC. (Missoula, MT) Solarz P, Jordan C (2001a) Ground pattern performance of the National
Guard Black Hawk helicopter with the 660-gallon SEI Industries Bambi helibucket. USDA Forest Service, Missoula Technology and Develop-ment Center, Technical Report 0157–2804-MTDC. (Missoula, MT) Solarz P, Jordan C (2001b) Ground pattern performance of the Siller
Brothers S64 helicopter with the 2000-gallon SEI Industries Bambi helibucket. USDA Forest Service, Missoula Technology and Develop-ment Center, Technical Report 0157–2806-MTDC. (Missoula, MT) Solarz P, Jordan C (2001c) Ground pattern performance of the California
Department of Forestry Bell S205 and National Guard UH-1 helicopters with the 240-gallon SEI Industries Bambi helibucket. USDA Forest Service, Missoula Technology and Development Center, Technical Report 0157–2807- MTDC. (Missoula, MT)
Suter A (2000) Drop testing airtankers: a discussion of the cup-and-grid method. USDA Forest Service, Missoula Technology and Development Center, Technical Report 0057–2868-MTDC. (Missoula, MT) Suter A (2002) Estimating methods, variability, and sampling for drop-test
data. USDA Forest Service, Missoula Technology and Development Center, Technical Report 0257–2826-MTDC. (Missoula, MT) Wu PK, Fuller R, Nejad AS (1998) Spray structures of liquid jets atomized
in subsonic crossflows. Journal of Propulsion and Power 14(2), 173–182. doi:10.2514/2.5283