HAL Id: hal-01007916
https://hal.archives-ouvertes.fr/hal-01007916
Submitted on 23 Nov 2018HAL is a multi-disciplinary open access archive for the deposit and dissemination of sci-entific research documents, whether they are pub-lished or not. The documents may come from teaching and research institutions in France or abroad, or from public or private research centers.
L’archive ouverte pluridisciplinaire HAL, est destinée au dépôt et à la diffusion de documents scientifiques de niveau recherche, publiés ou non, émanant des établissements d’enseignement et de recherche français ou étrangers, des laboratoires publics ou privés.
Assessment of uncertain soil properties for complex
infrastructures from monitoring
Franck Schoefs, Katheirne Le, Francesca Lanata
To cite this version:
Franck Schoefs, Katheirne Le, Francesca Lanata. Assessment of uncertain soil properties for complex infrastructures from monitoring. International Conference Durable Structures: from construction to rehabilitation, ICDS12, May 2012, Lisboa, Portugal. �hal-01007916�
1
ASSESSMENT OF UNCERTAIN SOIL PROPERTIES FOR
COMPLEX INFRASTRUCTURES FROM MONITORING
Schoefs F. a, Le K.T. a, Lanata F. b a
LUNAM Université, Université de Nantes, Institute for Research in Civil and Mechanical Engineering, CNRS UMR 6183/FR 3473, Nantes, France; b Ecole
Supérieure du bois, France
ABSTRACT
Since several decades, quite a lot of structures have been monitored to analyze their displacement during the works or during the service-life. This paper presents a methodology for identifying soil characteristics from data structural health monitoring, applying for to a wharf with instrumented tie-rods. Loading and soil parameters are modelled as random variables. The modelling is performed though a meta-model fitted on a numerical database obtained from direct simulations on a complex finite element model under PLAXIS software: a quadratic Response Surface Model (QRS) is considered.
KEYWORDS: NDT, stochastic field, random properties, capacitive method, chloride ingress.
1
INTRODUCTION
In the context of maintenance and reassessment of existing civil engineering structures, improvement of the in-service behaviour requires disposing of a wide range of technical and methodological tools. Among these tools we can mention on the one hand, the data collection, concerning a feedback, and on the other hand, modelling of progressive phenomena such as fatigue and corrosion. Systematic predictive maintenance programs are not easy to implement in a whole system of infrastructures due to heterogeneity of building ages and building techniques. This is the case of structures in coastal area. The survey of structures (displacement) gives additional information but the updating of the modelling is a great challenge when a lot of influencing factors are involved. Thus, intrusive structural monitoring of complex structures is actually the only way on the one hand, for reaching as close as possible their real in-service behaviour, influenced by building conditions and
settlements that are expected to separate the present behaviour from the theoretical one and on the other hand to understand complex interaction mechanisms, as soil-structure interaction for example.
Due to the randomness of building (concrete, embankment) and natural properties of material (soil), probabilistic methods are more and more considered. They offer the theoretical framework to deal with uncertainties involved in structural assessment of Civil Engineering structures in view to perform sensitivity analysis or reliability assessment.
In this paper we focus on the characterization of powdery embankment physical and mechanical properties for soil pressure quantification from the monitoring of tie-rods in a wharf.
2
DESCRIPTION
AND
INSTRUMENTATION
OF
THE
STRUCTURE, THE AVAILABLE DATA
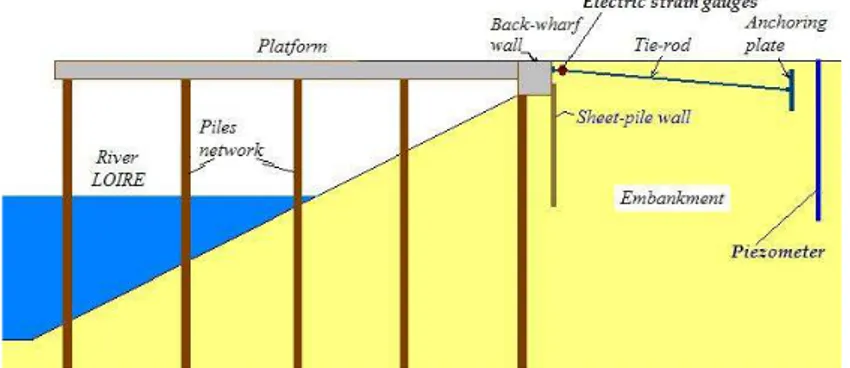
2.1 DESCRIPTION OF THE STRUCTUREThe studied structure is the extension of the timber terminal of Cheviré, the station 4, named Cheviré-4 wharf. The Cheviré-4 wharf is located downstream of the Cheviré bridge near Nantes city (west of France), in a river environment. A sketch of a typical cross section and main components is presented on Fig. 1.
Fig. 1 Cross section of the wharf.
Instrumentation strategy aims following the global behaviour of the wharf during at least 5 years after building with a view to improve prediction models. These validated models will allow basing the maintenance policy on a better understanding of the in-service behaviour.
3
The objective being the understanding of the wharf behaviour under horizontal loading − actions of the embankment, ship berthing and wind action on the cranes, we chose to monitor the tie-rods, which are sensitive elements of the wharf that are not accessible after the building period. The wharf has been instrumented on twelve tie-rods (regularly distributed along the length of the wharf, (see [1] for detail) in order to follow the normal load in the rods cross-section.
2.2 AVAILABLE DATA
Measured loads in the tie-rods come from a two years monitoring period (from January 2004 to October 2005) and have been analyzed in [1]. Two types of variations characterize the loads in the tie-rods:
- temporal: medium-term variations (monthly) and short-term variations (daily: tide with a period of about 12 h);
- spatial: variations of the load in each spatially distributed tie-rod.
The analysis of the spatial load variations shows an important scatter from a tie-rod to another. These variations have been analyzed in [1]. Yáñez-Godoy et al. have shown that when considering the variation of this loading during a tide, it is much more stable from a tie-rod to another one and in time. This paper focuses on this behaviour.
2.3 MAIN ASSUMPTIONS FOR PROBABILISTIC MODELLING FROM SPATIAL PROFILE AND TIME-SERIES
Since a decade, investigations of structural behaviour through Non Destructive Testing or Monitoring have underlined the need for methods of data processing and structural computation. We classify the obtained time-series in three categories:
- time-series describing the evolution of an ageing phenomena like chloride ingress in concrete, crack propagation,
- time-series measuring the strain affected by non-periodic loading like wind and truck loading,
- time-series measuring the strain due to cyclic loading like temperature, tide or waves.
This paper focuses on data obtained from the two last categories during the training period that means before any ageing mechanism occurs. Moreover, when similar components placed at a given location xi are monitored (beams [2] or tie-rods [1]), and subjected to the same loading, a statistical study of their loading LT(xi, t, θj ) can be performed, where t denotes the time and θj the event that represents mainly the hazard during building
works and composition of the material around; θj is a realization of the hazard θ,
θ
∈ Ω, the probabilistic space that gather all the hazard that generates events, thus realization of random variables (material properties, tide level, …). Is has been proved [3] that assuming some properties with an abuse of notation, that LT(xi, t, θj ) can be replaced by LT(θk ).It has been shown that there is a strong relationship between the loading and the difference of water levels, especially for high CMAR coefficients (see [3] for the definition). In this paper, we aim to provide a probabilistic model of soil properties for reliability analysis of wharf during storms [4]. These extreme events occur mainly in winter when CMAR are higher: we analyze only the horizontal wharf behaviour for these conditions.
3
NUMERICAL
MODELLING
AND
META-MODEL
ASSESSMENT
3.1 NUMERICAL STRATEGY
Numerical models must be integrated in the future in an optimization procedure in view to identify the soil characteristics. Computation time should be reduced as low as possible due to the necessary huge number of calls to the model for optimization procedures. Thus we suggest to develop a complete two-dimensional Finite Element Model (FEM) under the Plaxis environment and to find the best meta-model M(X(θj))–with X(θj) input random variables- to represent this numerical behavior. Several meta-models have been developed for deterministic or probabilistic analysis of wharves during these two last decades: neuronal and Bayesian networks, spectral stochastic finite element models based on regression or projection methods [4], polynomial or other response surfaces. We decide here to select quadratic polynomial response surfaces due to their asymptotic properties.
3.2 FINITE ELEMENT MODEL
The problem is modeled through a PLAXIS finite element model by considering all the work phases. We use a 2-D model to represent a standard cross section, not affected by the ends and consistent with the assumptions in 2.4. Geometry modelled under PLAXIS environment by the FE model see [3] and the main characteristics of the mechanical model can see [3], for details.
5
3.3 META MODEL: QUADRATIC RESPONSE SURFACES
We focus here on the second one and more especially on the polynomial models of order less than 3 with or without interaction terms, called Quadratic Response Surfaces (QRS) and developed in several fields [5]. This form has specific properties especially an asymptotic behaviour for the transfer of distribution tails that fits the physical meaning. It is essential when only few experiments are available to ensure a realistic transfer of distribution tails [5].
The general form of the full QRS is the following (1):
∑
∑
+
∑
+
+
=
≠ i i ii j j i i ij i i SR , Tb
b
X
b
X
X
b
X
L
0 2 (1)where LT,SR is the load in the tie-rod, Xi is the ith random variable and the bk values are determined by regression method from a numerical experimental plan based both on the probabilistic distribution of the variables (distribution of numerical values) and their potential influence on the response (number of numerical values –i.e. size of the sample- for each variable).
4
RANDOM VARIABLES AND PROBABILISTIC MODELING
4.1 NUMERICAL EXPERIMENTAL DESIGN
For identifying values of coefficients bk in (1), we fit a QRS on a numerical database with a probabilistic sense: that means that samples are generated from a probability density function for each variable. Basic random variables selected herein are: γsat and γunsat respectively saturated and unsaturated own-weight of the embankment, E and ν its respective Young and Poisson modulus and φ its internal frictional angle. Cohesion c is neglected. Note that the structure is analysed in the first two years when no exploitation by ships occurred. The range of variation for each variable is selected from literature or preliminary knowledge. Available published data for sand and embankment see in [6], for detail. The selected basic variables are:
Own weight (kN/m3) γsat and γsat, Young modulus E (Mpa), Frictional internal angle φ (°), Poisson modulus ν (-), High tide level Hmax, Low tide level Hmin. Cohesion c (kPa) is considered as deterministic. Their distribution, parameters (range if bounded) of the distributions and selected values for experimental design are available in [6]. A deterministic functional relationship is used between unsaturated γunsat and saturated γsat own weight of the embankment to reduce the number of independent variables:
γsat = γunsat + 2. Concerning the tide-river level and the corresponding level of water in the embankment, we consider a tide with a high and frequent CMAR of 70. In the two years database, a CMAR of 69 has been observed: the 2nd of March 2005 with a high level Hmax = 6.21m and a low level Hmin = 2.19m from the 0 level of the sea along the French coasts. We choose to discretize the tide-river lever in six phases between these values to get a good representation of potential situations during this type of tide.
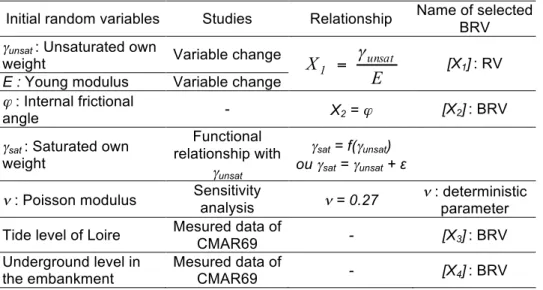
4.2 SELECTION OF RANDOM VARIABLES AND QRS CALIBRATION With the 6 random variables presented upon, 28 coefficients should be calibrated to fit a full QRS. That leads to a huger database. We use the first numerical database described above to highlight the most influent Basic Random Variables (BRV) and to reduce their number. All the results are available in [6]. We recognize that 1/E and γunsat act in very similar way in the response; ν has no influence in the response. From the 6 random variables, four random variables are finally selected that leads to the calibration of 15 coefficients for a full QRS. Table 1 gathers the results and the selected BRV.
Table 1 Selection of input random for the calibration for QRS.
Initial random variables Studies Relationship Name of selected BRV
γunsat : Unsaturated own
weight Variable change
E
X
unsat1
γ
=
[X1]: RVE : Young modulus Variable change
ϕ : Internal frictional
angle - X2 = ϕ [X2]: BRV γsat : Saturated own
weight Functional relationship with γunsat γsat = f(γunsat) ou γsat = γunsat + ε ν : Poisson modulus Sensitivity
analysis ν = 0.27
ν : deterministic
parameter Tide level of Loire Mesured data of
CMAR69 - [X3]: BRV Underground level in
the embankment
Mesured data of
CMAR69 - [X4]: BRV
The QRS calibration described in (1) is carried out based on the numeral database obtained from the calculations of Plaxis. Loading simulations in the tie-rod, from Plaxis model and the QRS, show that the full quadratic response surface gives the best fitting [1].
7
5
RESULT FOR FRICTIONNAL ANGLE IDENTIFICATION
We use a zero-order method (simplex) based on the least square method for the identification of theses quantities for each tie-rod.
The objective function Ferr(θ) of identification method is written as the following (2) :
(
)
(
)
∑
∑
∑
=
−
=
=
i i i i sr i mes i err err(
)
F
(
)
F
f
(
F
,
)
r
(
)
F
i i iθ
θ
θ
θ
2 2 2 (2) where i errF
, denotes the deviation between measured loadings ith ( imes
F
)and the corresponding loading calculated by the numerical model of QRS (
i
sr
F
); ri(θ), denotes the deviation between measured loadings ith ( imes
F
)and the corresponding prediction f(Fsri,θ) by model of QRS; θ is unknown variables that are identified.
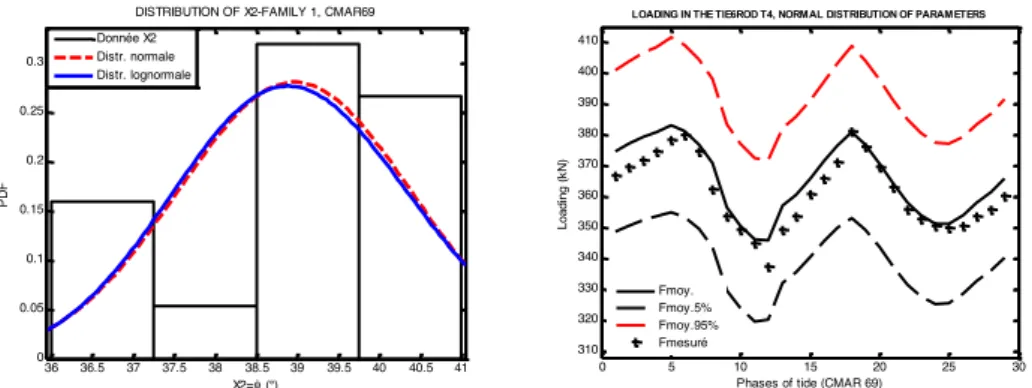
The first interesting result is that we highlight the existence of two groups of tie-rods [1, 6]. The correlation coefficient between X1 and X2 for two families is respectively 0.1252 and -0.423 for the family 1 and the family 2. They are low, this result allows us to assume independent random variables. We present the results of X2 only here.
Fig. 2 Distribution of frictional angle (left); evolution of the measured loading and the computation during a tide (right)
After fitting probability density function from Maximum Likelihood Estimate, we obtain the following parameters (mean and standard deviation) for a normal distribution: (µ = 39°; σ = 1,4°) for family 1 and (µ = 41,7°; σ = 1,2°)
36 36.5 37 37.5 38 38.5 39 39.5 40 40.5 41 0 0.05 0.1 0.15 0.2 0.25 0.3 X2=φ (°) PD F
DISTRIBUTION OF X2-FAMILY 1, CMAR69 Donnée X2 Distr. normale Distr. lognormale 0 5 10 15 20 25 30 310 320 330 340 350 360 370 380 390 400 410
Phases of tide (CMAR 69)
Loadi
ng
(k
N
)
LOADING IN THE TIE6ROD T4, NORMAL DISTRIBUTION OF PARAMETERS
Fmoy. Fmoy.5% Fmoy.95% Fmesuré
for family 2. The support of the distributions contains acceptable values in comparison to litterature.
The empirical distribution and the fitting with existing probability density functions are plotted on Fig. 2 (left). A direct computation of the loading in a tie-rod considering this random variable and others is plotted on Fid. 2 (right) (mean and 5%-95% fractiles): a quadratic response surface fitted on a numerical database is used.
6
CONCLUSION
The paper shows how to identify random properties from monitoring and illustrates that a quadratic response surface can be suitable for predicting the loading in a tie-rod in a wharf.
REFERENCES
[1] SCHOEFS F., YÁÑEZ-GODOY H., LANATA F., 2011, “Polynomial Chaos Representation for Identification of Mechanical Characteristics of Instrumented Structures: Application to a Pile Supported Wharf”,
Computer Aided Civil And Infrastructure Engineering, 26-3, pp. 173–
189.
[2] LANATA F., SCHOEFS F., 2012, “Multi-algorithm approach for identification of structural behaviour of complex structures under cyclic environmental loading”. Journal Structural Health Monitoring, Published online before print February 22th 2011, Vol. 11, No 1, pp. 51-67.
[3] LE K.T., SCHOEFS F., LANATA F., 2012, “Meta-Models For The Assessment Of Soil Stochastic Properties From Monitoring: Application To Harbour Structures”, In ¨Proc. 5th European Conference on
Structural Control (EACS 2012), , 18-20 June 2012, Genoa, Italy.
[4] BOÉRO J., SCHOEFS F. YÁÑEZ-GODOY H., CAPRA, B. 2012, “Time-function reliability of harbour infrastructures from stochastic modelling of corrosion”, Europ. Journ. of Environmental and Civil Engin., in press. [5] BAROTH J., BREYSSE D., SCHOEFS F. (coord). 2011, Construction
reliability, ISTE Ltd - Wiley, 368p.
[6] LE K.T (2012). Identification des caractéristiques aléatoires de remblais à partir du suivi de santé des structures : application aux structures portuaires. PhD Thesis.