HAL Id: hal-00656653
https://hal.archives-ouvertes.fr/hal-00656653
Submitted on 4 Jan 2012HAL is a multi-disciplinary open access archive for the deposit and dissemination of sci-entific research documents, whether they are pub-lished or not. The documents may come from teaching and research institutions in France or abroad, or from public or private research centers.
L’archive ouverte pluridisciplinaire HAL, est destinée au dépôt et à la diffusion de documents scientifiques de niveau recherche, publiés ou non, émanant des établissements d’enseignement et de recherche français ou étrangers, des laboratoires publics ou privés.
Recognizing overlapped particles during a crystallization
process from in situ video images for measuring their
size distributions
Ola Ahmad, Nesrine Gherras, Johan Debayle, Benoît Presles, Gilles Févotte,
Jean-Charles Pinoli
To cite this version:
Ola Ahmad, Nesrine Gherras, Johan Debayle, Benoît Presles, Gilles Févotte, et al.. Recognizing overlapped particles during a crystallization process from in situ video images for measuring their size distributions. ISIC 18 18th International Symposium on Industrial Crystallization, Sep 2011, Zurich, Switzerland. pp.190. �hal-00656653�
RECOGNIZING OVERLAPPED PARTICLES DURING A
CRYSTALLIZATION PROCESS FROM IN SITU VIDEO IMAGES FOR MEASURING THEIR SIZE DISTRIBUTIONS
O. S. Ahmada, J. Debaylea, N. Gherrasa, Benoit Preslesa, Gilles Févottea,b and J.C. Pinolia*
a Ecole Nationale Supérieure des Mines de Saint-Etienne, LPMG, UMR CNRS 5148, 158 cours Fauriel, 42023 Saint-Etienne cedex 2, France. *[email protected]
b Université Lyon 1, Campus de la Doua, 43 Boulevard du 11 Nov. 1918, 69622 Villeurbanne Cedex, France.
Keywords: Process analytical technologies, Process control tools.
This paper presents a method to recognize polygonal-shaped particles (i.e. rectangles, regular/irregular prisms) among agglomerated crystals from in-situ images during a crystallization process. The aim is to measure the particle size distributions (PSD); a key measurement needed for monitoring and controlling industrial crystallization operations [1]. The method is first based on detecting the geometric features of the particles identified by their salient corners. A clustering technique is then applied by grouping three correspondent salient corners belonging to the same polygon. The efficiency of the method is tested on particles of Ammonium Oxalate (AO) monitored during batch crystallization in pure water. Particle size distributions are calculated, and a quantitative comparison between automatic and manual sizing is performed.
The main challenge to achieve a successful and robust characterization of the PSD by image analysis is the segmentation process for separating the overlapping crystals and evaluating their individual size(s). For many, reasons, this is a rather critical problem due to the perspective projection of the 3D crystal shape onto the image plane, the degree of agglomeration or overlapping and the random size of the particles. Many methods [2-3-4-5-6-7] have been proposed to detect the crystals for monitoring the particle size distribution. However, these methods are worthy to be mentioned as they show good efficiency, but they were not sufficient for our particular case since the overlapping level is significantly high.
The goal of this paper is to outline an applied efficient method, based on image analysis [8-9] that could separate the overlapping particles of rectangular and regular/irregular prismatic shapes during the batch crystallization process at different solids concentrations.
The batch crystallization process of Ammonium Oxalate was conducted in pure water. The reactor is a 2L, well-mixed glass vessel. The temperature of the crystallizer was controlled by a heating/cooling bath in a feedback control way. The In situ imaging system consists of a probe (EZProbe sensor) [7-10] equipped with a CCD monochrome camera. The resolution is up to 4μm2 per square pixel, and 640×480 pixels per image. Figure 2(a) shows a typical picture acquired by the immersed probe.
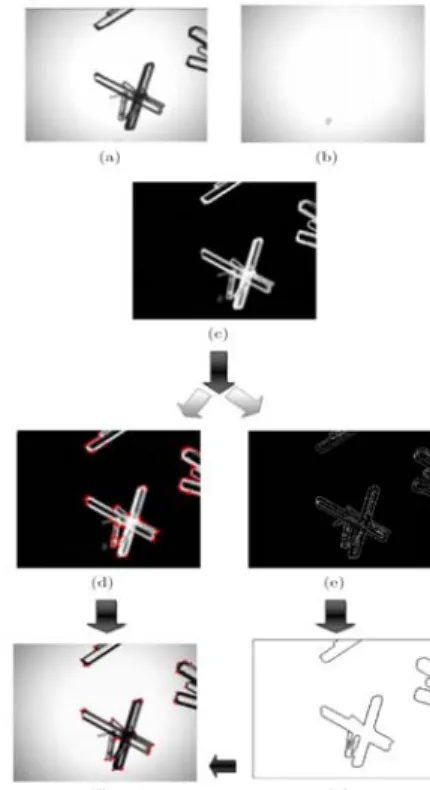
A method [8-9] based on the geometric properties of the particle’s shapes was developed (see Figure 1), to detect the overlapping rectangular and regular/irregular prismatic crystals, by the assumption that each particle can be recognized from grouping three of their correspondent salient (interesting) corners (see Figure (2)f). A computer simulation process has been designed to validate the method, and then experiments have been implemented on the real images.
A salient corner C at any pixel P in the image is defined if and only if two lines (no more) are intersected at P.
Figure 1. Schematic of the method Figure 2. Example of the salient corner detection applied on a real image of Ammonium Oxalate
crystals. (a) Original gray level image. (b) Background image. (c) Removing the background from image (a). (d) Candidate corners image. (e) Multi-scale edge detection. (f) Edge image after contour completion and edge cleaning steps. (g) Salient corners image.
The salient corner detection method (see Figure 2) is based on a course detection of the corners, denoted candidate corners (see Figure (2)d), from a gray scale image (see Figure (2)c), and then on analyzing the candidate corners after detecting the edges (lines) (see Figure (2)g) of the particles from the gray scale image shown in Figure (2)c to finally identify the salient corners (see Figure (2)f).
A multi-scale edge detection method [4-8] is applied to extract the edges of the particles since it shows high efficiency detection of particle’s edges even those of law resolution due to their distance from the camera.
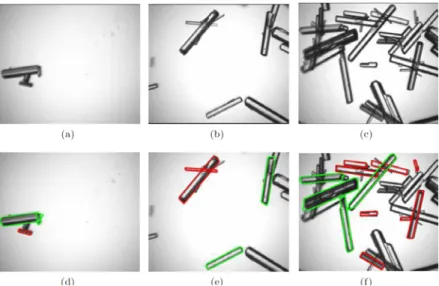
Following the salient corner detection, a clustering technique is developed to recognize rectangular and regular/irregular prismatic overlapping particles (see Figure 3). The method is validated on 150 images acquired in low, intermediate and high solids concentrations. A comparison with the visual recognition by a human expert was performed. The results showed that more than 75% of the particles could be effectively recognized, which was sufficient for monitoring the size distributions. The particle size distributions were estimated for 3 sets of video sequence images (50 images in each set) acquired at low, intermediate and high solids concentrations.
Figure 3. Examples of real images of overlapped Ammonium Oxalate crystals in low, intermediate and high solid concentrations respectively. (a)-(c). Original images. (d)-(f). Recognized particles
The particle size distributions are estimated from calculating the length and width of each recognized crystal. The results show that the particles have a tendency to exhibit a prismatic shape in high agglomeration, whereas the small particles exhibit a rectangular shape. Ammonium Oxalate crystals therefore exhibit a rectangular shape at the beginning of the crystallization, and the faces grow to yield a prismatic shape at high solids concentrations. A quantitative comparison between automatic and manual sizing was performed [9] using the cumulative distribution function which showed that the results were satisfactory.
References:
[1] Anda, J. C. D.; Wang, X.; Lai, X.; Roberts, K. Classifying organic crystals via in process image analysis and the use of monitoring charts to follow polymorphic and morphological changes. J. Process Control. 2005, 15(7), 785–797.
[2] Larsen, P.; Rawlings, J.; Ferrier, N. An algorithm for analyzing noisy, in-situ images of high-aspect-ratio crystals to monitor particle size distribution. Chem.
Eng. Sci. 2006, 61(16), 5236–5248.
[3] Larsen, P.; Rawlings, J.; Ferrier, N. Model-based object recognition to measure crystal size and shape distributions from in-situ video images. Chem. Eng. Sci.
[4] Anda, J. C. D.; Wang, X.; Roberts, K. Multi-scale segmentation image analysis for the in-process monitoring of particle shape with batch crystallizers. Chem.
Eng.Sci. 2005, 60(4), 1053–1065.
[5] Wan, J.; Ma, C. Y.; Wang, X. Z. A method for analyzing on-line video images of crystallization at high-solid concentrations. Particuology. 2008, 6(1), 9–15.
[6] Beucher, S. The watershed transformation applied to image segmentation. In
Scanning Microscopy Intern. Proc. of the 10th Pfefferkorn conference on signal and image processing in microscopy and microanalysis. 1991, 6, 299–314.
[7] Presles, B.; Debayle, J.; Fevotte, G.; Pinoli, J. C. Novel image analysis method for in- situ monitoring the particle size distribution of batch crystallization processes.
Journal of Electronic Imaging. 2010, 19, 1–7.
[8] Ahmad, O. S.; Debayle, J.; Pinoli, J. C. A geometric-based method for recognizing overlapped polygonal-shaped and semi-transparent particles in gray level images.
Submitted paper to Pattern Recognition Letters-Elsevier.
[9] Ahmad, O.; Debayle, J.; Gherras, N.; Presles, B.; Févotte, G.; Pinoli, J. C. Recognizing overlapped particles during a crystallization process from in-situ video images for measuring their size distributions. In 10th SPIE International
Conference on Quality Control by Artificial Vision (QCAV). Saint-Etienne,
France, June 2011.
[10] Presles, B.; Debayle, J.; Rivoire, A.; Févotte, G.; Pinoli, J. C. Monitoring the particle size distribution using image analysis during batch crystallization processes. In 9th IEEE/SPIE Int. Conf. on Quality Control by Artificial Vision
(QCAV). Wels, Austria, 2009.
Acknowledgments. We acknowledge the French research agency ANR for the support