OATAO is an open access repository that collects the work of Toulouse
researchers and makes it freely available over the web where possible
Any correspondence concerning this service should be sent
to the repository administrator:
tech-oatao@listes-diff.inp-toulouse.fr
This is an author’s version published in: http://oatao.univ-toulouse.fr/23265
To cite this version:
Safi, Carl
and Charton, Michael
and Pignolet, Olivier
and Silvestre,
Françoise
and Vaca-Garcia, Carlos
and Pontalier, Pierre-Yves
Influence
of microalgae cell wall characteristics on protein extractability and
determination of nitrogen-to-protein conversion factors. (2013) Journal of
Applied Psychology, 25 (2). 523-529. ISSN 0921-8971
DOi 10.1007/s10811-012-9886-1
Influence of microalgae cell wall characteristics on protein
extractability and determination of nitrogen-to-protein
conversion factors
Carl Safi • Michaël Charton • Olivier Pignolet • Françoise Silvestre • Carlos Vaca-Garcia • Pierre-Yves Pontalier
Abstract Additional evidence about the influence of the
cell wall physical and chemical characteristics on protein extractability was determined by calculating the conversion factors of five different microalgae known to have different cell wall composition, and their protein extracts. The con version factors obtained for crude rigid cell walled Chlore/la vulgaris, Nannochloropsis oculata and Haematococcus plu vialis were 6.35, 6.28 and 6.25, respectively, but for their protein extracts the values were lower with 5.96, 5.86 and 5.63. On the other band, conversion factor obtained for fragile cell walled microalgae Porphyridium cruentum and Athrospira platensis was 6.3 5 for the former and 6.27 for the latter, with no significant difference for their protein extract with 6.34 for the former and 6.21 for the latter. In addition, the highest hydro-soluble protein percentage recovered from total protein was for P. cruentum 80.3 % and A. platensis 69.5 % but lower for C. vulgaris with 43.3 %, N oculata with 33.3 % and H pluvialis with 27.5 %. The study spotted the light on the influence of the cell wall on evaluating the conversion factor and protein extractability. In addition, it showed the necessity of finding the conversion factor every C. Safi (l81) · M. Charton · O. Pignolet · F. Silvestre ·
C. Vaca-Garcia · P.-Y. Pontalier
INP-ENSIACET, Laboratoire de Chimie Agro-industrielle (LCA), Université de Toulouse,
31030 Toulouse, France e-mail: carl.safi@ensiacet.fr
C. Safi · M. Charton · O. Pignolet · F. Silvestre · C. Vaca-Garcia · P.-Y. Pontalier
INRA, UMR 1010 CAi, 31030 Toulouse, France
time accurate protein quantification is required, and proved that there is not a universal conversion factor that can be recommended.
Keywords Amino acid profile • Cell wall • Conversion
factor • Nitrogen • Protein extract
Introduction
Microalgae have been consumed long time ago by the Aztecs and other Mesoamericans who used this biomass as an important food source (Vonshak 1997). Nowadays, in Japan for instance, Chlore/la vulgaris is added to food such as noodles and pasta (Fradique et al. 2010) to improve the nutritional quality of the meal.
Microalgae are gaining interest due to their capacity to accumulate important amounts of multiple components (proteins, lipids, carbohydrates and pigments) compared to any other sources, and therefore protein content is consid ered as one of the cardinal components determining their nutritional value. For instance, Arthrospira (Spirulina) max ima can accumulate proteins up to 71 % dry weight (Becker 1994). Thus, analysing and quantifying the protein content are key factors that should be thoroughly investigated. A capital point is to calculate precisely the nitrogen-to-protein conversion factor (NTP). While the standard value of 6.25 is used, Kjeldahl or elemental analysis may lead to an overesti mation or underestimation of the protein quantity. Moreover, these two methods take into account the totality of the nitrogen present in the biomass from which 59-98 % (Lourenço et al. 1998; Fujihara et al. 2001; Lourenço et al. 2004; Gonzalez
Lopez et al. 2010) of total nitrogen belongs to protein and the rest cornes from pigments, nucleic acids and other inorganic components. It is true that the colorimetric method of Lowry (Lowry et al. 1951) is an accurate method for protein quantification (Peterson 1979; Gonzalez Lopez et al. 2010) and it does not require a conversion factor. Nevertheless, this method determines only the hydro soluble proteins (Crossman et al. 2000; Diniz et al. 2011) and not the total protein content.
In addition, the extraction of proteins can be dimin ished by the cell wall barrier, which can prevent the solubilisation of all the intracellular proteins affecting thus the value of the nitrogen-to-protein conversion factor. Therefore, the impact of the cell wall character istics on protein extractability should be taken into account and analysed in order to prevent an incorrect estimation of the protein content.
Multiple studies have focused on finding a method to rec ommend the right conversion factor; for instance, Gonzalez Lopez et al. (2010) focused on obtaining the conversion factor of five microalgae a:fter breaking the cell wall, and then finding a correlation between protein content and total nitrogen content ( elemental analysis or Kjeldahl). As a result, among five micro algae a new mean conversion factor was estimated to 4.44 (elemental analysis) and 5.95 (Kjeldahl). Another study (Lourenço et al. 2002) determined the conversion factor for 19 tropical seaweeds ha:rvested directly from the beach; and in a second study (Lourenço et al. 1998), 12 marine microalgae were analysed under different growth phases and a mean value of 4.58 was found.
The following study assesses the impact of the cell wall on the protein extractability and the evaluation of the NTP for five microalgae intensively grown worldwide and having wide taxonomie diversity.
Materials and methods
The microalgae used a:re: the cyanobacterium Arthrospira platensis (strain PCC 8005), two Chlorophyceae C. vulgaris (strain SAG 211-19), Haematococcus pluvialis (unknown strain), one Rhodophyta Porphyridium cruentum (strain UTEX 161) and the Eustigmatophyceae Nannochloropsis oculata (unknown stra:in).
Each alga was cultivated in a different culture medium: Hemerick medium for P. cruentum, Sueoka medium for C. vulgaris, Basal medium for H pluvialis, Conway medium for N oculata, and Zarrouk medium for A. platensis. All were grown in batch mode in an indoor tubula:r air-lift photobioreactor (PBR, 10 L) at 25 °C (Loubiere et al. 2011) after inoculation from a prior culture in a fiat panel air-lift PBR (1 L). Culture mixing was by sterile air injection at the bottom of the PBR. The pH and temperature were
recorded by a pH/temperature probe and pH was regulated at 7 .5 with CO2• The algae were harvested during the
exponential growth phase and concentrated by centrifuga tion, and then supplied as a frozen paste from Alpha Biotech (Asserac, France). The biomass contained 20 % dry weight. The frozen paste of crude microalgae was freeze-dried in a Fisher Bioblock Scientific Alpha 2-4 LD Plus device (Illkirch, France).
Protein extraction
Stock solutions were prepared with approximately 500 mL of ultrapure water and some drops of 2 N NaOH to adjust the solution to pH 12. A sample of 1 g of freeze-dried biomass was added to 50 mL of stock solution. The mixture was heated to 40 °C with stirring for 1 h followed by centrifugation at 5,000xg for 10 min. Samples were taken for analysis by the colorimetric method of Lowry et al. ( 1951 ), elemental analysis and amino acid analysis.
Lowry method
A calibration curve was prepared using a concentration range of bovine serum albumin from O to 1,500 µg mL-1.
In order to measure the protein content, 0.2 mL of each standard or samples containing the crude protein extract were withdrawn and then 1 mL of modified Lowry reagent was added to each sample. Each sample was then vortexed and incubated for exactly 10 min. After incubation, 100 µL of Folin-Ciocalteu reagent (1 N) were added and again vortexed and incubated for exactly 30 min. The absorbance was then measured at 750 nm.
Elemental analysis
Total nitrogen of the freeze-dried biomass was evaluated using a PerkinElmer 2400 series II elemental analyser. Samples of2 mg were placed in tin capsules and then heated at 925 °C using pure oxygen as the combustion gas and pure helium as the carrier gas, then evaluating the nitrogen per centage and converting it into protein percentage by using the conversion factors calculated for each microalga in this study.
Amino acid analysis and NTP calculation
The determination of the amino acid composition of the biomass was performed according to a widely used standard method (Moore and Stein 1948). The samples were hydro lysed with 6 N hydrochloric acid at 103 °C for 24 h. Then, the hydrolysed material was adjusted to pH 2.2 with 6 N NaOH and stabilised with a pH 2.2 citrate buffer solution. The final solution was then filtered with 0.45 µm PTFE
membrane to remove any residual solids remaining in the solution. The analysis was performed by using an amino acid analyser Biochrom Ltd 32+ (Cambridge, UK.) equipped with a high pressure PEEK "column+pre-column" (size, 200x4.6 mm) packed with Ultropac cation exchange resin containing sodium. The separation of amino acids is carried
out by elution with loading buffers (flow rate 25 mL h-1) at different pH. After reaction with ninhydrin (flow rate 3 5 mL h -l ), amino acids are detected with a UV detector at a wavelength of 570 nm, with the exception of proline, for which detection occurs at 440 nm. Calculation of NTP was carried out according to the method (kA) of Mossé
(1990) and Sriperm et al. (2011). It should be mentioned that ammonia was added to compensate the value of some less resistant amino acids that disappeared after the strong acid hydrolysis. In addition, the strong hydrolysis of the peptide bonds generates one molecule of water from each amino acid and therefore during the quantification of total amino acid one molecule of water was subtracted from each amino acid in order to get the total amino acid residue which represents the exact quantity of all amino acids (Lourenço et al. 1998; Fujihara et al. 2001).
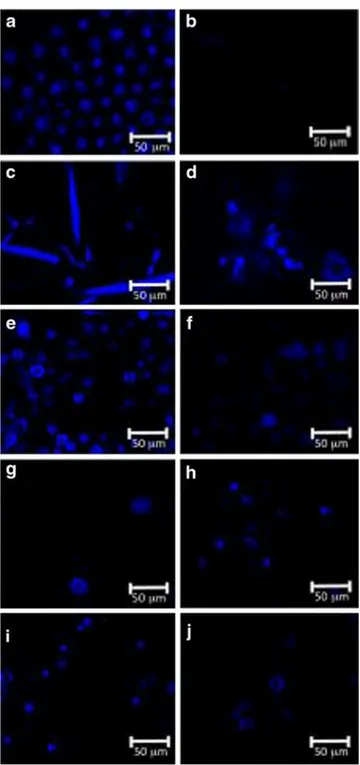
Confocal laser scanning microscopy
Cells were observed with an SP2-AOBS confocal laser scanning microscope (Leica). The fluorochrome calcofluor
white that binds to the ,8---+ 1--4 linkages in the cell wall polysaccharides was added to the samples. Excited at 488 nm, the cells are identified coloured in light blue. Statistical analysis
Three experiments were conducted separately on all micro algae and their protein extract. Statistical analyses were carried out on Microsoft Excel. Measurements of three replicates for each sample were reproducible for ±5 % of the respective mean values.
Results
An amino acid analyser was used to obtain the amino acid profile of the crude microalgae (Table 1) and their protein extract (Table 2). The protein primary composition was recon stituted in order to find the conversion factor (Table 3) that takes into account only the protein nitrogen. The highest conversion factor evaluated for the crude biomass was 6.35 for C. vulgaris and P crnentum and the lowest was 6.25 for H pluvialis. If we compare the NTP value of the crude micro
algae and the protein extract, we observe that there is no significant difference for P cruentum and A. platensis. However, a significant difference was measured for the other three species, which correspond to green microalgae (Table 3). Crude microalgae amino acid composition
Amino acids P. cruentum A. platensis C.vulgaris N oculata H. pluvialis
Table 1 Results of total amino
acids of five microalgae expressed in grams per 100 g of algal protein representing three replicates for three experiments±SD (n=3) Aspartic acid 11.21±0.45 11.82±0.11 10.09±0.02 9.14±0.05 8.85±0.10 Threonine 6.25±0.25 6.16±0.10 5.62±0.01 5.91 ±0.03 5.21±0.06 Serine 8.11±0.29 6.85±0.02 7.17±0.04 6.52±0.01 6.63±0.05 Glutamic acid 8.17±0.29 10.50±0.09 8.37±0.01 10.30±0.02 9.47±0.11 Glycine 6.86±0.28 7.76±0.06 7.93±0.01 9.00±0.01 9.05±0.09 Alanine 6.67±3.67 9.91±0.08 10.05±0.03 10.92±0.01 11.28±0.12 Cysteine 0.33±0.01 0.18±0.02 0.18±0.01 0.19±0.01 0.22±0.01 Valine 2.50±0.10 2.86±0.02 2.85±0.01 3.29±0.02 3.32±0.04 Methionine 2.78±0.11 1.72±0.02 0.60±0.01 1.50±0.01 0.64±0.01 Isoleucine 5.25±0.24 0.12±0.01 0.09±0.01 0.11±0.01 4.53±0.04 Leucine 5.83±0.21 7.02±0.02 6.91±0.02 8.11 ±0.05 8.09±0.10 Tyrosine 4.43±0.18 4.83±0.05 7.78±0.01 3.40±0.02 2.80±0.04 Phenylalanine 5.00±0.20 4.82±0.04 5.36±0.01 5.05±0.01 4.92±0.07 Histidine 1.11±0.04 0.90±0.01 1.16±0.01 0.94±0.01 0.90±0.01 Lysine 5.50±0.21 5.10±0.62 6.30±0.07 5.70±0.01 5.72±0.08 Arginine 7.78±0.29 7.69±0.07 6.81 ±0.03 5.93±0.02 6.10±0.08 Tryptophan 1.39±0.05 1.22±0.01 2.04±0.01 1.24±0.01 1.72±0.02 Omithine 0.27±0.01 0.16±0.09 0.12±0.01 0.16±0.01 0.07±0.01 Proline 2.53±0.17 1.95±0.05 2.74±0.07 4.20±0.07 2.94±1.15 Ammonia 8.02±0.30 8.41±0.09 7.82±0.02 8.38±0.08 7.52±0.08
Table 2 Results of total amino
acids of the protein extract Protein extract amino acid composition extracted at pH 12 and 40 °C of
five microalgae expressed in Amino acids P. cruentum
grams per 100 g of algal protein
representing three replicates for Aspartic acid 10.71±0.02
three experiments±SD (n=3) Threonine 4.45±0.01
Serine 7.49±0.02 Glutamic acid 9.05±0.01 Glycine 7.68±0.01 Alanine 10.46±0.02 Cysteine 0.27±0.01 Valine 3.15±0.01 Methionine 2.37±0.01 Isoleucine 5.34±0.02 Leucine 7.30±0.01 Tyrosine 3.69±0.01 Phenylalanine 4.12±0.01 Histidine 0.79±0.03 Lysine 5.60±0.01 Arginine 6.63±0.02 Tryptophan 0.72±0.02 Omithine 0.22±0.01 Proline 1.87±0.02 Ammonia 8.05±0.04
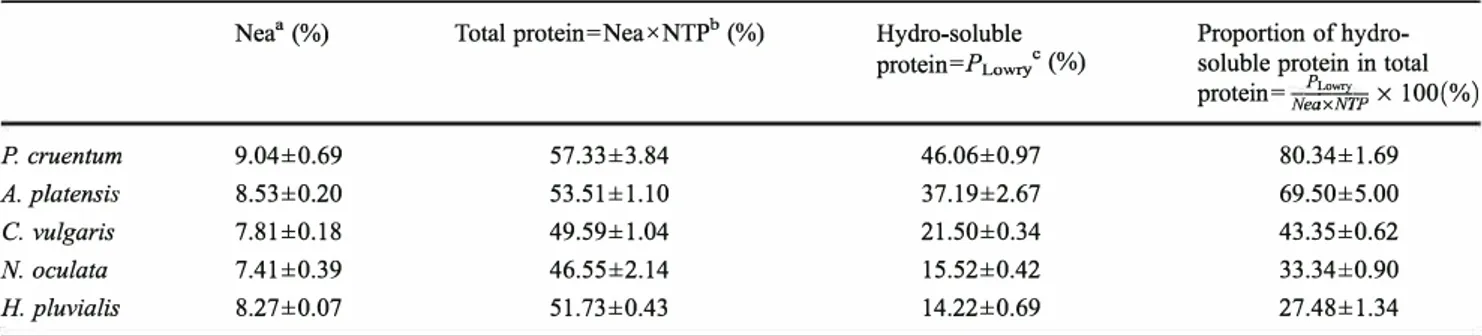
The total nitrogen content of crude microalgae was determined by elemental analysis. The hydro-soluble proteins were quantified by the Lowry method. By using the NTP values from Table 3, the total proteins and the corresponding fraction of hydro-soluble proteins were accu rately determined starting from the results of elemental anal ysis (Table 4).
A small difference was observed between the essential and non-essential amino acids total percentage for P cruen tum, A. platensis and C. vulgaris and their protein extract, and an important difference was observed for N oculata and H. pluvialis with a noticeable increase in non-essential
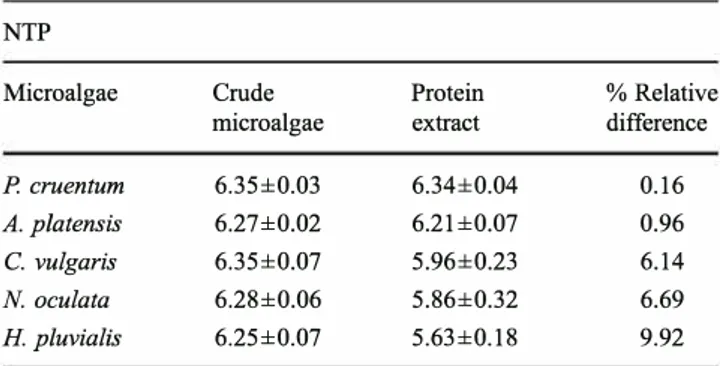
Table 3 Nitrogen-to-protein conversion factors for the crude micro algae and their protein isolate based on three replicates for three experiments±SD (n=3)
NTP
Microalgae Crude Protein % Relative
microalgae extract difference
P. cruentum 6.35±0.03 6.34±0.04 0.16
A. platensis 6.27±0.02 6.21±0.07 0.96
C.vulgaris 6.35±0.07 5.96±0.23 6.14
N. oculata 6.28±0.06 5.86±0.32 6.69
H. pluvialis 6.25±0.07 5.63±0.18 9.92
A. platensis C.vulgaris N. oculata H. pluvialis
9.70±0.02 6.81±0.28 4.47±0.05 6.54±0.07 5.54±0.04 4.16±0.19 3.18±0.04 3.70±0.02 7.25±0.03 5.73±0.27 3.16±0.06 5.66±0.01 11.65±0.02 11.63±0.51 22.60±0.19 13.55±0.01 8.42±0.02 9.75±0.42 8.79±0.10 11.00±0.01 10.94±0.02 16.82±0.75 14.02±0.13 19.12±0.03 0.20±0.01 0.24±0.01 0.38±0.01 0.40±0.01 3.31 ±0.01 3.66±0.15 2.36±0.03 2.80±0.01 1.71 ±0.01 1.28±0.04 1.23±0.03 1.04±0.01 0.12±0.01 2.32±1.87 1.08±1.44 3.06±0.01 8.02±0.02 7.15±0.33 4.11±0.04 4.99±0.03 4.33±0.01 2.56±0.10 2.15±0.07 1.91±0.02 4.26±0.01 2.74±0.12 1.63±0.02 2.63±0.01 0.73±0.01 0.53±0.03 0.28±0.01 0.43±0.01 5.39±0.01 6.16±0.27 2.35±0.01 3.48±0.01 6.84±0.01 5.85±2.71 1.96±0.09 6.88±0.01 1.07±0.01 0.49±0.02 0.18±0.01 0.31±0.01 0.23±0.01 0.50±0.02 0.55±0.03 0.43±0.01 1.86±0.08 2.11±0.13 14.41±0.33 1.61±0.04 8.39±0.01 9.47±0.44 11.09±0.31 10.37±0.06
amino acids percentage in the protein extract and a decrease in essential amino acids percentage (Table 5).
Finally, the laser scanning confocal microscopie images presented in Fig. 1 showed that in the case of P cruentum and A. platensis a total disruption of the cell wall occurred after the alkaline treatment, whereas C. vulgaris, N oculata and H. pluvialis maintained their globular form indicating that at least a part of their cell wall was intact.
Discussion
The present study contributes original individual NTP con version factors for five current species of microalgae. Indeed, direct comparison of our results with literature values can only be done for N oculata (Lourenço et al. 1998); the report from Gonzalez Lopez et al. (2010) combines all the cyanobacteria and P cruentum in a global result. To our knowledge, NTP data for C. vulgaris and H. pluvialis have never been reported. Moreover, according to Mossé (1990), there are three kinds of NTP conversion factors called k, kA and kp (Yeoh and Truong
1996; Sriperm et al. 2011). In this study, kA was calculated for
all species, and this kind of conversion factor is larger than kp and k. For this reason, there is a significant difference between the conversion factors calculated for N oculata in this study (6.28) and the one calculated for the same microalga (4.87) in the Lourenço et al. (1998) study.
Table 4 Different protein contents in crude microalgae
Nea" (%) Total protein=NeaxNTPb (%) Hydro-soluble
protein=PLowr/ (%)
Proportion of hydro soluble protein in total protein= N:0";.Tfrp x 100(%) P. cruentum 9.04±0.69 57.33±3.84 A. platensis 8.53±0.20 53.51±1.10 C.vulgaris 7.81±0.18 49.59±1.04 N. oculata 7.41±0.39 46.55±2.14 H. pluvialis 8.27±0.07 51.73±0.43
"Nea, total nitrogen % (dw) obtained by elemental analysis
b NTP, nitrogen-to-protein conversion factor from Table 3
46.06±0.97 37.19±2.67 21.50±0.34 15.52±0.42 14.22±0.69 80.34±1.69 69.50±5.00 43.35±0.62 33.34±0.90 27.48±1.34
c PLowry, hydro-soluble protein % (dw) at pH 12 and 40 °C calculated by Lowry method
The NTP conversion factor of the crude microalgae and their protein extract depended on the type of microalgae. If we calculate the relative difference between these two values for a single species, we observe that there is almost no difference in the case of red algae and cyanobacteria, whereas it reached almost 10 % for green microalgae (Table 3). These differences can be correlated to the rigidity of the cell wall. Indeed, it is generally accepted that green microalgae possess a more rigid cell wall than red algae or cyanobacteria. More in detail, P cruentum does not have a true cell wall but instead encapsu lated by a layer of sulfurized polysaccharides (Arad et al. 1985, 1988; Adda et al. 1986; Geresh and Arad 1991; Geresh et al. 2002; Sobczuk et al. 2006). A. platensis has a relatively fragile cell wall mainly composed of murein without cellulose (Lee 2008; Lu et al. 2006). As far as the green microalgae, the chlorophycean C. vulgaris and the eustigma tophycean N. oculata, both have a cell wall mainly composed of cellulose and hemicelluloses (Payne and Rippingale 2000). The highest difference perceived was for H pluvialis, which has a thick trilaminar cell wall composed of cellulose and sporopollenin in the aplanospore stage (Mendes Pinto et al. 2001; Montsant et al. 2001; Aflalo et al. 2007). The composition of its cell wall makes this microalga less permeable and extremely mechanically resistant (Hagen et al. 2002).
Crude microalgae
Taking into account the standard deviation of the three samples considered for each microalga, we could affirm that, at 95 % of confidence level, all the values of total protein content shown in Table 4 are statistically equivalent. This fact is noteworthy, because when we consider the extracted hydro-soluble proteins (Table 4), we observe that their amounts decrease following the same correlation than the differences in NTP value: high extraction for the micro algae with no real cell wall and very low extraction for the most rigid of all. Therefore, the hydro-soluble protein capa ble to be extracted under alkaline conditions from inside the cell is correlated to the cell wall characteristics and to the freeze-drying process that conserves well the samples but it makes the protein extraction more difficult for some algal species. In addition, the high values of hydro-soluble proteins extracted especially for P cruentum and A. platensis could be explained by the possible presence of
peptides and free amino acids because no precipitation was carried out (Nguyen and Harvey 1994; Barbarino and Lourenço 2005).
Further evidence was found in the variation in composition relative to essential and non-essential amino acids (Table 5) in the protein extract of the green microalgae. There was a significant drop in the percentage of essential amino acids ranging from 13.9 % for C. vulgaris to 49.1 %
Protein extract
Table 5 Percentage (dw) of essential and non-essential amino acids for each microalga
and its protein extract Essential N on-essential Not identified Essential Non-essential Not identified
P. cruentum 46.81 44.89 8.29 44.58 47.15 8.27
A. platensis 41.76 49.67 8.57 39.87 51.50 8.62
C. vulgaris 41.02 51.03 7.94 35.32 54.70 9.97
N. oculata 41.00 50.46 8.53 20.88 67.47 11.64
Fig. 1 Laser scanning confocal microscopie observation before (left)
and after (right) alkaline treatment for each microalga. a and b P.
cruentum, c and d A. platensis, e and f C. vulgaris, g and h N oculata,
i and j H pluvialis
for N oculata and an increase in non-essential amino acids from 6.7 % for the former to 25.2 % for the latter. On the contrary, only small changes in the com position of the proteins were detected for fragile cell wall microalgae, with a percentage difference ranging from 4.5 % for A. platensis to 4.8 % for the essential amino acids of P cruentum, whereas non-essential amino
acids difference ranged from 3.5 % for the former to 4.8 % for the latter.
These correlations with the relative hardness of the cell wall can integrate a chemical dimension as well. Indeed, the sporopollenin contained in the most rigid cell wall (H pluvia lis) is known to be extremely resistant to chemical agents (Hagen et al. 2002). But in the case of cellulose-rich cell walls, such as C. vulgaris and N oculata, the sodium hydroxide is able to penetrate the microcrystalline structure of cellulose to form alcoholates in a process similar to mercerisation. Sodium hydroxide can also dissolve the hemicelluloses attached to cellulose. The partial permeation of this kind of cell wall can therefore occur by alkaline action. Finally, A. platensis has a cell wall rich in amino sugars cross-linked with oligopeptide chains. The former are labile in alkaline conditions by deami dation of the N-acetylglucosamine and the latter are soluble in alkaline conditions. The cell wall becomes therefore very permeable allowing the alkaline extraction of proteins. In summary, the chemical action acts in synergy with the me chanical characteristics of the cell wall.
Extraction of proteins together with the evaluation of the conversion factor brought additional evidence that the cell wall of any microalga plays an important role in protein quantification. This means that not taking it into consider ation may lead to wrong quantification of the protein con tent. In addition, for microalgae, there is not a universal conversion factor that can be recommended for all species as demonstrated by comparison of our study with many studies which have been carried out on dozens of different microalgae. Therefore, every time accurate quantification of protein is needed, it will be required to evaluate the conver sion factor. In addition, this study showed a correlation between the cell wall rigidity and/or the chemical structure and the differences in NTP conversion value. Microalgae with fragile cell wall did not show significant differences with their protein extract, which was the complete opposite for the microalgae having a rigid cell wall that showed noticeable difference on evaluating the conversion factor of their protein extract, and therefore, breaking or permea bilize the rigid cell wall of C. vulgaris, N oculata and H pluvialis is strongly required to prevent underestimation of
the protein content after extraction. Logically, there is no need for cell wall breaking for P cruentum since it does not have a cell wall and conceming A. platensis soft cell wall disruption technique is needed to make sure that its fragile cell wall will not hinder the extraction of any intracellular components.
Acknowledgments The authors would like to thank Alpha Biotech
for providing the biomass and also we are thankful to Dr Philippe Michaud, Dr Celine Laroche, Mr Jean-François Fabre and Mrs Cécile Pouzet for their support and expertise. This work was supported by the French National Research Agency (ANR) in the context of Algoraffinerie project.
References
Adda M, Merchuk JC, Arad S (1986) Effect of nitrate on growth and production of cell-wall polysaccharide by the unicellular red alga
Porphyridium. Biomass 10: 131-140
Aflalo C, Meshulam Y, Zarka A, Boussiba S (2007) On the relative efficiency of two- vs. one-stage production of astaxanthin by the green algaHaematococcus pluvialis. Biotechnol Bioeng 98:300--305 Arad S, Adda M, Cohen E (1985) The potential of production of sulfated
polysaccharides from Porphyridium. Plant Soil 89: 11 7-127 Arad S, Friedman 0, Rotem A (1988) Effect of nitrogen on polysac
charide production in a Porphyridium sp. Appl Environ Microbiol 54:2411-2414
Barbarino E, Lourenço SO (2005) An evaluation ofmethodologies for extraction and quantification of protein of marine macro-and microalgae. J Appl Phycol 17:447-460
Becker EW (1994) Microalgae biotechnology and microbiology. Cam bridge University Press, Cambridge
Crossman DJ, Clements KD, Cooper GJS (2000) Determination of protein for studies of marine herbivory: a comparison of methods. J Exp Mar Biol Ecol 244:45-65
Diniz GS, Barbarino E, Oiano-Neto J, Pacheco S, Lourenço SO (2011) Gross chemical profile and calculation of nitrogen-to-protein con version factors for five tropical seaweeds. Am J Plant Sei 2:287-296 Fradique M, Batista AP, Nunes MC, Gouveia L, Bandarra NM, Raymundo A (2010) Incorporation of Chlorella vulgaris and Spirulina maxima
biomass in pasta products. Part 1: preparation and evaluation. J Sei Food Agric 90:1656-1664
Fujihara S, Kasuga A, Aoyagi Y (2001) Nitrogen-to-protein conversion factors for common vegetables in Japan. J Food Sei 66:412-415 Geresh S, Arad S (1991) The extracellular polysaccharides of the red
microalgae: chemistry and rheology. Bioresour Technol 38: 195-201 Geresh S, Mamontov A, Weinstein J (2002) Sulfation of extracellular polysaccharides of red microalgae: preparation, characterization and properties. J Biochem Biophys Meth 50: 179-187
Gonzalez Lopez CV, Garcia MDCC, Femandez FGA, Bustos CS, Chisti Y, Sevilla JMF (2010) Protein measurements of microalgal and cyanobacterial biomass. Bioresour Technol 101:7587-7591 Hagen C, Siegmund S, Braune W (2002) Ultrastructure and chemical
changes in the cell wall of Haematococcus pluvialis (Volvocales, Chlorophyta) during aplanospore formation. Eur J Phycol 37:217-226
Lee RE (2008) Phycology. Cambridge University Press, Cambridge Loubiere K, Pruvost J, Aloui F, Legrand J (2011) Investigations in an
extemal-loop airlift photobioreactor with annular light chambers and swirling flow. Chem Eng Res Des 89:164-171
Lourenço SO, Barbarino E, Marquez UML, Aidar E (1998) Distribu tion of intracellular nitrogen in marine microalgae: basis for the calculation of specific nitrogen-to-protein conversion factors. J Phycol 34:798-811
Lourenço SO, Barbarino E, De-Paula JC, Pereira LODS, Marquez UML (2002) Amino acid composition, protein content and calcu lation of nitrogen-to-protein conversion factors for 19 tropical seaweeds. Phycol Res 50:233-241
Lourenço SO, Barbarino E, Lavan PL, Lanfer Marquez UM, Aidar E (2004) Distribution of intracellular nitrogen in marine microalgae: calculation of new nitrogen-to-protein conversion factors. Eur J Phycol 39:17-32
Lowry OH, Rosebrough NJ, Farr AL, Randall RJ (1951) Protein mea surement with the Folin phenol reagent. J Biol Chem 193:265-275
Lu HK, Hsieh CC, Hsu JJ, Yang YK, Chou HN (2006) Preven tive effects of Spirulina platensis on skeletal muscle damage under exercise-induced oxidative stress. Eur J Appl Physiol 98:220-226
Mendes-Pinto MM, Raposo MFJ, Bowen J, Young AJ, Morais R (2001) Evaluation of different cell disruption processes on encysted cells of Haematococcus pluvialis: effects on astaxanthin recovery and implications for bioavailability. J Appl Phycol 13:19-24
Montsant A, Zarka A, Boussiba S (2001) Presence of a nonhydrolyzable biopolymer in the cell wall of vegetative cells and astaxanthin-rich cysts of Haematococcus pluvialis (Chlorophyceae). Mar Biotechnol 3:515-521
Moore S, Stein WH (1948) Photometric ninhydrin method for use in the chromatography of amino acids. J Biol Chem 176:367-388 Mossé J (1990) Nitrogen-to-protein conversion factor for ten cereals
and six legumes or oilseeds. A reappraisal of its definition and determination. Variation according to species and to seed protein content. J Agric Food Chem 38:18--24
Nguyen RT, Harvey HR (1994) A rapid micro-scale method for the extraction and analysis of protein in marine samples. Mar Chem 45:1-14
Payne MF, Rippingale RJ (2000) Evaluation of diets for culture of the calanoid copepod Gladioferens imparipes. Aquaculture 187:85-96
Peterson GL (1979) Review of the Folin phenol protein quantitation method of Lowry, Rosebrough, Farr and Randall. Anal Biochem 100:201-220
Sobczuk T, Camacho F, Grima E, Chisti Y (2006) Effects of agitation on the microalgae Phaeodactylum tricornutum and Porphyridium
cruentum. Bioproc Biosys Eng 28:243-250
Sriperm N, Pesti GM, Tillman PB (2011) Evaluation of the fixed nitrogen-to-protein (N:P) conversion factor (6.25) versus ingredi ent specific N:P conversion factors in feedstuffs. J Sei Food Agric 91:1182-1186
Vonshak A (1997) Spirulina platensis (Arthrospira). Physiology, cell biology and biotechnology. Taylor and Francis, London Yeoh HH, Truong VD (1996) Protein contents, amino acid composi
tions and nitrogen-to-protein conversion factors for cassava roots. J Sei Food Agric 70:51-54